Meta-Analysis of the Relationship between Normal Tension Glaucoma,Open-Angle Glaucoma, and Fractional Pressure Reserve
2020-04-25QiLiNingliWangZhichengLiuLinLiZhichengLiuWenjiaWangXiaoxueLongandHongfangSong
Qi Li,Ningli Wang,Zhicheng Liu,Lin Li,Zhicheng Liu,Wenjia Wang,Xiaoxue Long and Hongfang Song,*
1School of Biomedical Engineering, Capital Medical University,Beijing, 100069,China
2Beijing Key Laboratory of Fundamental Research on Biomechanics in Clinical Application, Capital Medical University,Beijing,100069,China
3Beijing Tongren Eye Center,Beijing Tongren Hospital, Capital Medical University,Beijing, 100730,China
Abstract:Aim:To investigate the relationship between glaucoma and intraocular pressure(IOP),intracranial pressure(ICP),trans-laminar cribrosa pressure difference (TLCPD), and the newly proposed fractional pressure reserve(FPR).Methods:Ten articles were analyzed by meta-analysis, and subgroup analysis of three factors was conducted.Results:The patients with normal tension glaucoma(NTG)and open-angle glaucoma(OAG)have higher TLCPD and lower ICP than healthy subjects,with obvious heterogeneity.The greater heterogeneity may arise from different ICP measurements and from different countries or regions.FPR performs better than TLCPD in some ways.Conclusion:Both FPR and TLCPD can be used as indicators of NTG and OAG, and FPR is more effective than TLCPD in comparisons between different experiments or individuals.
Keywords:Glaucoma; intraocular pressure; intracranial pressure; trans-laminar cribrosa pressure difference;meta-analysis
1 Introduction
Glaucoma is a group of diseases characterized by atrophy and depression of optic nerve head cupping,visual field loss, and vision loss.It is predicted that in 2020 the number of patients with glaucoma will increase to 79.6 million,with 74%having open-angle glaucoma (OAG)[1].
Glaucoma is usually caused by elevated intraocular pressure (IOP) that compresses the optic nerve.Although IOP is considered a risk factor for glaucoma, some patients with glaucoma have low or normal IOP (termed normal tension glaucoma:NTG).without elevated IOP.Given that IOP may not be the only risk factor for glaucoma [2], Yavin et al.carried out a meta-analysis and found that there was a correlation between intracranial pressure (ICP) and IOP, and that this imbalance between ICP and IOP might be one of the causes of normal tension glaucoma(NTG) [3].Wang et al.performed experiments on monkeys and found that it was very necessary to consider both ICP and IOP in evaluating changes in the structure of the lamina cribrosa [4].Expanding on these findings, Mathieu et al.proposed the concept of trans-laminar cribrosa pressure difference (TLCPD) and speculated that the difference between IOP and ICP might lead to blockage of axial flow or optic disc capillary blood flow,thus causing changes in the optic disc[5,6].The primary insult appears to take place at the optic nerve head.Increased IOP and ischemia at the post-laminar optic nerve head affects retinal ganglion cell axons.Modulating factors are the biomechanical properties of the tissues and cerebrospinal fluid pressure (CSFP) [7].TLCPD has become one of the influential factors in the diagnosis and treatment of glaucoma, and plays an important role in not only NTG but also other types of glaucoma such as OAG.Despite multiple experiments having been performed in relation to TLCPD, the results have varied.The main problem seems to be that each study has a different method and context,which makes it impossible to reach similar conclusions.
For the purpose of drawing a comprehensive conclusion by identifying a definitive influence from different articles,meta-analysis represents a good method for the analysis of a large collection of results from individual studies in order to integrate the findings.Although several meta-analyses have addressed this issue,either they did not carry out heterogeneity analysis[8]or the number of studies included was small[6].
To improve their analysis, the authors have devised a new dimensionless index named the fractional pressure reserve (FPR), IOP divided by ICP, which converts the absolute value of pressure into a relative value, whereby the effect of relative changes in IOP and ICP on glaucoma can be evaluated more objectively [9].FPR is a dimensionless ratio, which may objectively reflect the variation of pressure relative to the baseline.From a biomechanical perspective, the risk factors for glaucoma include the mechanical properties of the eye and the mechanical environment.IOP and ICP are mechanical environment factors.But FPR, the combination of IOP and ICP, may reflect individual differences in patient quality beyond the biomechanical perspective.
This paper applies meta-analysis to investigate the relationship between glaucoma and IOP, ICP, and TLCPD, and to evaluate the effectiveness of the new indicator, FPR.The influence of various factors(including ICP measurement, Countries or Regions,OAG or primary OAG[POAG]) is also discussed.
2 Methods
2.1 Literature Retrieval Strategy
The research data were obtained from case-control studies of OAG and NTG.The retrieved databases included Web of Science,PubMed,Cochrane,CNKI,and Wanfang Data.The start and end time of the search was set as January 1,2008 to December 1,2018.The search words were glaucoma,IOP,ICP,and TLCPD.In addition, studies that could be included were screened from other meta-analysis literatures in the aforementioned databases.
2.2 Inclusion and Exclusion Criteria
2.2.1 Inclusion Criteria
(1) In published cross-sectional and case-control studies, the blind method was not restricted; (2) the subjects of the study were all patients consistent with OAG and NTG; (3) OAG or NTG patients were included in the case group, and healthy people without glaucoma were included in the control group; (4)the mean, standard deviation, and cases of IOP, ICP, and TLCPD are clearly described; (5) measurement methods are not limited,and the equivalent formula of CSFP can be included as ICP.
2.2.2 Inclusion Criteria
(1)Literature repeatedly published or with unknown data;(2)inadequate type of literature(e.g.,review articles of review, research status, case reports, experience summary, theoretical discussion or summary);(3) the study was an uncontrolled study or an animal experiment.
2.3 Data Extraction
Data related to IOP,ICP,and TLCPD were collected.The measurement methods and grouping methods were recorded.
According to the definition of TLCPD,its calculation formula is TLCPD=(the pressure in front of the cribrosa)-(the pressure behind the cribrosa)[10].The pressure in front of the cribrosa is expressed by IOP.What IOP measured is the cross-corneal pressure difference,which is the difference between intraocular and atmospheric pressure.Goldmann applanation tonometry remains the gold standard for the measurement of IOP.The pressure behind the cribrosa is expressed by ICP,mainly derived from the CSFP behind the cribrosa[11].Lumbar puncture is the main invasive method of measuring ICP [12], although there are also noninvasive methods [13].CSFP estimated by the equivalent formula is regarded as ICP [14].
2.4 Statistical Analysis
The data were statistically analyzed using RevMan 5.3 software (Cochrane Collaboration).The stochastic effect model was used to calculate the combined effect.Heterogeneity was investigated by subgroup analysis.
2.5 FPR Calculation Method
According to the definition of FPR = IOP/ICP, FPR was calculated from the IOP and ICP data taken from the literatures.Considering the distribution of IOP/ICP as the ratio of normally distributed variables,the probability density function is

where

If 95%confidence interval is(EZ-m,EZ+m),then

The standard deviation of the equivalent normal distribution is
Taking IOP as X,ICP as Y,and FPR as Z,the mean and standard deviation of FPR can be derived from the mean and standard deviation of IOP and ICP in the literature according to the formulas.The mean and standard deviation of FPR obtained by this method were used as data for our meta-analysis.
3 Results
3.1 Literature Retrieval Results
According to the retrieval strategy, 408 articles were detected.After application of the inclusion and exclusion criteria, a total of 10 research articles were included (Fig.1).Their basic characteristics are shown in Tab.1 with more features in Appendix A.The 10 research articles are Kim et al.[15], Ren et al.[16], Jonas et al.[17], Lee et al.[18], Berdahl et al.[19], Lindén et al.[20], Jonas et al.[21],Siaudvytyte et al.[22], Jonas et al.[14], and Zhang et al.[23].
3.2 Meta-Analysis Results

Figure 1:Summary of article selection process

Table 1:Basic features of the included research literature

Figure 2:Meta-analysis results.(a)IOP in NTG,(b)ICP in NTG,(c)TLCPD in NTG,(d)IOP in OAG,(e)ICP in OAG, (f) TLCPD in OAG
The results of the analysis are shown in Fig.2.It was found that IOP showed a statistically insignificant difference between NTG and healthy subjects,ICP and TLCPD showed a statistically significant difference between NTG and healthy subjects,and IOP,ICP,and TLCPD showed a statistically significant difference between OAG and healthy subjects.However,these differences are very heterogeneous(p<0.05,I2 >50%).The IOP of NTG patients was the same as that of normal subjects, whereas the IOP of OAG patients was higher than that of the normal population.The ICP of NTG and OAG patients was lower than that of normal subjects, while the TLCPD of NTG and OAG patients was higher than that of the normal population.The change in TLCPD is more obvious than that in ICP.
3.3 Subgroup Analysis Results
Because of the high heterogeneity of meta-analysis results,we conducted a subgroup analysis.Taking into account the differences of various factors, the following subgroups were adopted:ICP measurement,Countries or Regions,OAG or POAG.
3.3.1 ICP Measurement
By grouping literature according to ICP measurement methods, the lumber puncture, two-depth TCP and CSFP equivalent formulas can be obtained.The results of this analysis are shown in Figs.3 and 4.
Considering the influence of ICP measurement, the inter-subgroup heterogeneity of the ICP measurement subgroup in NTG was low, which means that the differences in ICP measurement in NTG are not a source of heterogeneity.The high intra-subgroup heterogeneity of the lumbar puncture subgroup was due to a negative result [20], especially the consistency of posture when measuring IOP and ICP,which remains a controversial issue [24-26].However, in OAG patients the heterogeneity of the lumbar puncture subgroup was low, which means that these two articles could be combined.In fact, there is a high degree of similarity between these two studies.Intra-subgroup heterogeneity of CSFP equivalent formulas and inter-subgroup heterogeneity in OAG were both high, meaning that differences in ICP measurement in OAG patients are a source of heterogeneity.
3.3.2 Countries or Regions
By grouping literature according to countries or regions, America, China, India, Korea, and Sweden were extracted.The results of the analysis are shown in Figs.5 and 6.
Considering the influence of Countries and Regions,the inter-subgroup heterogeneity in OAG was high,meaning that OAG is sensitive to Countries and Regions.The inter-subgroup heterogeneity of ICP in NTG was high,but IOP and TLCPD were low,meaning that ICP in NTG is sensitive to Countries and Regions whereas IOP and TLCPD are not.For NTG,the inter-subgroup heterogeneity of ICP was low in America whereas IOP and TLCPD were high,which shows that patients with NTG have lower ICP than healthy subjects in America.
3.3.3 OAG or POAG
By grouping the literature according to whether OAG is POAG,OAG and POAG can be delineated in OAG patients.The results of the analysis are shown in Fig.7.
Considering the influence of whether OAG is POAG,the inter-subgroup heterogeneity was low,which means that whether OAG is POAG is not the source of heterogeneity.This may be because the IOP,ICP,and TLCPD in OAG patients produced the same result regardless of whether it was POAG.
3.4 FPR Results
The results of the FPR analysis are shown in Figs.8-10.The FPR of NTG and OAG patients was higher than that of the normal population,similar to TLCPD.However,the mean differences in FPR were smaller than in TLCPD,and the inter-study variance was greatly reduced(Tau2).The high heterogeneity arises from the same causes as TLCPD, although in some subgroups the heterogeneity is lower than in TLCPD (I2 <50%).In addition, the mean differences in each study were closer than for TLCPD, which means that FPR represents a more stable indicator of glaucoma.Because the ratios are centered at 1, the FPRs in different studies were more closely matched than the TLCPDs.These data suggest that FPR may be more suitable for comparing different studies.

Figure 3:Subgroup analysis results.(a)IOP-ICP measurement in NTG,(b)ICP-ICP measurement in NTG,(c)TLCPD-ICP measurement in NTG
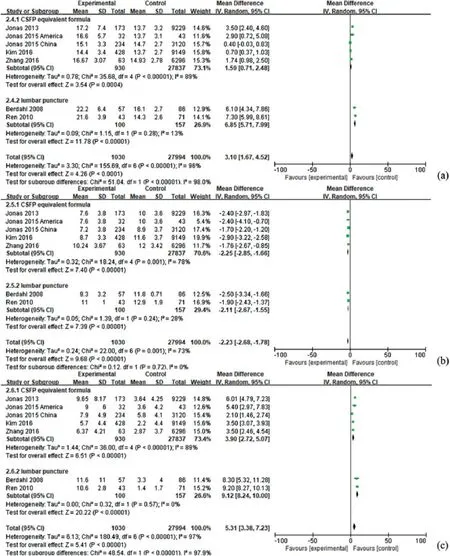
Figure 4:Subgroup analysis results.(a)IOP-ICP measurement in OAG,(b)ICP-ICP measurement in OAG,(c)TLCPD-ICP measurement in OAG
4 Discussion
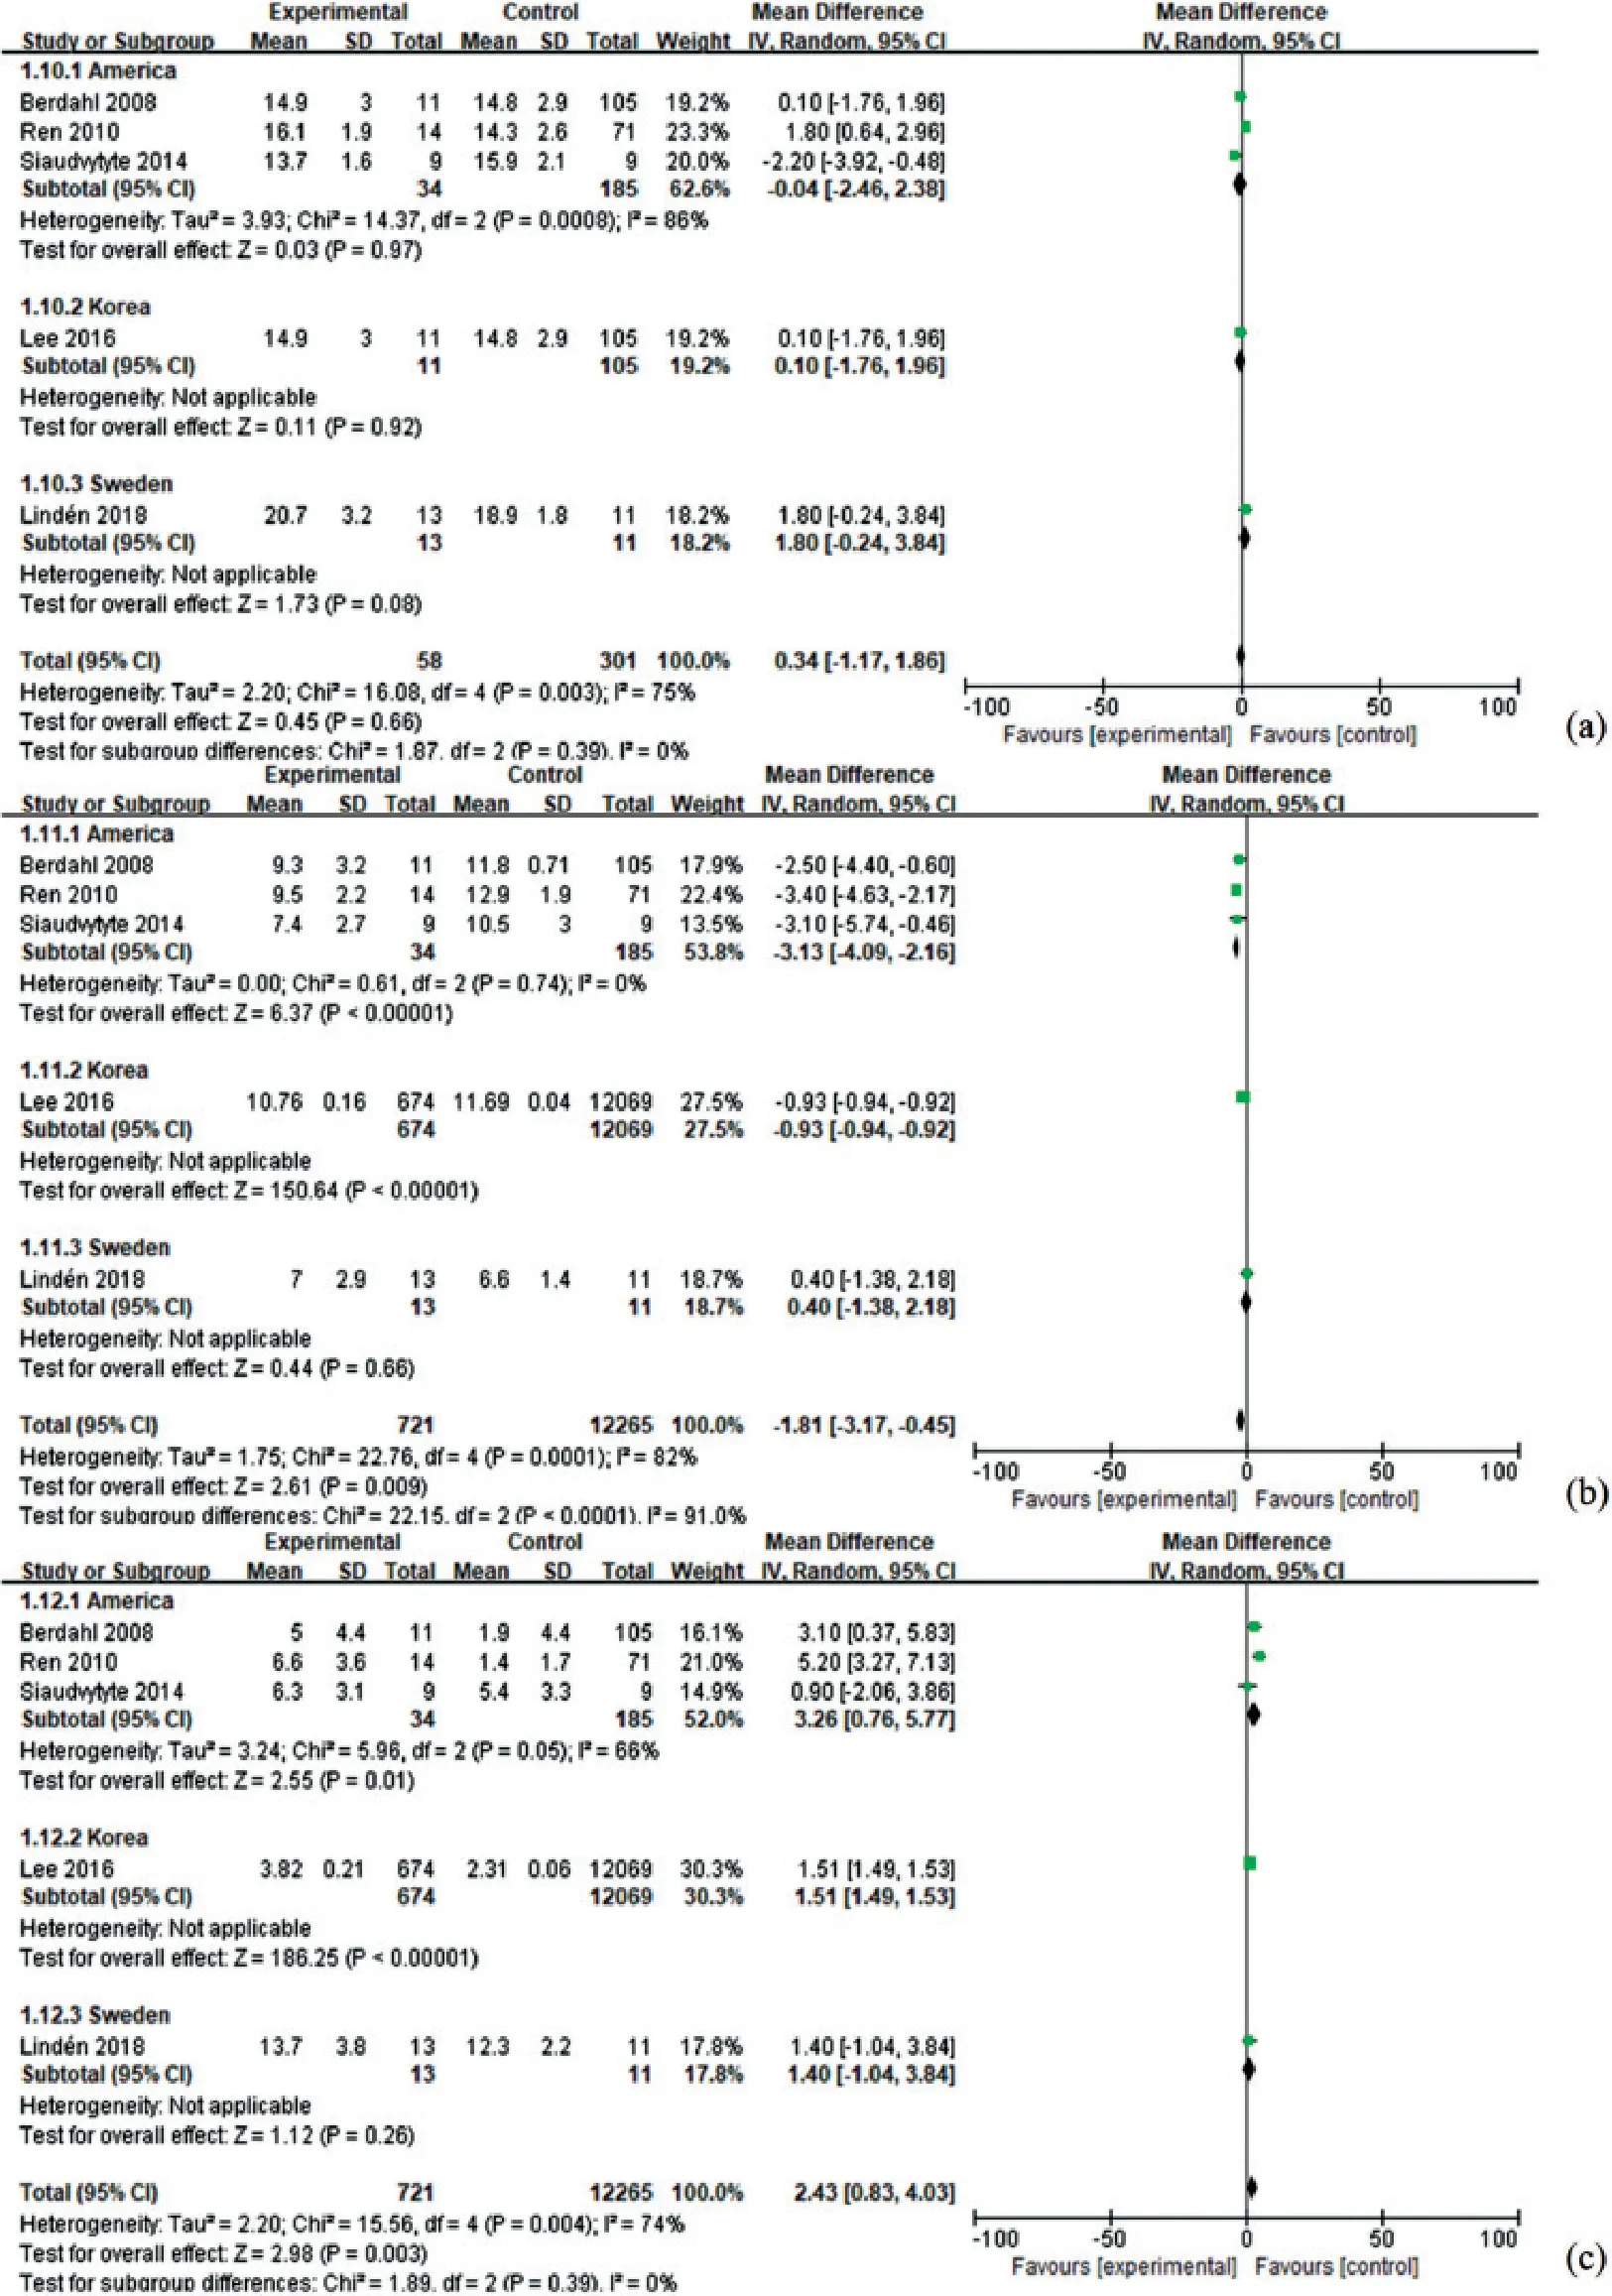
Figure 5:Subgroup analysis results.(a)IOP-Countries or Regions in NTG,(b)ICP-Countries or Regions in NTG,(c) TLCPD-Countries or Regions in NTG

Figure 6:Subgroup analysis results.(a)IOP-Countries or Regions in OAG,(b)ICP-Countries or Regions in OAG, (c) TLCPD-Countries or Regions in OAG

Figure 7:Subgroup analysis results.(a)IOP-OAG or POAG in OAG,(b)ICP-OAG or POAG in OAG,(c)TLCPD-OAG or POAG in OAG
FPR is a new dimensionless index proposed by the authors.Since FPR has not been studied previously,there were very few relevant articles that could be included in the meta-analysis.Although in recent years increasing research has been undertaken in regard of this topic, most of the studies concern animal experiments and theoretical numerical simulations.Neither cross-sectional nor case-control experiments can be performed without difficulty.

Figure 8:FPR results.(a)FPR-in NTG, (b)FPR in OAG
The choice of different measurement methods largely depends on the experimental scheme,which will lead to differences in measurement and analysis results.CSFP equivalent formulas are derived from the regression formula for approximate calculation of CSFP withoutin vivotests [27], which is calculated by body mass index, diastolic blood pressure, and age.Because CSFP is applied in ICP measurement as a gold standard [28] and its equivalent formula is also applied in CSFP estimation [14], it is reasonable to regard the result of CSFP equivalent formula as ICP, even if it derives from regression estimation.This measure is suitable for a wide range of cross-sectional studies.After all, it is not feasible to carry out in vivo lumbar puncture in a large number of subjects.The CSFP measured by lumbar puncture or twodepth Transcranial Doppler (TCD) was used in case-control studies, but the measured value of two-depth TCD was lower than that of lumbar puncture [29].
IOP and ICP were mostly measured at the same time, but not in the same posture.There is a large difference among IOP and ICP values that are not measured at the same time or in the same body position [16].A postural change from supine to dependent lateral decubitus position causes significant fluctuations in IOP and ocular perfusion pressure of the affected eye, and may significantly increase IOP and decrease ocular perfusion pressure.Posture-induced IOP changes may be a predisposing factor for development of non-arteritic ischemic optic neuropathy and glaucoma [30].Regarding time, The IOP measurements within a single day were not highly reproducible in the short term [31,32].Multiple measurements and simultaneous measurements with cranial pressure are required.Exercise also causes changes in TLCPD and cribrosa stress [33,34].
The differences between different countries and regions may be due to genetic factors.Genetics have been shown to play an important role in the pathogenesis of POAG, a genetically heterogeneous disorder[35].However, the fact that the ICP of NTG has no heterogeneity suggests not only that ICP is a more fundamental cause but also that human genetic factors are consistent.
Moreover,China has the largest patient population,and its researchers will have more experience than those from other countries with a smaller number of patients.This may lead to differences in treatment methods and subsequent variation between countries and regions.In clinical practice, OAG usually refers to POAG,which may be the main reason why there is no heterogeneity.
In addition to these different factors affecting the measurement results,a more serious concern is that it remains unclear whether the CSFP, measured by lumbar puncture, completely corresponds to the pressure behind the cribrosa and whether the IOP, measured by Goldmann applanation tonometry, completely corresponds to the pressure in front of the cribrosa.Although the measurement results can be corrected[36],there remains a difference between the calculated TLCPD and the true value.
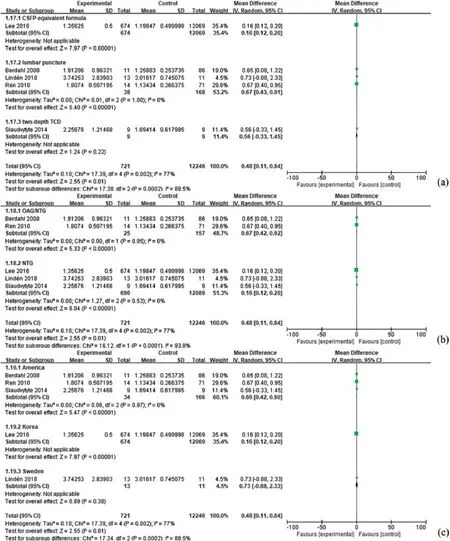
Figure 9:FPR results.(a) FPR-ICP measurement in NTG, (b) FPR-OAG/NTG grouping in NTG, (c)FPR-Countries or Regions in NTG
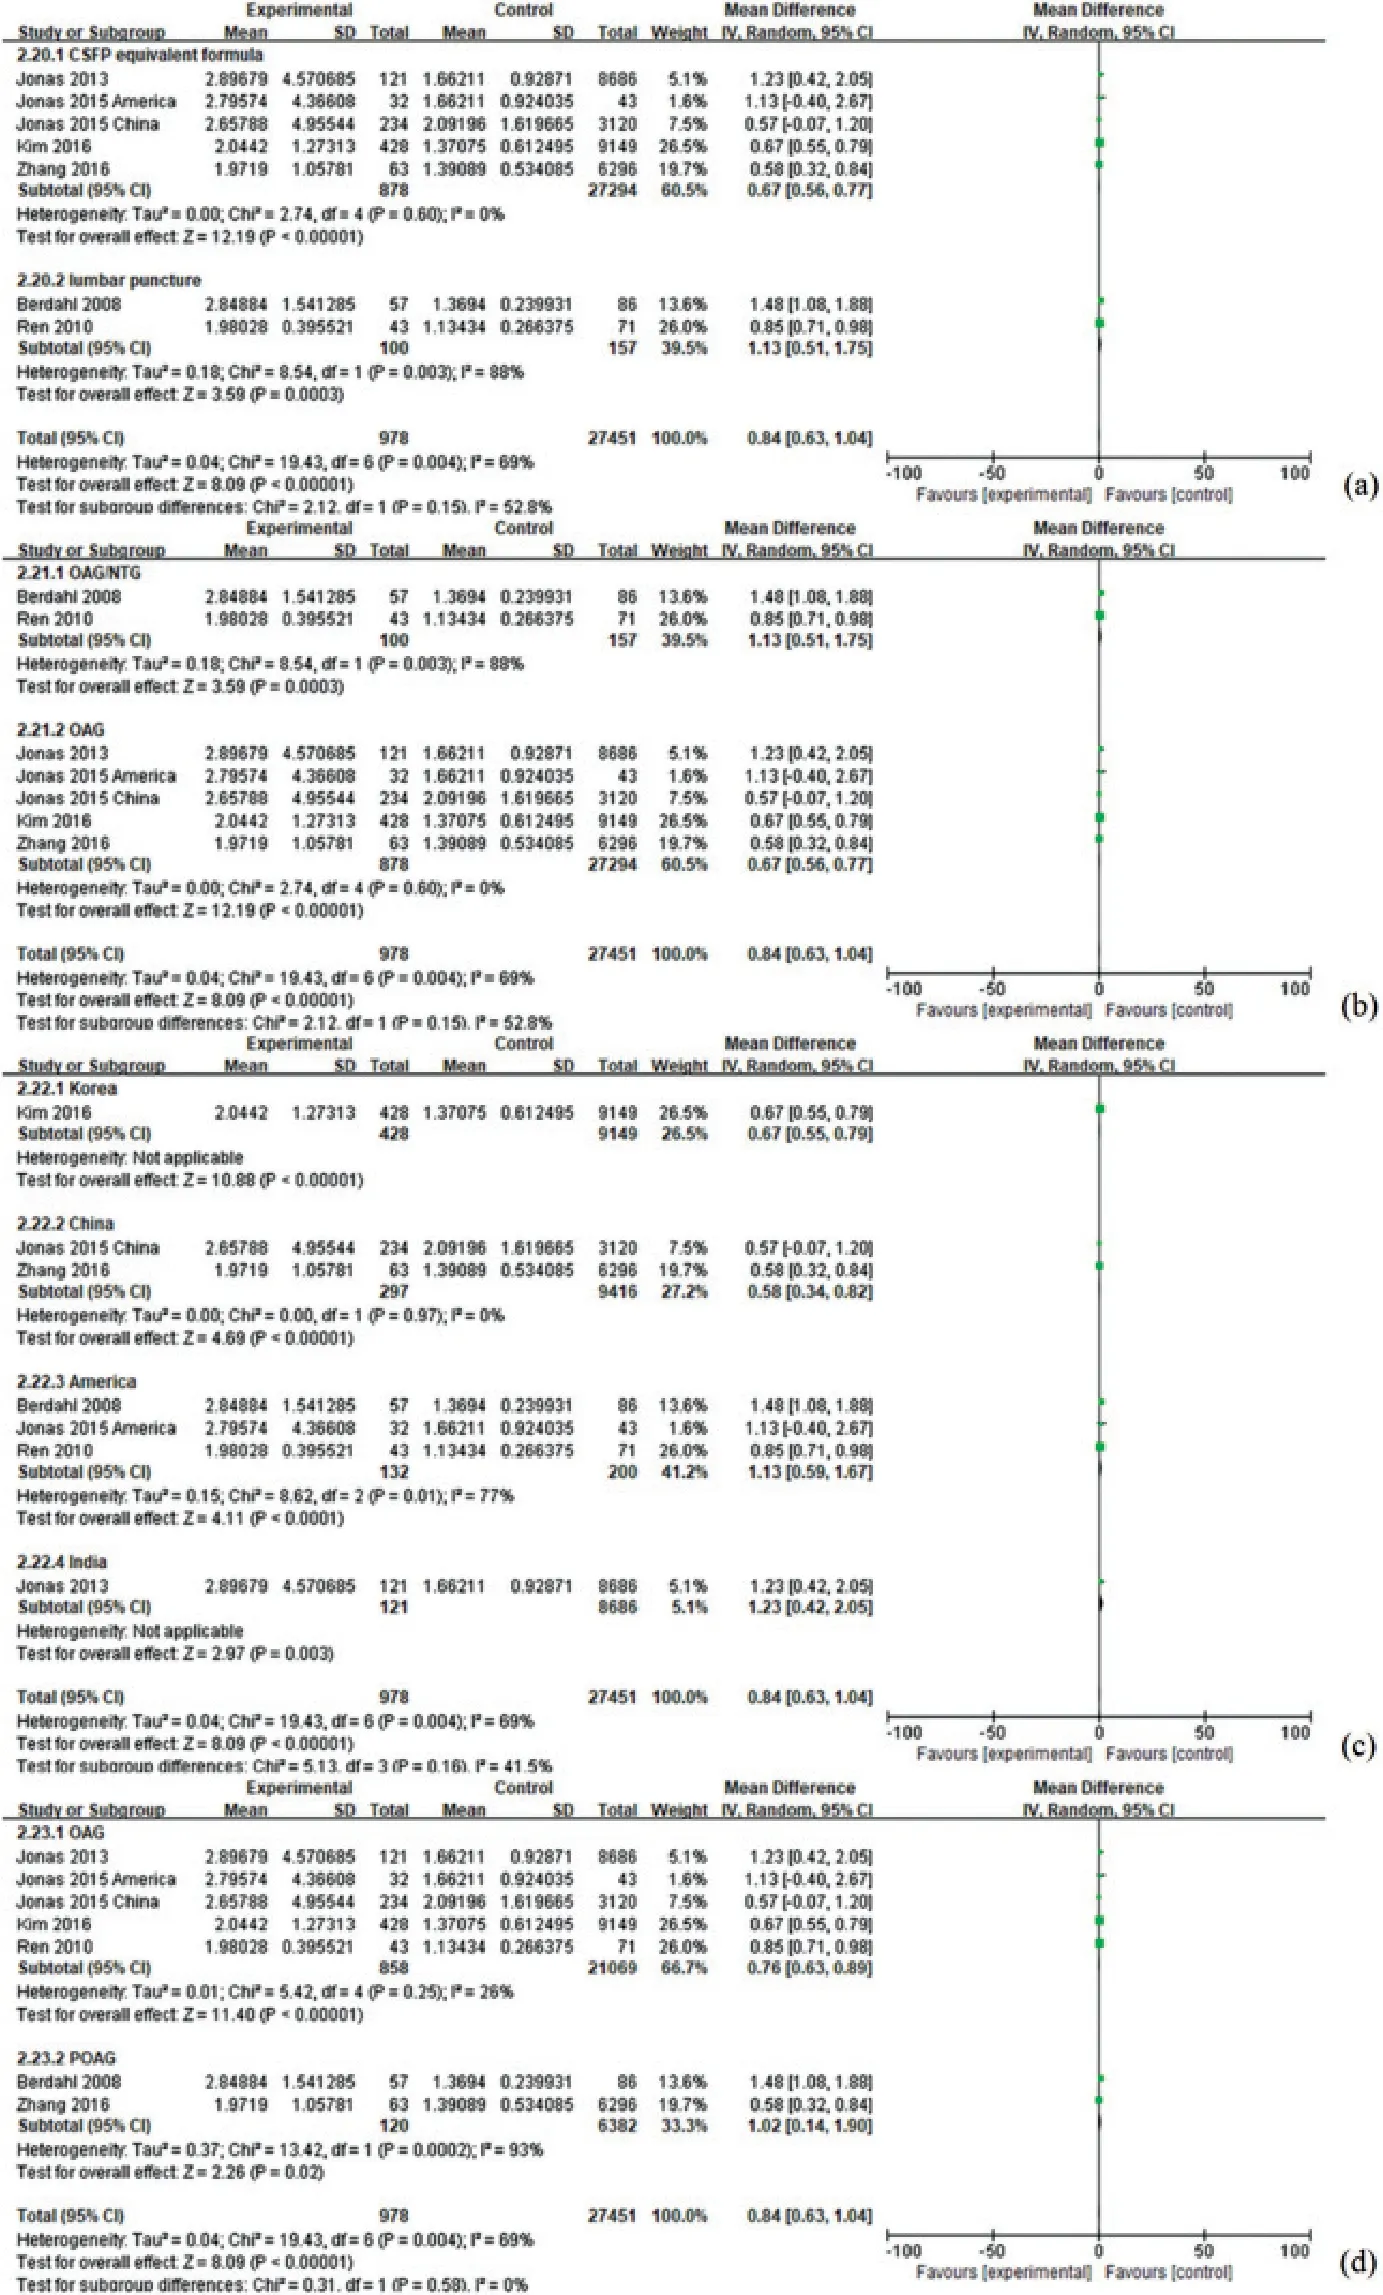
Figure 10:FPR results.(a) FPR-ICP measurement in OAG, (b) FPR-OAG/NTG grouping in OAG, (c)FPR-Countries or Regions in OAG, (d)FPR-OAG or POAG in OAG
In addition, the FPR calculation in this study is only an estimation method, which is limited by the authors’ knowledge and lacks sufficient research data for objective reasoning.The true standard deviation of FPR should be smaller than the equivalent value,which would suggest that the heterogeneity between the conclusions of different studies should actually be smaller.Moreover, it seems to be better only as a mathematical indicator when comparing different studies.The physiological significance of FPR remains unclear.It was tentatively proposed to be a variant form of TLCPD that cancels out individual differences, or a sign of fluid flow in the eyes.Compared with TLCPD, FPR may reflect individual differences in patient quality beyond the biomechanical perspective.
In general,it is necessary to use multiple factors to evaluate glaucoma.Although ocular perfusion pressure alone had no correlation[37],its correlation was verified after it was combined with other indicators to become CSFP [38] and further combined with TLCPD and FPR.A feasible method would be to combine more parameters instead of solely pressure inspired by a combination of parameters.To this end, we need to undertake more research using a unified method to obtain more reliable data.In the context of pressures,for case-control studies standardized measurements and modified methods are required, and TLCPD requires more direct and accurate noninvasive measurements.For cross-sectional studies, data collection and collation,as well as post-processing and interpretation,are important components.
Nevertheless, after obtaining a large amount of detailed data it is necessary to conduct more detailed analysis to identify the in-depth relationship between various indicators and glaucoma.There is huge potential for current artificial intelligence applications and for the development of new clinical applications in the future [39].Besides applying new technologies to retinal imaging, we should conduct data mining by utilizing a large amount of non-imaging data [40].
5 Conclusions
Our meta-analysis shows that patients with NTG and OAG have higher TLCPD and lower ICP than healthy subjects, with obvious heterogeneity.Various factors (including ICP measurement, countries,countries or regions, OAG or POAG) will cause different effects.The difference in ICP measurements is a source of heterogeneity in OAG rather than NTG.The difference in Countries or Regions is a source of heterogeneity in OAG and NTG except for ICP of NTG.Whether OAG is considered POAG is not a source of heterogeneity in OAG.Because of its stability, FPR promises to be a better index than TLCPD in comparisons between different experiments or individuals.
Acknowledgement:This work was supported by the National Natural Science Foundation of China and the Beijing Natural Science Foundation.
Funding Statement:The authors received funding for this study from the National Natural Science Foundation of China(10802053)and the Beijing Natural Science Foundation(7152022).
Conflicts of Interest:The authors declare that they have no conflicts of interest to report regarding the present study.
Appendix A
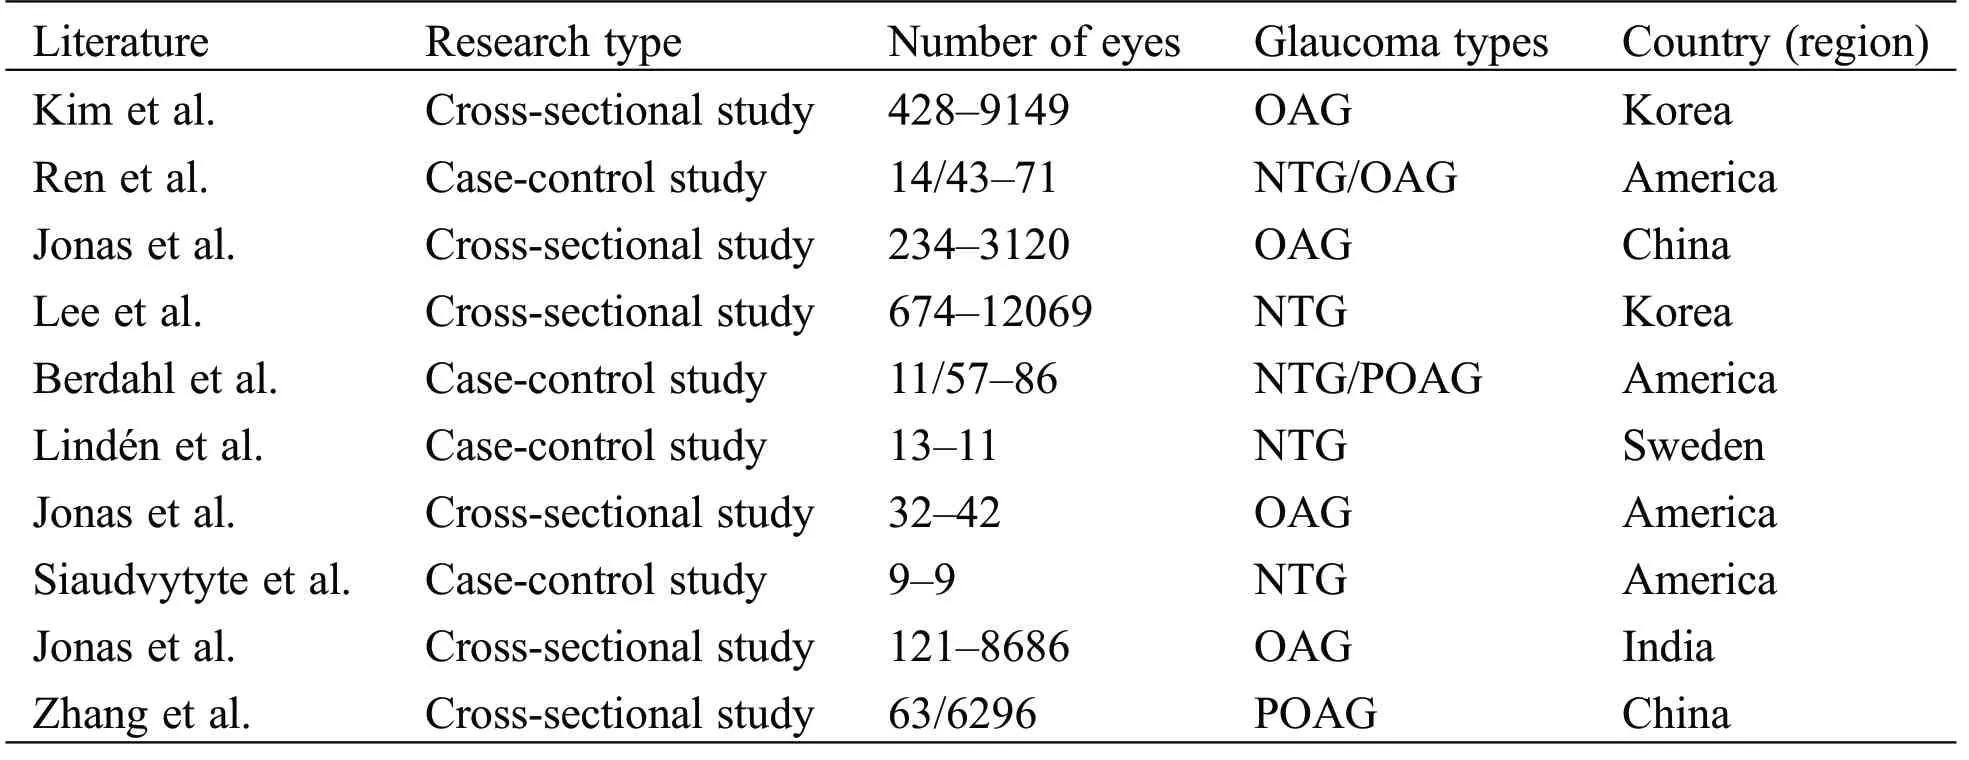
Table A1:Basic features of the included research literature
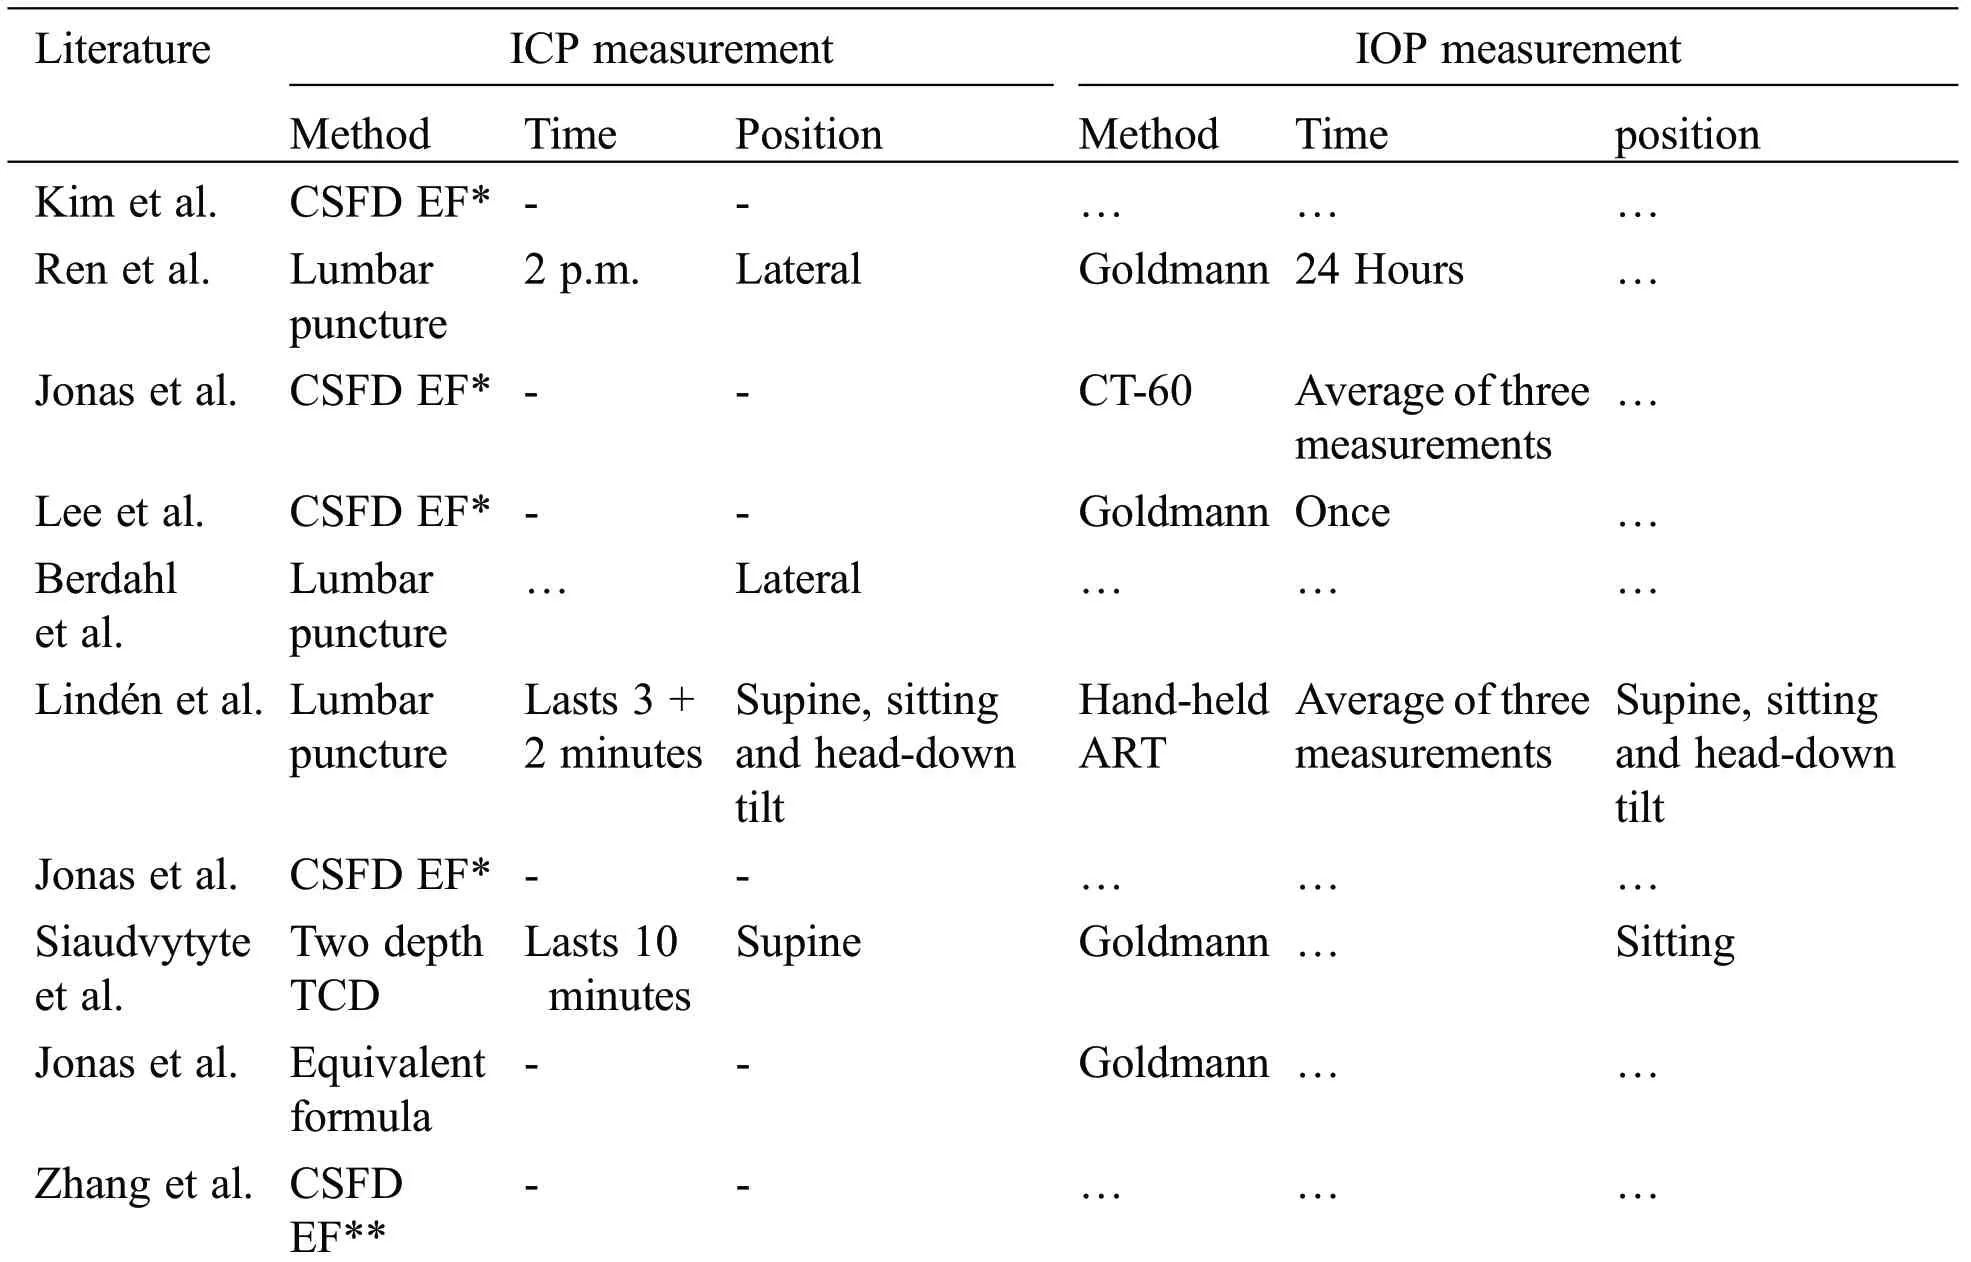
Table A2:Detailed characteristics of the included research literature

Table A3:Other experiment characteristics of the included research literature
