Comparative study of well soaking timing (pre vs.post flowback)for water blockage removal from matrix-fracture interface
2020-04-25NurWijayaJamesSheng
Nur Wijaya,James J.Sheng
Bob L.Herd Department of Petroleum Engineering,Texas Tech University,Texas,USA
ABSTRACT Water blockage after hydraulic fracturing is one of the major challenges in shale oil recovery which affects the optimal production from the reservoir.The water blockage represents a higher water saturation near the matrixfracture interface,which decreases the hydrocarbon relative permeability.The removal of water blockage in the field is typically carried out by soaking the well (i.e.,shut-in)after hydraulic fracturing operation is finished.This soaking period allows water redistribution,which decreases the water saturation near the matrix-fracture interface.However,previous field reports show that there is not a strong consensus on whether shut-in is beneficial in terms of production rate or ultimate oil recovery.Due to the large number of parameters involved in hydraulic fracturing and tight formations,it is challenging to select which parameter plays the dominant role in determining the shut-in performance.Furthermore,literature on field case studies does not frequently report the parameters which are of researchers’ interest.In other words,the challenge of evaluating shut-in performance not only lies on the complexity of parameters and effects involved within the reservoir,but also the limited number of field case studies which report a comprehensive list of fracturing and reservoir parameters.
Keywords:Water blockage Formation damage Flowback Shut-in Desiccation
1.Introduction
To produce hydrocarbon from shale reservoirs,hydraulic fracturing has nowadays become an inevitable stimulation technique.A large volume of water is injected under high pressure to create fracture network in the formations [1,2].However,regardless of the large range in the injection volume,it is consistently observed that most of the injected water is not recovered during flowback period [3,4].Table 1 presents a brief summary of the typical volume of injected water and the flowback recovery in each corresponding shale play.Flowback recovery is defined as the ratio of the volume of the recovered water to the volume of the injected water.
Many researchers argued that the unrecovered water imbibes into the matrix through forced imbibition during fracturing and creates a formation damage called “water blockage,” represented by a higher water saturation near the matrix-fracture interface [6].As a result,thehydrocarbon relative permeability around the matrix-fracture interface decreases and affects the optimal production from the reservoir.

Table 1 Summary of flowback recovery in some of the major shale plays [5].
This water blockage is formed near the matrix-fracture interface due to the capillary discontinuity between the matrix and the fracture [7,8].Tight formations often demonstrate a capillary pressure of up to thousands of psi,whereas fractures show less than ten or often zero psi.Therefore,to remove this type of water blockage from the matrixfracture interface,the drawdown should be higher than the matrix threshold capillary pressure or even higher than the maximum capillary pressure at the irreducible water saturation for a full water blockage cleanup.However,the available drawdown in the field may not be adequate to remove such blockage [9].As a result,shut-in is often performed after hydraulic fracturing,because it redistributes the high water saturation near the matrix-fracture interface deeper into the matrix through capillary imbibition.As the water saturation near the matrix-fracture interface is lower,the required drawdown to initiate and sustain the flowback is reduced.This reduction in the required drawdown is arguably the main benefit of shut-in.
Nevertheless,another problem arises from the water redistribution itself.Typically,the relative permeability curves in tight formations are highly depressed that a slight increase in water saturation causes a large reduction in the hydrocarbon relative permeability.This implies that while the water redistribution solves the water blockage issue at the matrix-fracture interface,it causes a reduction in the hydrocarbon relative permeability in the deeper matrix.Regardless of the possible reduction in the hydrocarbon relative permeability,shut-in is still often performed by operators,either due to logistical constraints or the perceived benefit that shut-in could contribute to an incremental hydrocarbon recovery factor.
For shut-in performance evaluation,some field data are revisited.Some reports claim that shut-in is beneficial because it results in a higher initial hydrocarbon production rate upon bringing the well back online [10-12].It also lowers the drawdown required to perform flowback and lowers the water handling cost [10,11,13,14].However,other reports suggest that shut-in is detrimental because it allows the unrecovered water to imbibe deeper into the matrix causing the reduction in the hydrocarbon relative permeability [10,15-17].Wijaya and Sheng [18]studied the effect of shut-in on net present value (NPV)of Middle Bakken shale oil reservoir,and they found that longer shut-in duration results in a lower NPV because the higher initial hydrocarbon production rate after shut-in cannot be sustained long enough to compensate for the production loss during shut-in.Overall,it seems that shut-in benefits mostly take place during the early-time production (i.e.,higher initial hydrocarbon production rate and lower required drawdown to perform flowback),while they may not affect or even potentially harm the long-term production (i.e.,reduced hydrocarbon relative permeability,lower matrix absolute permeability due to clay swelling,and production loss during the extended shut-in).
A comparative analysis among this field data to determine which factors more dominantly affect shut-in performance is difficult due to the complexity of the parameters and effects involved within the reservoir and the limited amount of information reported [19].For example,the field reports seldom mention the desiccation state of the formation which is shown to affect shut-in performance [17].Desiccation refers to a state whether the initial water saturation of the formation is lower than the irreducible water saturation (i.e.,desiccated)or higher than or equal to the irreducible water saturation (i.e.,non-desiccated).
In addition,they seldom mention whether the corresponding shut-in is performed immediately after hydraulic fracturing (pre-flowback)or after a short period of flowback (post-flowback).The investigation on shut-in timing is motivated by the fact that in the field,shut-in can take place either immediately after hydraulic fracturing but before the first flowback (i.e.,pre-flowback)or sometime after the first flowback (i.e.,post-flowback)[10,11,15,20].Therefore,this paper aims to enrich the literature by investigating the effect of shut-in timing (i.e.,pre-vs.postflowback)on shut-in performance in removing the water blockage.This is motivated by the fact that some operators perform the extended shutin before the initial flowback,while others after the initial flowback.
2.Methodology
To investigate the effect of shut-in timing on the efficacy of shut-in in removing the water blockage,a numerical modeling approach is used.Transport equations for an incompressible and immiscible twophase flow of oil (o)and water (w)in a 1-D (one-dimensional)porous media are given by Refs.[21,22]:


whereKis the absolute permeability,Piis the phase pressure,kriis the phase relative permeability,andμiis the phase viscosity.The phase pressures are dependent due to the capillary pressure function given by:wherePcis the capillary pressure (in the water-wet system),Pois the oil phase pressure,andPwis the water phase pressure.To derive the fractional flow formulation,the total Darcy velocity is introduced and given by:


By adding the two continuity equations of both phases in Equation(1)and using the fact thatSo+Sw=1,the transport equation in our study is given by:

The 1-D core-scale numerical model consists of 1 fracture grid block and 500 matrix grid blocks,illustrated in Fig.1.The transport equation is assigned with no-flow boundary condition both at the non-neighboring face of the fracture grid block and the non-neighboring face of the farthest end of the matrix block.In other words,the boundary conditions can mathematically be expressed as:


Fig.1.A schematic of the geometrical model.
wherex=0 represents the non-neighboring face of the fracture grid block,andx= Lrepresents the non-neighboring face of the farthest end of the matrix block.The total length of the matrix blocks is the same as the length of the core sample used in the experiment (i.e.,L= 25.4 cm)[14].The cross-sectional area (in the direction normal to the axis of flow)of the model is also the same as that of the core sample (i.e.,45.6 cm2)[14].
In this study,to investigate the effect of shut-in timing on shut-in performance,this mathematical model is used to history match a coreflood experiment which simulates an invasion and flowback process[14].To simulate the water leakoff/invasion into the matrix,water is injected into the fracture grid block at a constant rate.Meanwhile,to simulate the flowback,oil is injected into the farthest matrix grid block at a constant rate.The core-flood experiment was conducted inside a Computerized Tomography (CT)scanner to record the real-time water saturation profile evolution during the invasion,shut-in,and flowback.Table 2 lists the rock and fluid properties used in the experiments and thus modeling.
The numerical model is validated through a successful history match with the experimental results in terms of the water saturation profile at different time slices during immediate flowback (Fig.2a)and pressure drop during flowback (Fig.2b)[17].Fig.2a-b demonstrate that although our model is numerical,it successfully captures the physics or mechanisms of water blockage removal because it matches the water saturation profile at several time slices and different coreflood schemes,instead of a typical rate or pressure plot which cannot visualize the water saturation distribution along the core.This validation attempt is paramount in this study because most papers perform a numerical study on similar topics based on a synthetic model (i.e.,without history matching),which may result in misleading observations.Readers,if interested,are encouraged to refer to the previous work for the extensive model development and history matching attempt [17].

Fig.2a.Water saturation profile match at two different time slices during immediate flowback: experiment vs.modeling [17].

Fig.2b.Pressure drop during flowback of core-flood 1 and 2 listed in Table 2:experiment vs.modeling [17].
For convenience,this section revisits the water blockage removal mechanisms previously proposed in the literature [14,17].As illustrated in Fig.2b,two drawdown plateaus are observed during flowback: early- and late-time drawdown plateau.The early-time drawdown plateau represents the period in which the water saturation near the matrix-fracture interface is high,which causes the drawdown to remain high.In other words,the early-time drawdown plateau represents the period in which the trapped water at the matrix-fracture interface is still present,indicated by the concave-up water saturation profile near the interface,such as for the 3-hr time slice in Fig.2a.As soon as this high water saturation near the matrix-fracture interface is removed,the latetime drawdown plateau will gradually form.This late-time drawdown plateau represents the period in which the water saturation near the matrix-fracture interface is much lower that the trapped water at the matrix-fracture interface is removed,indicated by the absence of the concave-up water saturation profile near the interface,such as for the 15-hr time slice in Fig.2a.
Given the constant water and oil injection rate,steady-state flow is achieved (shown by the constant pressure drop in each plateau in Fig.2b.Therefore,the evolution/increase in hydrocarbon relative permeability (kro)during the flowback period can be calculated using Darcy law.This parameter is called “regained hydrocarbon relative permeability” or regained kro.This parameter quantifies how well the different shut-in timings remove the water blockage.Lastly,since further flowback does not significantly decrease the value of the late-time drawdown plateau,the late-time drawdown plateau corresponds to the“maximum” regained hydrocarbon relative permeability.

Table 2 Core-flood schemes by Liang et al.[14].

Fig.3.Effect of desiccation and shut-in (pre-flowback)on the restoration of kro[17].
Previous study has shown that desiccation affects shut-in performance [17].Fig.3 shows that in desiccated cores,shut-in does not affect the late-time regained kro.However,in non-desiccated cores,longer shut-in results in a lower regained kro.It is suggested that in nondesiccated cores,the injected water will likely remain mobile at all times instead of restoring the irreducible water saturation value as in the case of desiccated cores.In other words,shut-in seems to be detrimental in non-desiccated cores.
3.Importance of shut-in timing
Since shut-in seems to be detrimental in non-desiccated cores,this study aims to investigate if shut-in timing can help alleviate or even nullify the detrimental effect of shut-in in non-desiccated cores.The investigation on the non-desiccated cores is relevant because some shale plays,such as Middle Bakken,are shown to be non-desiccated[18].Meanwhile,the investigation on shut-in timing is motivated by the fact that in the field,shut-in can take place either immediately after hydraulic fracturing but before the first flowback (i.e.,pre-flowback)or sometime after the first flowback (i.e.,post-flowback).The timing of shut-in is believed to influence the production performance,because it dictates how much water is allowed to imbibe from the fractures to the matrix before the extended production.
After the model is validated,the effect of shut-in timing (i.e.,pre-vs.post-flowback)is investigated in this section.Because shut-in can only be detrimental in non-desiccated cores,this paper will investigate the effect of shut-in timing in non-desiccated cases only.Fig.4a illustrates that shut-in pre-flowback refers to the case in which shut-in takes place before any flowback occurs (i.e.,immediately after water injection stops).Meanwhile,Fig.4b describes that shut-in post-flowback corresponds to the case in which shut-in takes place after a certain period of flowback subsequent to the water injection.In this study,the duration of the initial flowback in the case of shut-in post-flowback is set at 10 h.The shut-in post-flowback duration serves as the sensitivity parameter.To accommodate the long shut-in duration and thus the greater imbibition depth,the core-scale model is extended from 25.4 (as used in the core-flood experiment)to 200 cm to prevent the imbibing front from breaking through the other end of the core.The initial water saturation is set at the irreducible water saturation,hence non-desiccated.

Fig.4.Schematics for shut-in pre-flowback (A)and post-flowback (B).

Fig.5.Effect of shut-in post-flowback duration on the restoration of kro in nondesiccated cores.
4.Results and discussions
The sensitivity results on the effect of shut-in post-flowback duration on the restoration of kroin non-desiccated cores are presented in Fig.5.Fig.5 shows that in non-desiccated cores,shut-in post-flowback does not affect the late-time regained kro,whereas Fig.3 shows that shut-in pre-flowback causes the reduction in the late-time regained kro.
From the operational perspective,Fig.5 suggests that flowback should be carried out immediately after hydraulic fracturing operation is finished,especially in non-desiccated formations.If the reservoir is shown to be desiccated,immediate flowback is not a priority because shut-in will not decrease the late-time regained kro(Fig.3).Meanwhile,if the reservoir is shown to be non-desiccated,immediate flowback should be carried out for a certain period of time until the large required drawdown to sustain the flowback is no longer available,after which shut-in can take place (i.e.,shut-in post-flowback).In other words,if the reservoir is shown to be non-desiccated,flowback tank and other equipment should ideally be made available and ready on location while hydraulic fracturing operation is approaching the completion of the job.The authors realize that the idea of immediate flowback may not be logistically feasible,since operators prefer finishing the hydraulic fracturing operation on several wells first,before bringing the flowback tank and equipment to the location.Therefore,this result serves as the ideal scenario for operators interested in carefully minimizing the water blockage formation damage in their hydraulicallyfractured wells.
5.Mechanistic analysis
Since shut-in timing is shown to reverse the detrimental effect of shut-in in non-desiccated cores,this section aims to explain the mechanisms behind the reversing effect.For the purpose of comparative study,this section will only compare three cases in non-desiccated cores: 1)immediate flowback with no shut-in at all; 2)24-hr shut-in pre-flowback; and 3)24-hr shut-in post-flowback.The 24-hr shut-in cases are chosen because they should correspond to the worst water blockage situation,due to the longest shut-in duration modeled.
Fig.6 shows the effect of shut-in and its timing on the drawdown required to perform flowback in non-desiccated cores.Using Darcy law,this drawdown plot is converted to a kro“restoration” plot,presented in Fig.7.Fig.7 confirms that regardless of its timing,shut-in does not create a higher late-time regained krothan immediate flowback (with no shut-in at all).In fact,immediate flowback seems to restore kroas quickly as shut-in.However,since immediate flowback occurs during the earliest production in the field in which krois still very low,the required drawdown will be very high.In other words,Figs.6-7 demonstrate that shut-in benefits mostly take place during the early-time flowback by lowering the required drawdown to initiate the flowback.

Fig.6.Effect of shut-in and its timing on drawdown during flowback in nondesiccated cores.

Fig.7.Effect of shut-in and its timing on the restoration of kro in non-desiccated cores.
Fig.7 also emphasizes that not only that shut-in does not create a higher late-time regained krothan immediate flowback,it may even decrease the late-time kro.Fig.7 demonstrates that while shut-in postflowback results in virtually the same quality of water blockage removal as immediate flowback (shown by the similar late-time regained krovalue),shut-in pre-flowback worsens the water blockage issue(shown by a much lower late-time regained krovalue than immediate flowback).As a result,it seems that the decision on whether to shut-in the well after fracturing depends on the availability of the drawdown in the field: if the large drawdown required to perform immediate flowback is available,immediate flowback should be priority to ensure a higher late-time kro,even if an extended shut-in is to be performed later.
To explain the contradictory shut-in performance between shut-in pre- and post-flowback,we compare the water saturation profile between the two shut-in timings (i.e.,pre-vs.post-flowback)at different time slices (Figs.8-10).Fig.8 illustrates the evolution of water saturation profile for shut-in pre-flowback; Fig.9 for shut-in post-flowback; Fig.10 for the combination of both cases.First,in Fig.8,since the case of shut-in pre-flowback does not have any immediate flowback before the shut-in period,the water saturation profile at the start of the 24-hr shut-in is the same as the water saturation profile by the end of the water injection.
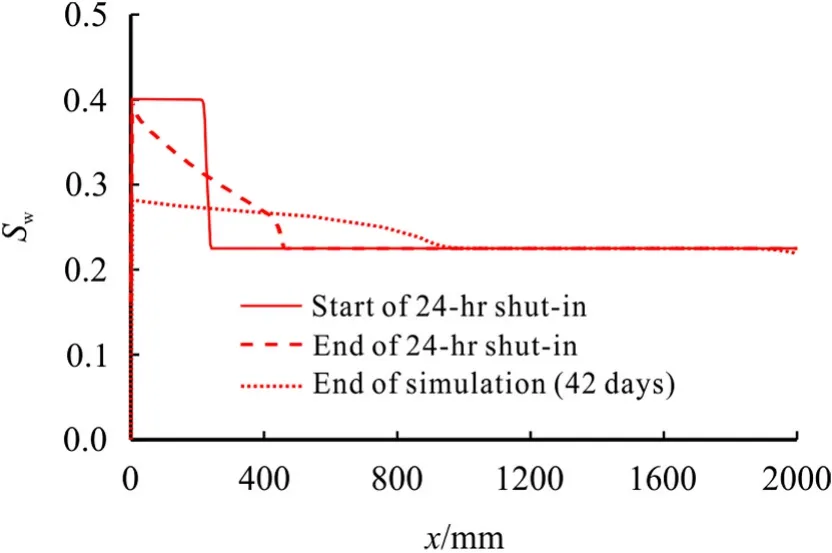
Fig.8.Evolution of water saturation profile for shut-in pre-flowback in nondesiccated cores.

Fig.9.Evolution of water saturation profile for shut-in post-flowback in nondesiccated cores.

Fig.10.Water saturation profile comparison between shut-in pre- and postflowback in non-desiccated cores.
In Figs.8-10,the water redistribution is visually illustrated by the decreasing water saturation within the invaded region and the increasing water saturation within the originally-uninvaded region.More importantly,Fig.10 shows that the maximum water invasion depth by the end of the 24-hr shut-in for both cases is almost the same at around 500 mm from the fracture face.Given that the case of shut-in postflowback already experiences another previous 10 h of flowback and water redistribution which occur simultaneously (i.e.,the predetermined duration of the initial flowback)before the following 24-h shut-in,the fact that the maximum water invasion depth by the end of shut-in is similar for both shut-in pre- and post-flowback cases is interesting.This suggests that the capillary imbibition during shut-in in the case of shut-in post-flowback is slower than that of shut-in preflowback.This could occur in the case of shut-in post-flowback because the water that resides in the fractures has been previously cleaned up.Therefore,there is a smaller amount of available water in the fracture which will serve as the source of the proceeding water capillary imbibition.As the water imbibition volume in the shut-in post-flowback case is lower than that in the shut-in pre-flowback case,the water redistribution in the shut-in post-flowback case will reach to an equilibrium more quickly than that in the shut-in pre-flowback case.In this section,the equilibrium represents the condition in which the water redistribution is virtually complete that the water saturation profile at further time slices does not show a significant increment of water redistribution.

Fig.11.Matrix relative permeability curves.
In other words,the imbibition rate in the shut-in post-flowback case is lower than that in the shut-in pre-flowback case.This could occur because in the shut-in post-flowback case,the solid line in Fig.9 shows that there is a shorter length/interval of high water saturation near the matrix-fracture interface before the following shut-in takes place,in comparison to the solid line in Fig.8 which shows a longer interval of such high water saturation near the matrix-fracture interface before the following shut-in takes place.Such high water saturation is critical in generating a high imbibition rate due to its high saturation gradient between the invaded and the uninvaded region.Meanwhile,the long interval of regions of such high water saturation helps ensure that the high imbibition rate can be sustained for a longer period of water redistribution.For shut-in post-flowback case,the high water saturation still exists at the start of shut-in,but at a very short length/interval in the closest vicinity of the matrix-fracture interface.As the proceeding imbibition continues to pull this water saturation near the fracture down,the water saturation value near fracture will quickly decrease and reach the equilibrium water redistribution.
Nevertheless,although the imbibition rate in the shut-in postflowback case diminishes much earlier than that in the shut-in preflowback case,Fig.10 demonstrates that the water saturation profile by the end of simulation (i.e.,42 days after water injection starts)between shut-in pre- and post-flowback case is arguably similar.However,Fig.10 still shows that the water saturation profile in shut-in preflowback case at the end of simulation is still technically higher than that in shut-in post-flowback case.Since Fig.7 shows that the regained kroin shut-in post-flowback is clearly higher than that in shut-in preflowback,this tiny difference in water saturation profile at the end of simulation (Fig.10)is substantial in quantifying the regained kro.In other words,this tiny difference in water saturation profile corresponds to a large difference in regained krobecause of the krwdepression.
Fig.11 shows the matrix relative permeability curves obtained from history matching of the core-flood experiments.Fig.11 shows the high depression level of krw,which is typical of tight formations.This implies that a slight water saturation increase results in a large oil relative permeability reduction.As a result,the fact that shut-in pre-flowback results in both higher water saturation profile at all locations along the core and deeper invasion depth than shut-in post-flowback at any time slice (Fig.10)indicates that immediate flowback is critical to ensure better water blockage removal.In other words,the attempt to minimize the amount of mobile water within the matrix should be priority in nondesiccated cores,which can be carried out by flowing back the injected water immediately following hydraulic fracturing,even if an extended shut-in is to be performed later.
6.Conclusions
Our results show that regardless of its timing,shut-in cannot generate any incremental regained oil relative permeability.However,shut-in timing can help alleviate the detrimental effect of shut-in,especially in non-desiccated cores.For example,in non-desiccated cores,shut-in performed after an initial flowback (i.e.,post-flowback)can help generate a higher late-time regained hydrocarbon relative permeability than shut-in performed before an initial flowback (i.e.,pre-flowback).
A mechanistic analysis on the water saturation profile suggests that this phenomenon is attributed to the high depression level of the water phase relative permeability curve.The high depression level implies that a slight water saturation increase causes a large hydrocarbon relative permeability reduction.Therefore,minimizing the invasion volume is a key strategy in mitigating water blockage in non-desiccated formations.As a result,this study proposes that flowback should be carried out immediately following hydraulic fracturing,especially in non-desiccated formations,even if an extended shut-in is to be performed later.
Acknowledgements
The authors would like to acknowledge Schlumberger for the ECLIPSE Reservoir Simulator license.The authors would also like to acknowledge Southwestern Petroleum Short Course for the permission to publish this paper.
Appendix A.Supplementary data
Supplementary data to this article can be found online at https://doi.org/10.1016/j.petlm.2019.11.001.
杂志排行

Petroleum的其它文章
- Contribution to the ageing control of onshore oil and gas fields
- Reservoir rock properties estimation based on conventional and NMR log data using ANN-Cuckoo: A case study in one of super fields in Iran southwest
- Effects of synthesized nanoparticles and Henna-Tragacanth solutions on oil/water interfacial tension: Nanofluids stability considerations
- Reversible and irreversible adsorption of bare and hybrid silica nanoparticles onto carbonate surface at reservoir condition
- β-cyclodextrin assists salt-resistance polymer flooding: Injectivity improvement
- Polymeric microsphere injection in large pore-size porous media