Species Diversity and Elevational Distribution of Amphibians in the Xianxialing and Wuyishan Mountain Ranges,Southeastern China
2020-04-21ZhiqiangCHENYunTANGYingyingWANGYindieLILonghuiLINGuohuaDING
Zhiqiang CHEN,Yun TANG,Yingying WANG,Yindie LI,Longhui LIN,Guohua DING*
1 Laboratory of Amphibian Diversity Investigation,College of Ecology,Lishui University,Lishui 323000,Zhejiang,China
2 Hangzhou Key Lab for Animal Adaptation and Evolution,College of Life and Environmental Sciences,Hangzhou Normal University,Hangzhou 310036,Zhejiang,China
Abstract The species diversity and altitudinal distribution of amphibians along an elevational gradient of 200-1 600 m in the Xianxialing and Wuyishan Mountain Ranges in Southeastern China were investigated through time-constrained visual surveys along 32 transect lines in 9 survey areas,in which the habitat types were also recorded.A total of 27 amphibian species belonging to 19 genera,7 families,and 2 orders were found.The species diversity of the amphibians plateaued at low elevation,and the altitudinal boundary of their distribution was at 800 m.Their species compositions were dissimilar in the two mountain ranges probably because the annual average temperature and annual rainfall were different in both areas.The elevational Rapoport’s rule demonstrated that the species range size of the amphibians expanded as the elevation increased in both mountain ranges.The results of the cross-species method supported the rule only when the influence of the low-frequency occurrence probability of an investigated species was excluded,whereas those of the Steven’s method strongly corroborated the rule regardless of the incidental occurrence or absence of the species.
Keywords amphibian diversity,altitudinal distribution,Rapoport’s rule,cross-species method,Steven’s method
1.Introduction
The emergence of amphibians is the key to the evolution of vertebrates from aquatic to terrestrial environments (Feiet al.,2010;Jianget al.,2016).Amphibians are crucial in maintaining ecological balance and in recycling biological energy (Heatwole and Wilkinson,2012;Jianget al.,2016).They have also become valuable in the fields of medicine and economic development(Feiet al.,2010).
China harbors high diversity and endemicity of amphibians.As field studies have been expanded,new species are being reported.In fact,490 species of amphibians have already been recognized in China as of 2019,and 328 (66.9%) of them are endemic to the country (AmphibiaChina,2019).
The longitudinal gradient in the species diversity of amphibians is not evident in China,but in terms of the latitudinal gradient,their species diversity gradually decreases as the latitude increases.Hence,species diversity is predominantly higher in the south but lower in the north,particularly in the arid northwest region and in the northern region of the Qinghai-Tibet Plateau,where the climate is distinct (Shenet al.,2016).Climate immensely affects the species diversity of amphibians (Rootet al.,2003;Thomaset al.,2004),whereas temperature,moisture,and seasonal characteristics are the pivotal factors that influence their distribution in China (Shenet al.,2016).
Elevational gradients integrate various climatic factors such as temperature and precipitation into the distribution of amphibians,so it is essential to study these factors as well in understanding patterns of species diversity (Tanget al.,2004).Amphibian species richness tends to change as the altitude rises(Stevens,1992).Rahbek (1995) demonstrated that the altitudinal gradient of species richness could be divided into five patterns:monotonically decreasing,hump distribution,first platform then declining,monotonically increasing,and random change,but currently,only four patterns are considered,and they include monotonically decreasing,hump distribution,first platform then declining,and unimodal distribution (McCainet al.,2010).
Research on the altitudinal distribution of amphibians in China began in 1991.Gu (1991) studied the elevational distribution of amphibian species in the Wuyanling National Nature Reserve in the Zhejiang Province.Thereafter,local researchers also successively studied the altitudinal distribution of amphibians in many other nature reserves (Changet al.,1997;Luoet al.,2010;Liet al.,2003;Chenet al.,2007;Xuet al.,2007;Moet al.,2009;Tenget al.,2010;Panet al.,2013;Zhenget al.,2014;Wanget al.,2015),and they found that amphibian species in different areas had varying elevational distribution patterns.For example,Mount Heng in the Southern Yue was severely perturbed by human activities that the distribution pattern of amphibians in the mountain became wave-like (Moet al.,2009),whereas that in the Baishuijiang Natural Reserve was monotonically decreasing (Tenget al.,2010).When a distribution pattern is unimodal,it reaches its peak at mid-altitude,except in the case of widespread species (Zhenget al.,2014).The distribution pattern of amphibian species in the Wuyishan Mountain was first platform then declining,and it plateaued at 300-1200 m (Wanget al.,2015).
The elevational differences of the Xianxialing and Wuyishan Mountain Ranges contribute to the complexity of their habitat types,enrich the biodiversity of the region,and provide favorable habitats and breeding grounds for amphibians.Despite the enormous impacts of human activities on the natural environments of the Xianxialing and Wuyishan Mountain Ranges,studies on their amphibian diversity have been limited to only a few areas in both ranges (Liu,1989;Caiet al.,1995;Taoet al.,2008;Tuet al.,2009;Wanget al.,2015).It is vital to expand and intensify such research because anthropogenic development may affect the species composition,population density,and behavior of amphibians,making it difficult for these organisms to adapt to the changes in their original habitats especially in the Wuyishan Mountain Range(Ficetola and Bernardi,2004;Rodríguez-Prieto and Fernández-Juricic,2005;Garneret al.,2008).The hypersensitivity of amphibians to environmental change and the gravity of crisis on resources have widely attracted biologists.The diversity and distribution of amphibians must be further studied for the benefit of the sustainable use and protection of the amphibian and wildlife resources particularly in the Fugaishan Mountain,which stretches from northwest to southwest at the junction and the border of the Xianxialing and Wuyishan Mountain Ranges (Situ,2014).
In this study,we conducted a large-scale survey on the diversity of amphibians in the Xianxialing and Wuyishan Mountain Ranges,compared their species composition in the two mountain ranges,and examined their elevational distribution patterns in these regions.The elevational distribution of amphibian species in the Wuyishan Mountain Range was found to have a first platform then declining pattern that could be attributed to the impacts of habitat complexity (Wanget al.,2015).Moreover,the two mountain ranges have altitudinal variations in their natural environments and differences in their habitat types.Considering these findings and conditions,we hypothesized that both mountain ranges have varying patterns in their amphibian species diversity and altitudinal distribution.
2.Materials and Methods
2.1.Study areaThe Xianxialing Mountain Range is located southwest of the Zhejiang Province in Southeastern China.It stretches over 100 km from east to west,with the junction of three provinces (Zhejiang,Jiangxi and Fujian) in the west and three cities (Quzhou,Jinhua and Lishui) in the east.With about 80% of its total area covered with evergreen broad-leaved forest,the Xianxialing Mountain Range is the watershed of the Qiantangjiang and Oujiang Rivers (Ye,2013).The mountain range consists of a cluster of mountains,mainly the Niutoushan Mountain (NT),Jiulongshan Mountain (JL),Baimashan Mountain (BM),Ziweishan Mountain (ZW),and Jianglangshan Mountain (JLS) (Figure 1).Lowland landscapes are widespread at elevations 300-500 m;deciduous evergreen and broad-leaved mixed forests cover the areas at 1200-1600 m,and landscapes with alpine dwarf trees and meadows dominate above 1700 m (Ye,2013).
The Wuyishan Mountain Range is located in the border of the Jiangxi and Fujian Provinces in Southeastern China.It stretches over 550 km from northeast to southwest.It is bordered on the north by the Xianxialing Mountain Range,and on the south by the Jiulianshan Mountain.With the>80% forest coverage in most of its mountains,the Wuyishan Mountain Range is the watershed of the Ganjiang,Fuhe,Xinjiang,and Minjiang Rivers (Situ,2014).The mountain range consists of a cluster of mountains including the Tongboshan Mountain (TB),Wuyishan Mountain (WY),Yangjifeng Mountain (YJF) and Matoushan Mountain (MT) (Figure 1).The terrain of the Wuyishan Mountain Range predominantly consists of mountains and valleys that are covered with mid-subtropical evergreen forests with notable altitudinal distribution of vegetation (Situ,2014).Evergreen broad-leaved forests dominate below 1,000 m;mixed coniferous broad-leaved forests cover the areas at 1000-1900 m,and alpine meadows are common above 1900 m (Situ,2014).
2.2.Amphibian samplingWe conducted a search technique that involved time-constrained visual encounters to study the species diversity and altitudinal distribution of amphibians in the Xianxialing and Wuyishan Mountain Ranges from July to early August in 2016.We established 32 transect lines at an altitudinal range of 200-1600 m.Sixteen of the transect lines were set at 5 survey localities:BM,JL,JLS,NT,and ZW in the Xianxialing Mountain Range,and the other 16 were installed at 4 survey localities:MT,TB,WY,and YJF in the Wuyishan Mountain Range (Figure 1).The total length of the 32 transect lines was 202 km,and the width of each transect line was 4 m.We conducted our surveys within 19:00-24:00 in habitats such as streams,paddy fields,ponds,and roadside brush.We used LED flashlights (Fenix E35,made in China) to find amphibians and recoded the number of individuals per species that we have seen along each transect line.We also noted the habitat type in which each individual was found and documented the pertinent geographic details including geographic coordinates and altitude.
2.3.Data analysisWe recorded five habitat types:lotic,lentic,arboreal,terrestrial and lotic,and terrestrial and lentic.We followed Feiet al.(2012) in identifying the conservation status and endemicity of each species.We calculated the proportion of a species as the fraction of the number of the species in the total number of all species.We classified the abundance of a species as rare if the proportion of the species was < 1%,as common if the proportion of the species was 1%-5%,and as abundant if the proportion of the species was > 5%.We divided the study area along the elevational range of 200-1600 m into seven altitudinal levels at 200 m intervals.
To evaluate the species diversity in each survey locality and in every altitudinal level in the two mountain ranges,we calculated the Simpson index,Shannon-Wiener index,species richness,Cody index,and Sørensen-Dice coefficient using the following formulas (Fanget al.,2004):
Simpson index (P):
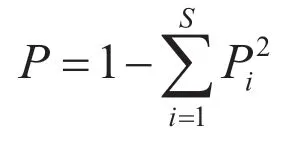
Piis number of individuals of speciesi/ total number of sample
Shannon-Wiener index (H’):

Species richness (S):
S=number of species in an area
Cody index (βc):

aandbare the number of species in samplesaandb,respectively,andcis the number of species shared by the two samples

Figure 1 Sketch map of the transect lines (red lines) and the species composition (pie graphs) of the amphibians in the Xianxialing and Wuyishan Mountain Ranges.NT:Niutoushan Mountain;BM:Baimashan Mountain;ZW:Ziweishan Mountain;JL:Jiulongshan Mountain;JLS:Jianglangshan Mountain;TB:Tongboshan Mountain;WY:Wuyishan Mountain;YJF:Yangjifeng Mountain;MT:Matoushan Mountain.
Sørensen-Dice coefficient (SI):

Simpson index and Shannon-Wiener index are integrated indices that reflect species richness and evenness.An increase in their values means greater uniformity in the distribution of the species in a community.Species richness refers to the number of species in a community.Cody index and Sørensen-Dice coefficient compare the variations in species composition among communities.Cody index reflects the species replacement rate among communities,whereas Sørensen-Dice coefficient determines the similarity of species composition among communities.We usedt-test to determine if the values of the Simpson index,Shannon-Wiener index,and species richness would differ between the two mountain ranges and one-way analysis of variance (ANOVA) to know if the values of the Cody index and Sørensen-Dice coefficient would vary among the survey localities within each mountain range and between both mountain ranges.We used Tukey’spost hoctest to perform multiple comparisons if necessary.
We constructed contingency tables using binary data to record the amphibians observed and coded the presence of a species in a survey locality as 1 or its absence as 0.We performed cluster analysis to examine the similarities in species composition among survey localities.We conducted the unweighted pairgroup method with arithmetic means (UPGMA) for the amalgamation rule and determined the Euclidean distance for distance measurement.
We used the Steven (1989)’s method as well as the cross-species method of Letcher and Harvey (1994) to test the relationship between species range size and altitudinal range.In the Steven’s method,we conducted linear analysis to determine if the mean range size of all the species within each altitudinal range would be correlated with the corresponding midpoint of elevation.In the cross-species method,we performed linear analysis to know if the range size of each species would be correlated with the corresponding midpoint of elevation.A positive correlation signified that the results support the elevational Rapoport′s rule,whereas a negative one rejected the rule.
All data were tested for normality (Kolmogorov-Smirnov test) and homogeneity of variances (Bartlett’s and Box’s M tests).All statistical analyses were performed using Statistica 10.0(Tulsa,OK,USA).The values were presented as mean ± SE,and the significance level was set at α=0.05 throughout this study.
3.Results
3.1.Species composition and diversityWe found 27 species of amphibians including 1 tailed species of the family Salamandridae and 26 anuran species of the families Bufonidae,Dicroglossidae,Megophryidae,Microhylidae,Ranidae,and Rhacophoridae in the Xianxialing and Wuyishan Mountain Ranges (Table 1).Ranidae (44% of all species) was the dominant family in both mountain ranges.The species (37%) found in lotic habitats were the dominant ones in both mountain ranges(Table 1).Three (11%) of all the species recorded during the surveys are already considered near threatened (NT),two (7%)are vulnerable (VU),and the rest (22 species,82%) are of least concern (LC) (Table 1).Remarkably,we documented 13 species that are endemic to China,and they belong to 11 genera and 4 families (Table 1).
The species composition of the amphibians in the two mountain ranges is illustrated in Figure 1.In terms of species richness,the most common group of amphibians consisted of ranid frogs in the Xianxialing Mountain Range (50%) and in the Wuyishan Mountain Range (39%).The salamandrid and bufonid species (< 5%) had the lowest species richness in both mountain ranges.The values of the Simpson index,Shannon-Wiener index,and species richness of amphibians in each survey locality is provided in Table 2.The three indexes did not differ between the two mountain ranges,but the Cody index(F2,33=8.74,P< 0.001) and Sørensen-Dice coefficient (F2,33=7.89,P< 0.002) significantly differed within and between the mountain ranges.Specifically,the difference in Cody index was greater between the two mountain ranges than it was within each mountain range,whereas that in Sørensen-Dice coefficient was lesser between both mountain ranges than it was within each mountain range (Figure 2).The survey localities in the Xianxialing Mountain Range were clustered in one branch,and those in the Wuyishan Mountain Range were grouped in another one (Figure 3).
3.2.Elevational distributionThe elevational trends of the five diversity indexes are shown in Figure 4.The Simpson index varied from 0.83 to 0.87 and the Shannon-Wiener index ranged from 2.0-2.3 at elevations below 1000 m,and both indexes dramatically decreased at altitudes above 1000 m (Figure 4A,B).The species richness of the amphibians increased to a maximum value of 23 at elevations below 600 m and gradually decreased at altitudes above 600 m (Figure 4C).The Cody index reached its highest value of 4.5 at elevations below 600 m,and it initially decreased at an altitudinal range of 600-1000 m and subsequently increased at elevations above 1000 m (Figure 4D).The Sørensen-Dice coefficient decreased from its highest value of 0.84 at elevations below 800 m,and it initially increased at 800-1000 m and eventually decreased at altitudes above 1000 m(Figure 4E).
Based on the results of the Steven’s method,the species range size of the amphibians was positively correlated with elevation(allP< 0.01) (Figure 5A,B,C).Nonetheless,their species rangesize was also positively correlated with altitude only when the cross-species method was employed to analyze some parts of the sampling dataset excluding the species observed in only one transect line or in only one mountain range (bothP< 0.001;Figure 5E,F).No significant correlation emerged between species range size and elevation when the whole sampling dataset was subjected to the cross-species method (F1,25=3.23,P=0.084) (Figure 5D).
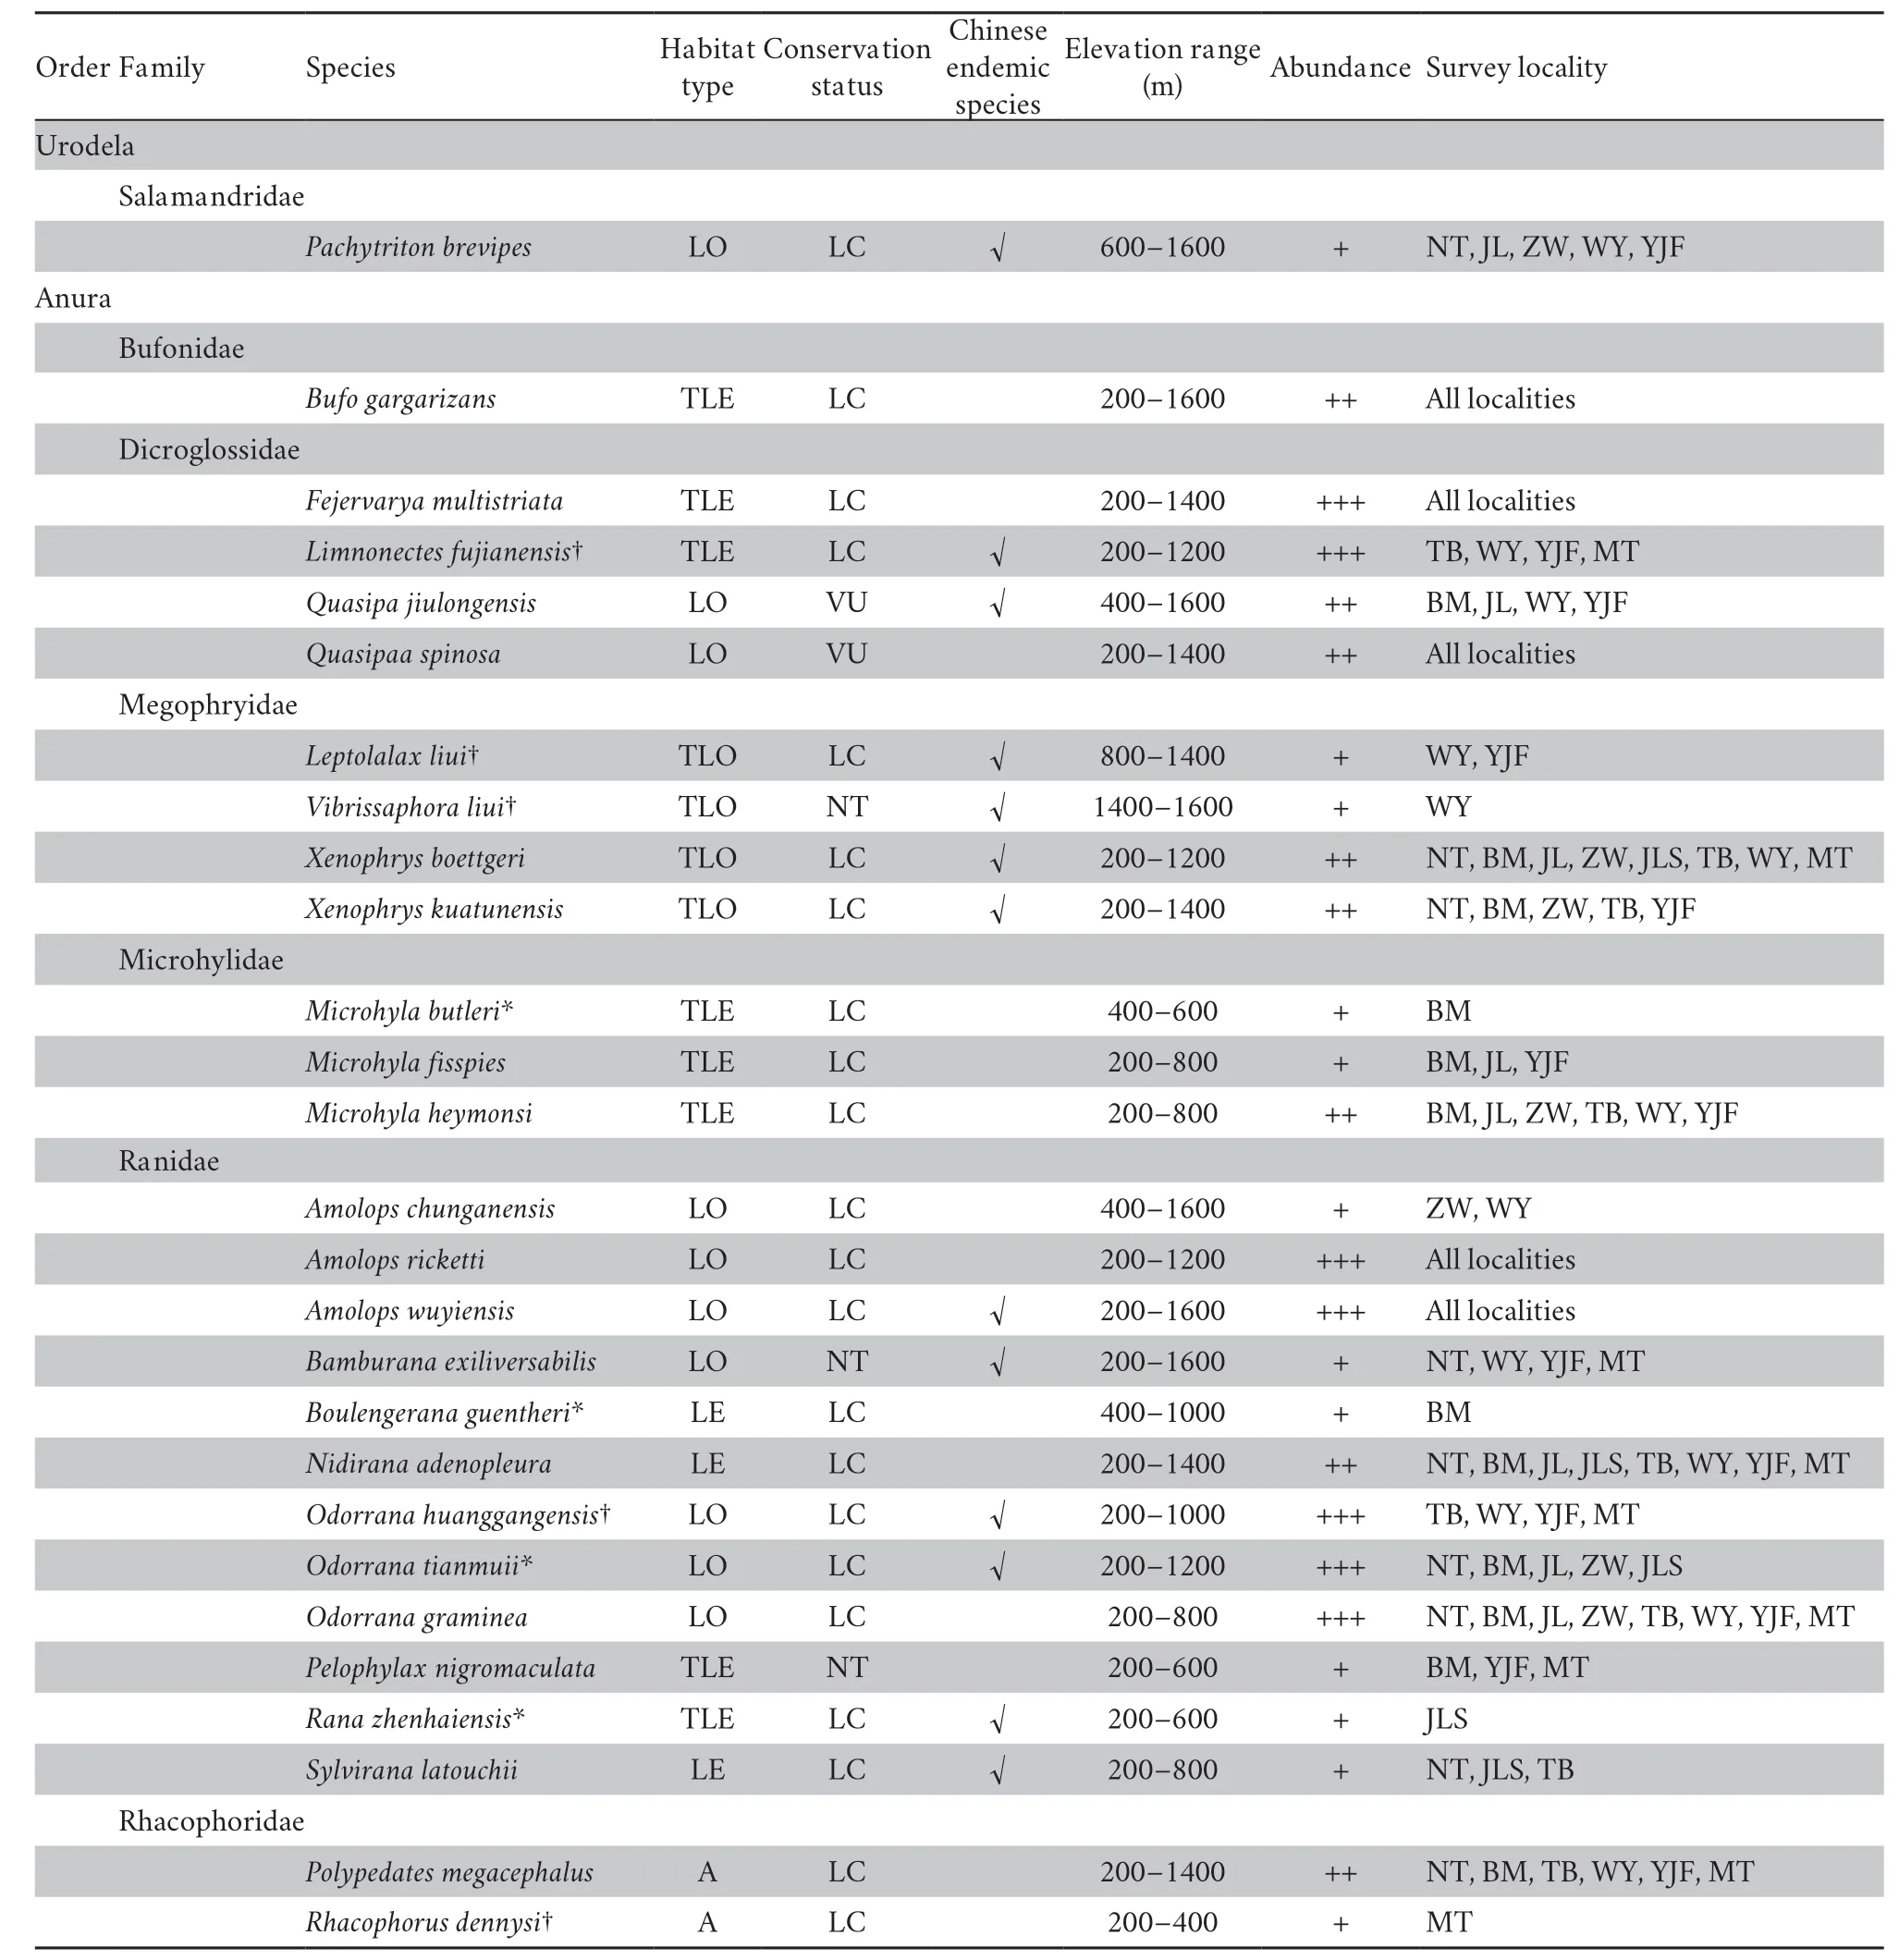
Table 1 Habitat types,conservation status and abundance of recorded amphibians on our observed data in the Xianxialing and Wuyishan Mountain Ranges.
4.Discussion
4.1.Species composition and diversityGeographic andclimatic factors,such as topography,elevation,latitude and longitude,annual rainfall,and air temperature,generally have significant influences on the species composition of amphibians (Sun,2007;Duanet al.,2016).For example,Shen(1985) ascertained that amphibians could be divided into many branches in a cluster analysis in response to changes in air temperature and rainfall.Based on the results of our cluster analysis,the Cody index and Sørensen-Dice coefficient all indicated that there were indeed certain differences in the species composition of the amphibians in the Xianxialing and Wuyishan Mountain Ranges.Both mountain ranges are intersected by the northwest-southeast slopes of the Fugaishan Mountain,thereby differentiating the climate,temperature,and rainfall of the two mountain ranges.The annual average air temperature (15.8°C) and annual average rainfall (2022 mm)in the Wuyishan Mountain Range are higher than those in the Xiaxianling Mountain Range (14.5°C,1867 mm).Therefore,temperature and rainfall were most likely the external factors that influenced the species composition of the amphibians in the two mountain ranges.

Table 2 Simpson index,Shannon-Wiener index and species richness of amphibians at each survey locality in the Xianxialing and Wuyishan Mountain Ranges,and results of t-test for comparisons between the two mountain ranges.ns:no significant.See Figure 1 for abbreviations for survey localities.
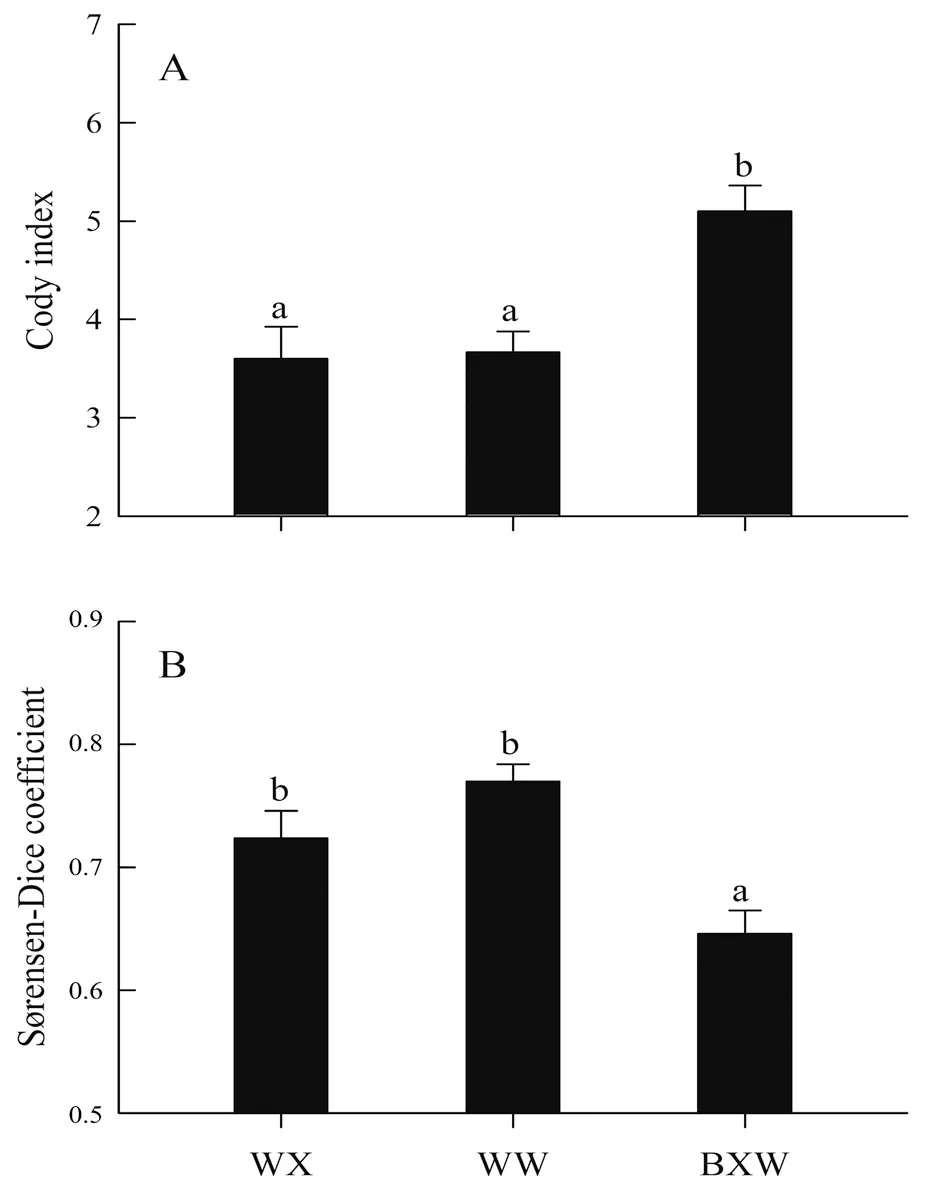
Figure 2 The Cody index (A) and Sørensen-Dice coefficient (B) of the amphibians within the Xianxialing and Wuyishan Mountain Ranges and between the two mountain ranges.Different alphabets above the bars indicate significant difference (Tukey’s post-hoc test,α=0.05,a > b).WX:survey areas within the Xianxialing Mountain Range;WW:survey areas within the Wuyishan Mountain Range;BXW:survey areas between the two mountain ranges
The species belonging to family Ranidae accounted for 50%of the total number of amphibian species in the Xianxialing Mountain Range,but only 39.1% in the Wuyishan Mountain Range.Some studies in the regions at similar latitudes showed that the proportion of Ranidae species was larger when the total number of species was smaller.For example,Ranidae species accounted for 75% of the total number in the Sichuan Labahe Natural Reserve (Liet al.,2003) and 71.4% in the Nanzhao Baotianman Natural Reserve (Guoet al.,2012),where the total numbers were both <15.Additionally,in the regions with abundant amphibian species,the proportion of Ranidae also increased as the total number of amphibian species multiplied (Lu,2008;Yanget al.,2009;Wanget al.,2011;Panet al.,2014).These results indicate that the species composition of amphibians may differ even in environments with similar geographic features.

Figure 3 Cluster analysis of the amphibians in the Xianxialing and Wuyishan Mountain Ranges.Euclidean distances are shown in the figure.NT:Niutoushan Mountain;BM:Baimashan Mountain;ZW:Ziweishan Mountain;JL:Jiulongshan Mountain;JLS:Jianglangshan Mountain;TB:Tongboshan Mountain;WY:Wuyishan Mountain;YJF:Yangjifeng Mountain;MT:Matoushan Mountain.
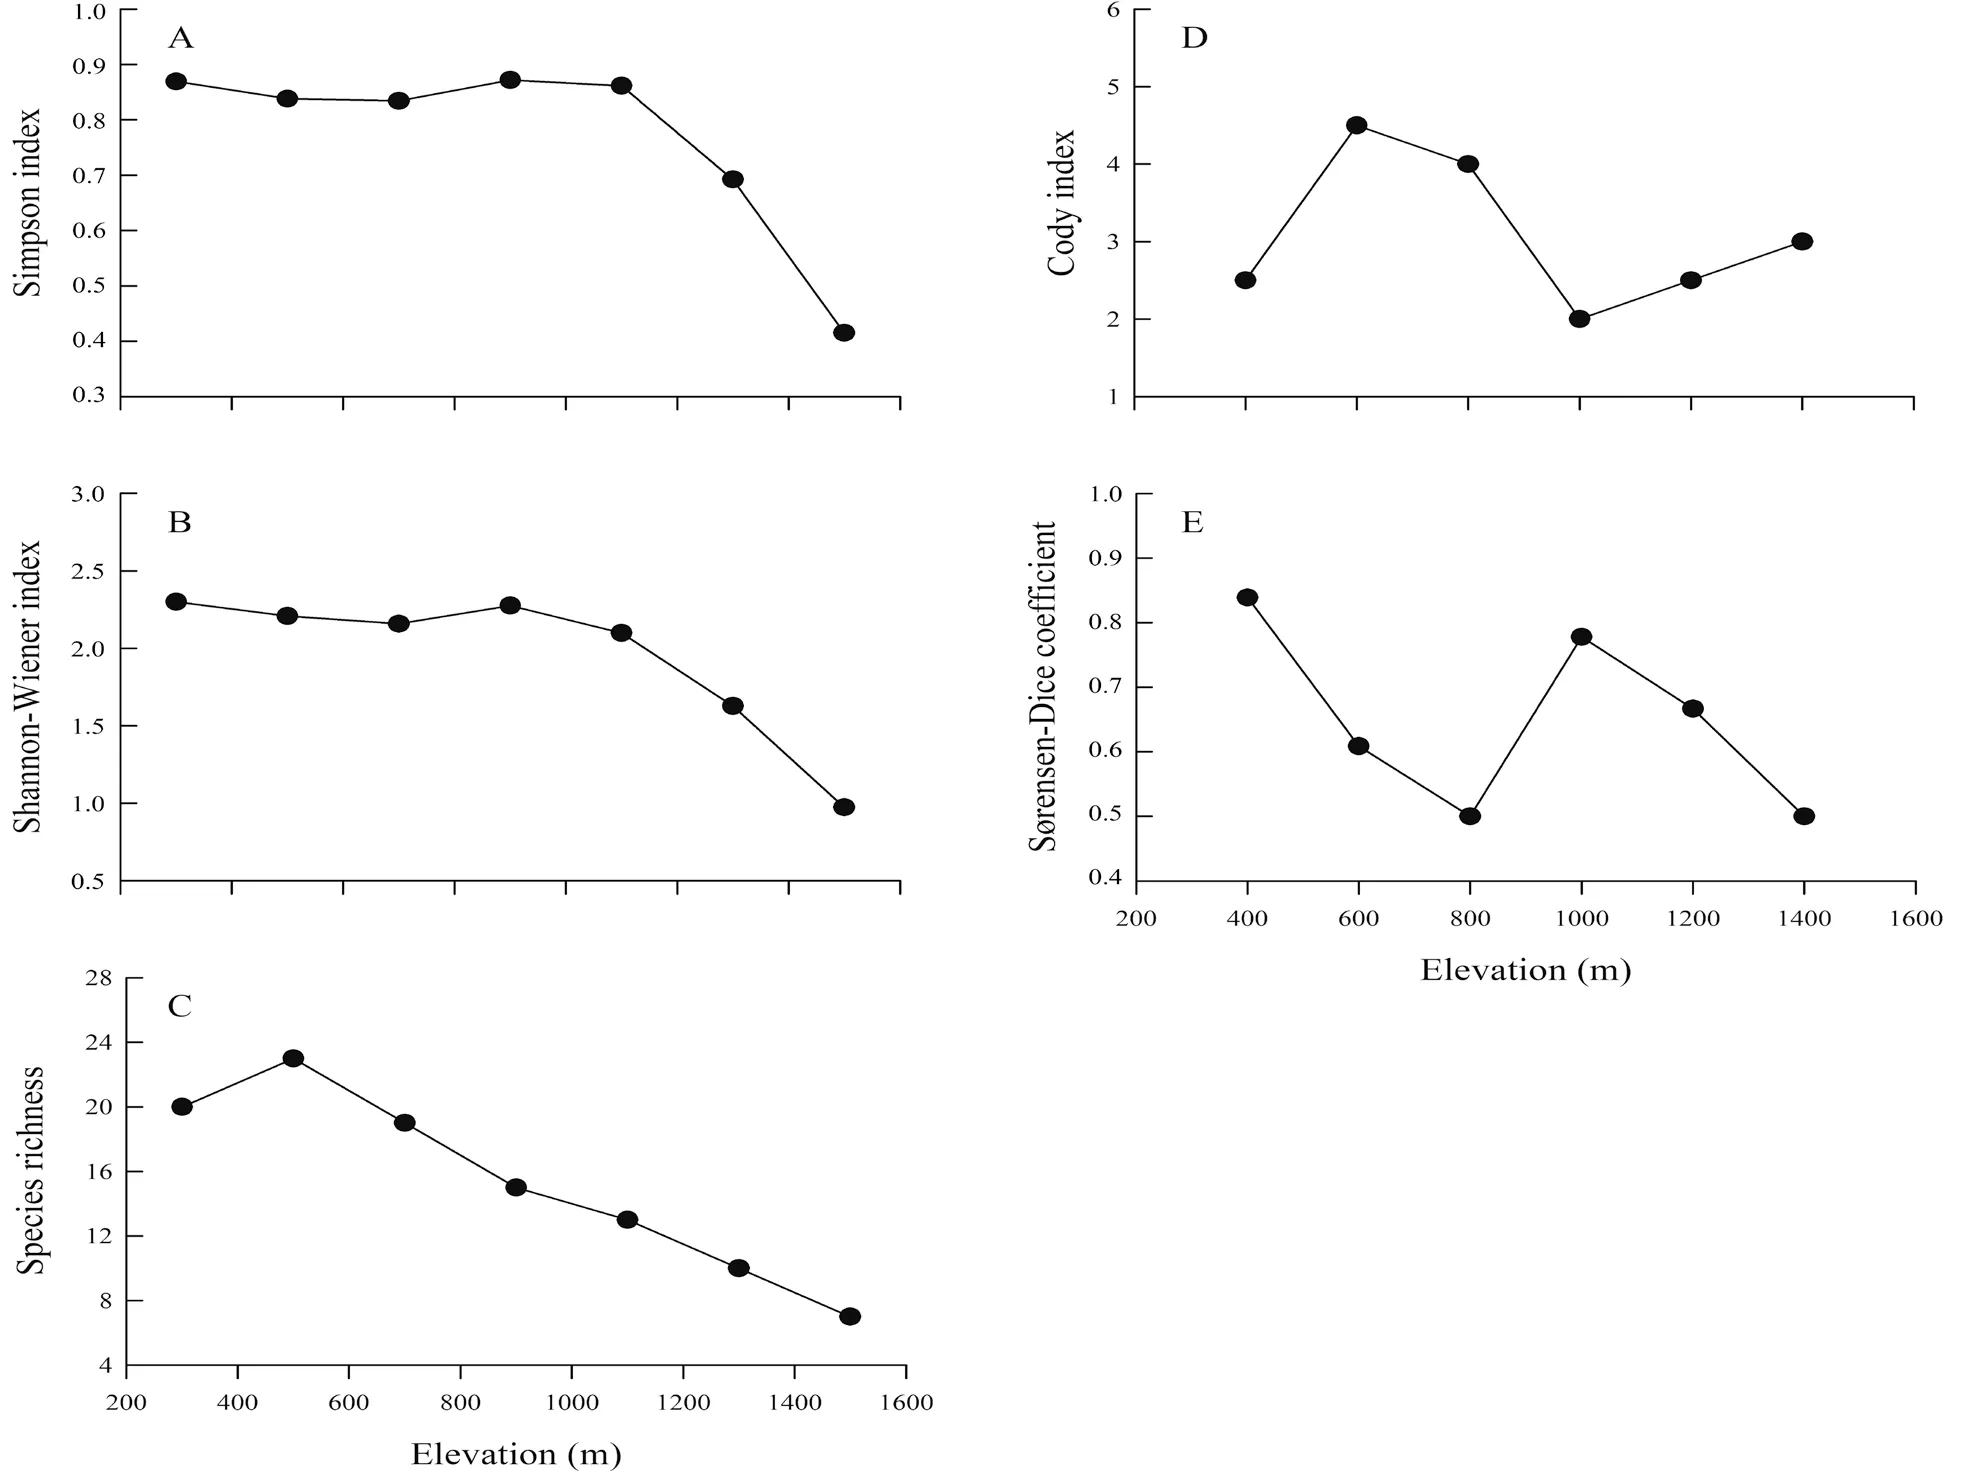
Figure 4 The Simpson index (A),Shannon-Wiener index (B),species richness (C),Cody index (D) and Sørensen-Dice coefficient (E) of the amphibians along the elevational gradient in the Xianxialing and Wuyishan Mountain Ranges.
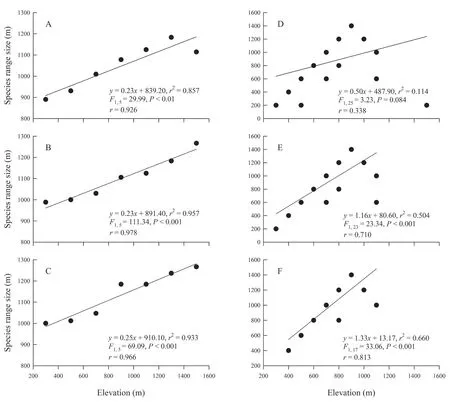
Figure 5 The relationship between species range size and elevational gradient according to the results of the Steven’s method (A,B,C)and the cross-species method of Letcher and Harvey (D,E,F) for the surveyed amphibians in the Xianxialing and Wuyishan Mountain Ranges.A and D:the data of all the species were used;B and E:the data of the species observed only in one transect line were deleted;C and F:the data of the species observed only in the Xianxialing Mountain Range or the Wuyishan Mountain Range were deleted.
There were no significant differences in the Simpson index and Shannon-Wiener index of the two mountain ranges,indicating that both their species richness and evenness were correspondingly similar.However,these two indexes substantially varied among all the survey areas.The transect lines in NT,ZW,JLS,TB,and MT were set at lower elevations.The mountains NT,ZW and JLS have been developed as tourist spots and have been extensively subjected to human activities.The mountains TB and MT were just recently established as National Nature Reserves,and the efforts of protecting the amphibians in these mountains have been are incomparable to those in other nature reserves;thus,these mountains have lower species diversity.We found fewer species in JL probably because of the erratic weather conditions during our survey in the mountain.The mountains YJF and WY have long been designated as National Nature Reserves,so they already have stronger ecological and environmental protection measures to benefit the survival and reproduction of amphibians,and consequently,these mountains have higher species diversity.Finally,the higher species diversity observed in BM was probably due to the greater altitudinal range.
4.2.Elevational distributionAlong with the elevational gradient,the Simpson index and Shannon-Wiener index both showed a low-elevation plateau pattern,and the plateaus were observed within the elevational range of 200-1000 m,similar to the findings of Wanget al.(2015).It was probably caused by the differences in vegetation types.The Wuyishan Mountain Range has an evergreen broad-leaved forest belt with warm coniferous forest and bamboo forest at an altitudinal range of 350-1000 m.The mountain range also has an evergreen broadleaved mixed forest at the altitudinal range of 1000-1400 m(Luet al.,2010).In addition,the lower species diversity that we recorded at higher altitude was probably due to the lower temperature and pressure (Barry,2008) at that elevational range and,consequently,to the lesser complexity of the amphibian habitats therein (Wanget al.,2015).In contrast,the species richness of amphibians at the altitudinal range of 400-600 m showed a low-elevation plateau pattern with a mid-point peak,indicating that the habitats in this altitudinal range were more favorable for the survival and reproduction of amphibians.Furthermore,the findings of Sanders and Rahbek(2012) suggest that the low-elevation plateau pattern with a mid-point peak is the most common variation pattern of species richness with elevation.However,the variation rules of species richness along the elevation gradient are diversified in different regions.For example,the species richness of amphibians in the Baishuijiang Reserve has a monotonically decreasing pattern,while that in the Hengduan Mountain Range has a midelevation peak pattern (Fuet al.,2006;Zhenget al.,2014a).These regions are situated on plateaus with an elevational range of 2500-3100 m,largely different from the altitudinal ranges of our study areas in the Xianxianling and Wuyishan Mountain Ranges.Hence,the elevational range could be considered as one of the reasons behind the different patterns of species richness that we recorded.
Based on the species replacement rate and species similarity,we found that the populations along the elevational range of 600-1000 m experienced the most notable changes,indicating that the 800-m altitude is the boundary of the elevational distribution of the amphibians in our study.The lower species diversity and composition that we documented at higher elevations implies that it may be more difficult to recover such species diversity and composition when habitat destruction happens at these elevations.Furthermore,the lower limits of the elevational distribution of these species,including Chungan torrent frogAmolops chunganensis,Fujian bamboo-leaf frogBamburana exiliversabilis,Fujian large-headed frogLimnonectes fujianensis,Large odorous frogO.gramineaand Paddle-tailed newtPachytriton brevipes,were all below the boundaries reported by Wanget al.(2015).This could be related to the destruction of their original habitats,compelling the species to migrate to lower elevations.
4.3.Elevational Rapoport’s rule examinationThe integration of species distribution and species richness along an elevational gradient is a controversial subject in biodiversity research (Brown,2001;Lomolino,2001;Cain,2009;Malonza,2015).The elevational Rapoport’s rule has been considered as one of the most critical hypotheses on distribution patterns related to species richness (Stevens,1996;Chenet al.,2011).The altitudinal distribution patterns of species range size in the northern hemisphere support the Rapoport’s rule (Whittonet al.,2012),but Cain and Knight (2013) suggested that the rule is not relevant to all regions.Our findings indicate that either the affirmation or rejection of the rule is closely related to the habitats associated with the elevational distribution of amphibians.Furthermore,as intermediate organisms between aquatic and terrestrial animals,amphibians are easily affected by temperature and hydrology (Xuet al.,2004;Raffelet al.,2006;Vitt and Caldwell,2009).
Particularly,the Steven’s method and cross-species method were used to examine the elevational Rapoport’s rule.The results of the Steven’s method strongly supported the rule whether there was an incidental occurrence of the species or not,whereas those of the cross-species method validated the rule only when the influence of the low-frequency occurrence probability of the surveyed species was excluded.Overall,these results indicate that amphibians at higher elevations can have a species range size broader than those at lower elevations.Considering the differences in the complexity of and the temperatures in the habitats at varying altitudes,the species distributed at higher altitudes can better adapt to extreme environments and can be more widely distributed,compared to those dwelling at lower altitude.However,some surveys performed in similar regions do not support these theories.For example,the data of Wanget al.(2015) from the Wuyishan Mountain Range were insufficient to substantiate the rule.The findings of Zhenget al.(2014a,b) in similar latitudes in the Baishuijiang and Qinlin Mountain Ranges also failed to corroborate the rule.Therefore,the survey methods (Shen and Lu,2009) and survey scales (Colwell and Hurtt,1994) may be responsible for the discrepancies in the results of the different surveys.
4.4.Sampling limitationsIn previous studies,a total of 10 families,30 genera,and 52 species of amphibians were recorded in the study area (Feiet al.,2009;2012),whereas in our study,only 7 families,19 genera,and 27 species were observed.Moreover,6 species belonging to order Caudata and 19 species of the order Anura that were previously recorded were not detected in both mountain ranges in our study.The species that we failed to find include the Chinese giant salamanderAndrias davidianusand Chinese tiger frogHoplobachus chinensis.Their rarity might be one reason why we failed to detect them during our study.Both species are Class II nationally protected species with extremely low populations in China.The other species that we did not find in the study area wereHynobiusfrogs,Hylafrogs,Yaoshan moustache toadVibrissaphora liui yaoshanensis,Eastern golden frogPelophylax plancyi,Daiyun torrent frogAmolops daiyunensis,Chinese bubble-nest frogTheloderma rhododiscus,and Chinese whipping frogRhacophorus chenfui.As we know,they are distributed beyond our survey areas,far from our transect lines.Zhu (2016) conducted a detailed species categorization of Piebald odorous frogOdorrana schmackeriby studying the genetic differentiation of thespecies complex and concluded that the specialO.schmackeriis distributed only in the western region of the Luoxiaoshan Mountain,in six provinces or cities north of the Xuefengshan Mountain and the Nanling Mountain and in the eastern regions of the Wushan Mountain and the Dabashan Mountain.Therefore,we did not find this species as well in our surveys.Zou (1987) investigated the distribution range of the Asian common toadDuttaphrynus melanostictusand Asiatic toadBufo gargarizansand argued thatD.melanostictusis mainly distributed in the Jiangxi Province,south of 26° N.We did not encounterD.melanostictusessentially because the area where it should have been found was not included in our survey.
AcknowledgementsThe work was carried out in compliance with the current laws on animal welfare and research in China,and was supported by grants from the Zhejiang Provincial Natural Science Foundation of China(LQ16C040001,LY17C030003),National Natural Science Foundation of China (31500308,31971414),Special Foundation for Basic Work of the Science and Technology Ministry of China (2015FY110200) and Zhejiang Science and Technology Innovation Program for College Students (2019R434006).We thank Hongxing GUO,Yingchao HU,Youfu LIN,Hongze QI,Zeshuang WANG,Haohua WEI,Yankun WU and Yaofei YU for assistance during the research.
杂志排行
Asian Herpetological Research的其它文章
- Changes on Anuran Tadpole Functional Diversity along an Environmental Gradient at the Southernmost Atlantic Rainforest Remnant
- Does Light Exposure during Embryonic Development Affect Cognitive Behavior in a Lizard?
- A Revised Checklist of Amphibians and Reptiles in Camiguin Sur,Misamis Oriental,Mindaanao,Philippines
- Genetic Differentiation of the Forest Crested Lizards,Calotes emma alticristatus Schmidt,1925 and C.emma emma Gray,1845 (Squamata:Agamidae) Relating to Climate Zones in Thailand
- A New Species of the Asia n Toad Genus Megophrys sensu lato(Anura:Megophryidae) from Guizhou Province,China
