Effect of cavity flow control on high-speed train pantograph and roof aerodynamic noise
2020-04-17HogunKimZhiweiHuDavidThompson
Hogun KimZhiwei Hu·David Thompson
Abstract The pantograph and its recess on the train roof are major aerodynamic noise sources on high-speed trains.Reducing this noise is particularly important because conventional noise barriers usually do not shield the pantograph.However,less attention has been paid to the pantograph recess compared with the pantograph.In this paper,the flow features and noise contribution of two types of noise reduction treatments rounded and chamfered edges are studied for a simplified high-speed train pantograph recess,which is represented as a rectangular cavity and numerically investigated at 1/10 scale.Improved delayed detached-eddy simulations are performed for the near-field turbulent flow simulation,and the Ffowcs Williams and Hawkings aeroacoustic analogy is used for far-field noise prediction.The highly unsteady flow over the cavity is significantly reduced by the cavity edge modifications,and consequently,the noise radiated from the cavity is reduced.Furthermore,effects of the rounded cavity edges on the flow and noise of the pantographs(one raised and one folded)are investigated by comparing the flow features and noise contributions from the cases with and without rounding of the cavity edges. Different train running directions are also considered.Flow analysis shows that the highly unsteady flow within the cavity is reduced by rounding the cavity edges and a slightly lower flow speed occurs around the upper parts of the raised pantograph,whereas the flow velocity in the cavity is slightly increased by the rounding.Higher pressure fluctuations occur on the folded pantograph and the lower parts of the raised pantograph,whereas weaker fluctuations are found on the panhead of the raised pantograph.This study shows that by rounding the cavity edges,a reduction in radiated noise at the side and the top receiver positions can be achieved.Noise reductions in the other directions can also be found.
Keywords High-speed train·Aeroacoustics·Pantograph·Pantograph recess·Cavity flow·Noise control
1 Introduction
The aerodynamic noise of high-speed train becomes significant when the train is operated above about 300 km/h[1].Pantographs and the pantograph recess are recognised as significant contributors to aerodynamic noise for highspeed train[1-4].Studies of pantograph noise have provided insight into the noise generation mechanisms and methods of noise reduction[5-7].
Grosche et al.[8]carried out experiments to investigate the noise source distribution of a full-scale DSA350 pantograph.They identified three areas,the foot,the panhead and the knee connector,as the main noise sources.Lo¨lgen[9] performed tests in a wind tunnel for full-scale DSA350SEK,ASP and PS206 pantographs at flow speeds up to 400 km/h.Strong tonal peaks in the radiated noise spectra were found and linked to vortex shedding from the contact strip, the horn and the stroke limiting cage.Lauterbach et al.[10]performed aeroacoustic experiments in a wind tunnel using a 1/25 scale model of the ICE 3 train.They found that the pantograph generated strong tonal components which dominated the noise spectrum for frequencies above 5 kHz(200 Hz at full scale)[10].Zhang et al.[11]performed numerical simulations for a full-scale DSA380 pantograph at a speed of 350 km/h using large eddy simulation (LES) for the flow field and FW-H acoustic analogy for the far-field pressure.Three peaks,at 305,608 and 913 Hz,were found in the noise spectrum of the pantograph panhead at the top receiver position.They indicated that the first peak is associated with the oscillation of the lift force of the panhead contact strip and the second peak is generated by the interaction between the wake from the panhead contact strip and horn bush and the panhead support.They also compared different running directions of the train with the pantograph knee either downstream or upstream.
Several experimental and numerical studies have been performed to study the flow and acoustic features of the pantograph recess[12,13].Noh et al.[12]carried out noise tests for a full-scale Korean high-speed train(KTX).They found that the noise from the recess was at similar level to that from the pantograph at a speed of 300 km/h.Noger[13]performed experiments to investigate the aerodynamic and acoustic features of the Train a`Grande Vitesse(TGV)pantograph recess and found that the trailing edge region of the recess was a major noise source.Interactions between the wake of the pantograph and the shear layer cause lower turbulent intensity in the downstream region of the cavity.High turbulent intensity was identified at the upstream region of the recess due to interaction between shear layer from the cavity leading edge and pantograph.
Niu et al.[14]carried out numerical investigations of the flow features with two different train nose lengths for a three-coach 1/8 scale at a speed of 60 m/s.They found that there was no significant effect of leading coach nose on the boundary layer thickness of the train roof,whereas the long nose length reduced the boundary layer thickness of the side of the train.Furthermore,the boundary layer of the trailing coach had a thicker thickness boundary layer than that of the leading coach.Carnevale et al.[15]studied the effect of aerodynamics lift force on the mean contact force acting between the contact wire and a raised pantograph using a numerical method.They indicated that when the pantograph was installed on a middle coach,the flow speed in the upper arm and the panhead region of the pantograph is approximately 20%lower than the speed in the wind tunnel test,which has a significantly thin boundary layer.
A simplified pantograph recess can be considered as a‘closed’ cavity (length-to-depth L/D=10 [16]).Plentovich[16]stated that the boundary between transitional and closed cavity flows was not clearly seen due to a strong dependency on the Mach number,L/D and the width of the cavity.However,the closed cavity flow appeared above from about L/D ≥9 up to L/D ≥15.Ng[17]classified cavity flow regimes at a very low Mach number(M=0.029). He reported transitional-closed at 10<L/D<15 and closed cavity flow for 15<L/D.Generally,the high-speed train pantograph recess has L/D approximately equal to 11.
Investigations of cavity flow at low speed have been conducted to predict and reduce noise from aircraft landing gears and automobile sunroof cavities.Wang et al.[18]investigated the mechanism of buffeting noise from an automobile sunroof with a simplified cavity model using computational fluid dynamics(CFD)at speeds between 15 and 50 m/s and carried out wind tunnel tests at speeds of 15-25 m/s.They found that the sunroof buffeting noise is likely to be an open cavity noise mechanism.The sunroof buffeting noise occurs due to the periodicity of flow separation and vortex shedding from the leading edge of the cavity and vortex impingement on the cavity trailing edge.A study aimed at reducing open cavity noise was carried out numerically at Mach number 1.5 and 2.5 by Zhang et al.[19].They modelled two types of cavity leading edge modifications(compression ramps and an expansion surface).They showed that the compression ramp of the cavity leading edge reduced the sound pressure level(SPL)on the cavity wall at Mach number 2.5,but the change in SPL was negligible at Mach number 1.5.When the leading edge was modified as an expansion surface,the SPL on the cavity wall was reduced at both Mach numbers.
Noise reduction treatments for a closed cavity(such as the pantograph recess)have not been considered to the same extent.Therefore,this paper aims to investigate an efficient technique to control the cavity flow for the purpose of noise reduction.As most noise is generated by the shear layer from the leading edge and trailing edge of the cavity,the effects of modifications to the leading edge and the trailing edge are investigated.Furthermore,the effect of the modified cavity flow on the pantographs is investigated.
The paper is structured as follows:Sect.2 provides the geometry of the cavity modification and details of the grid generation.The numerical methodology and the computational set-up are provided in Sect.2.Section 2 presents the computational flow field results of the modified cavity,while far-field pressure results are presented in Sect.4.In Sects.3 and 5,the aerodynamic and acoustic simulations of the best case of the modified cavity are presented with pantographs introduced. Finally, conclusions are summarised in Sect.6.
2 Numerical methods and computational set-up
The simulations were performed using the commercial CFD package,STAR-CCM+.For flow field prediction,the three-dimensional unsteady incompressible Navier-Stokes equations were solved using the IDDES with Spalart-Allmaras turbulence model[20-22].The dipole source of the Ffowcs Williams and Hawkings(FW-H)equation is collected after the simulation has been statistically steady,and the Farassat’s formulation 1A is used to predict the far-field acoustic pressure[23-25].
2.1 Cavity near-field validation
The numerical results of the pressure coefficient Cpon the floor of a clean cavity are validated against measurements of Plentovich et al.[16],who investigated effects of the cavity length-to-depth ratio L/D on the cavity wall pressure distribution at Mach numbers of 0.2-0.95 using a transonic wind tunnel.
To validate the current calculations,the case of a cavity with L/D=12 (L=0.731 m and D=0.061 m) and width-to-depth W/D=4 at a Mach number M=0.2[16]was chosen because the geometry size and flow speed are similar to the current study.The simulations are carried out with different meshes and compared with the experimental data[16].
The computational domain is shown in Fig.1.It extends 12D upstream of the cavity to allow boundary layer to develop to have approximately the same thickness(δ=0.011 m)at the cavity leading edge as in the experiment(δ=0.0125 m)[16].It was checked after the simulation was done. Furthermore, the domain extends 48D downstream of the cavity,8D laterally from the cavity side edge to each domain side and 16D vertically.
For the boundary conditions of the simulations,all walls of the cavity and the floor are defined as non-slip wall conditions;symmetric boundary conditions are applied to the two side and top of the domain.An outflow boundary with pressure outlet is defined at the downstream boundary.A velocity inlet was set at the inflow with a freestream Mach number of 0.2(speed 70.2 m/s)corresponding to a Reynolds number of 1.8×10⁵based on the cavity depth.
Several mesh refinement zones are set in regions where flow field is expected to change more rapidly,such as the trailing edge region.Different cell sizes are applied for each refinement zone.For the purpose of a mesh dependence study,four meshes were generated with different mesh densities.The mesh dependence study strategy is that Δy,the first cell height from the wall,is kept constant whereas Δx and Δz,the cell lengths in the x-direction and the z-direction,respectively,are reduced.The ratios(Δx,Δz)max/Δy and cell number are listed in Table 1 for each mesh.The first layer non-dimensional wall distance y+where u*is the friction velocity,y1is the distance of the first grid point to the wall,and ν is the kinematic viscosity) is smaller than 1.0, and a grid stretching ratio of 1.12 in the wall normal direction is used.
A non-dimensional time step UΔt/D=0.0095 is used,where U is the freestream velocity,D is the depth of the cavity and Δt is time step(Δt=8×10⁻⁶s),which ensures that the CFL number(CFL=UΔt/Δx,where Δx is the grid size in streamwise direction)is less than 1 for all cases.
The mean coefficients of the surface pressure on the cavity floor obtained using the four meshes are compared with the experimental data of Plentovich et al.[16]in Fig.2.As the maximum mesh aspect ratio(Δx/Δy,Δz/Δy)is reduced, the pressure distribution converges to the measurement data.The distributions from the meshes with maximum cell aspect ratios 200 and 120 are in good agreement with the experimental data.It is concluded that the current numerical procedure is able to give accurate prediction for flow over a cavity with adequate mesh resolution.Simulations conducted in the remainder of this paper use meshes generated with similar resolution as the mesh with aspect ratio Δx,Δz/Δy=200.
2.2 Cavity geometry
The studied cavity geometry is chosen to represent a simplified pantograph roof cavity of a TGV train at 1/10 scale.The pantograph cavity is simplified to a rectangular cavity with dimensions length L=0.812 m,depth D=0.07 m and width W=0.29 m, giving L/D=11.5 and W/D=4.1. The cavity is modified by sloping the upstream and downstream surfaces while retaining a fixed depth D(Fig.3a).The angle θ is varied from 30°to 75°.In an alternative approach,the cavity leading and trailing edges are rounded with a radius h as shown in Fig.3b with the ratio h/D varying from 0.2 to 0.8.The modifications are the same for both edges as trains operate in both directions.
2.3 Numerical test section

Table 1 Mesh criteria for each cases for the cavity model
The computational domain is illustrated in Fig.4.It has dimension of 71.5D,29D and 4.1D along the streamwise(x),vertical(y)and spanwise(z)directions,respectively.No-slip wall conditions are applied to the cavity walls,while symmetry conditions are used for the top boundary and a pressure outlet is imposed at the outlet boundary.Periodic boundary conditions are applied to the two side surfaces of the domain.The inflow boundary is set as a velocity inlet with incoming flow velocity U∞=83.3 m/s(300 km/h).A hexa-dominated mesh,generated using the STAR-CCM+ mesh generator, is used with several refinement zones.Different cell sizes are specified for each refinement zone.The region of the cavity trailing edge is refined with a cell size of 1.2 mm,and a surface growth rate of 1.1 is applied.The non-dimensional cell size perpendicular to the wallis less than 1 on all wall surfaces.The cell aspect ratio near the wall is 200 (Δx/Δy,Δz/Δy=200)as validated in the previous section.Details of the mesh around the cavity edges are shown in Fig.5,and the numbers of cells for all cases are listed in Table 2.A non-dimensional time step is UΔt/D=0.0095,where D is depth of the cavity.The Reynolds number is Re=3.9×10⁵based on the cavity depth and the inflow velocity.
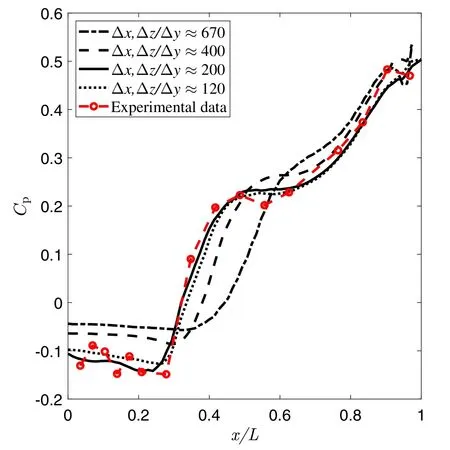
Fig.2 Comparison of the cavity floor pressure distributions at M=0.2 from computational results using different meshes and experimental data[16]
3 Aerodynamic results for the modified cavities
3.1 Forces
The coefficients of lift CLand drag CDare shown in Fig.6 for the cavity with rounded(h/D cases)and sloped edge(θ cases)treatments.Both the mean and the root-mean-square values are shown for each coefficient.The reference area for the force coefficients is the cavity cross section W×D=0.0196 m2.The force coefficients were calculated after 0.05 s when the flow was deemed to be statistically steady from the force coefficient time histories.The coefficient data were then collected at each time step for another 0.2 s.
The treatment of the leading and the trailing edges of the cavity induces changes in the force coefficients. Both treatments show a reduction in the mean drag coefficient CDwith reductions of 54%for h/D=0.8 and 20%for θ=60°,compared with the baseline case.The mean lift coefficientsshow negative values for all cases.When the cavity edges are rounded,the negative mean lift coefficient is reduced by 34%,compared with the baseline case and it remains almost constant for all values of h/D.The sloped edges cases also show a reduction in the negative mean lift coefficient,by 17%for θ=30°,45°and 60°and 10%for θ=75°.
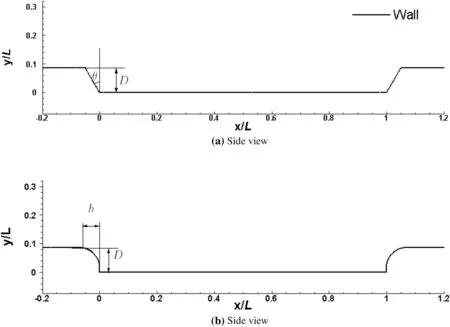
Fig.3 Description of the geometry
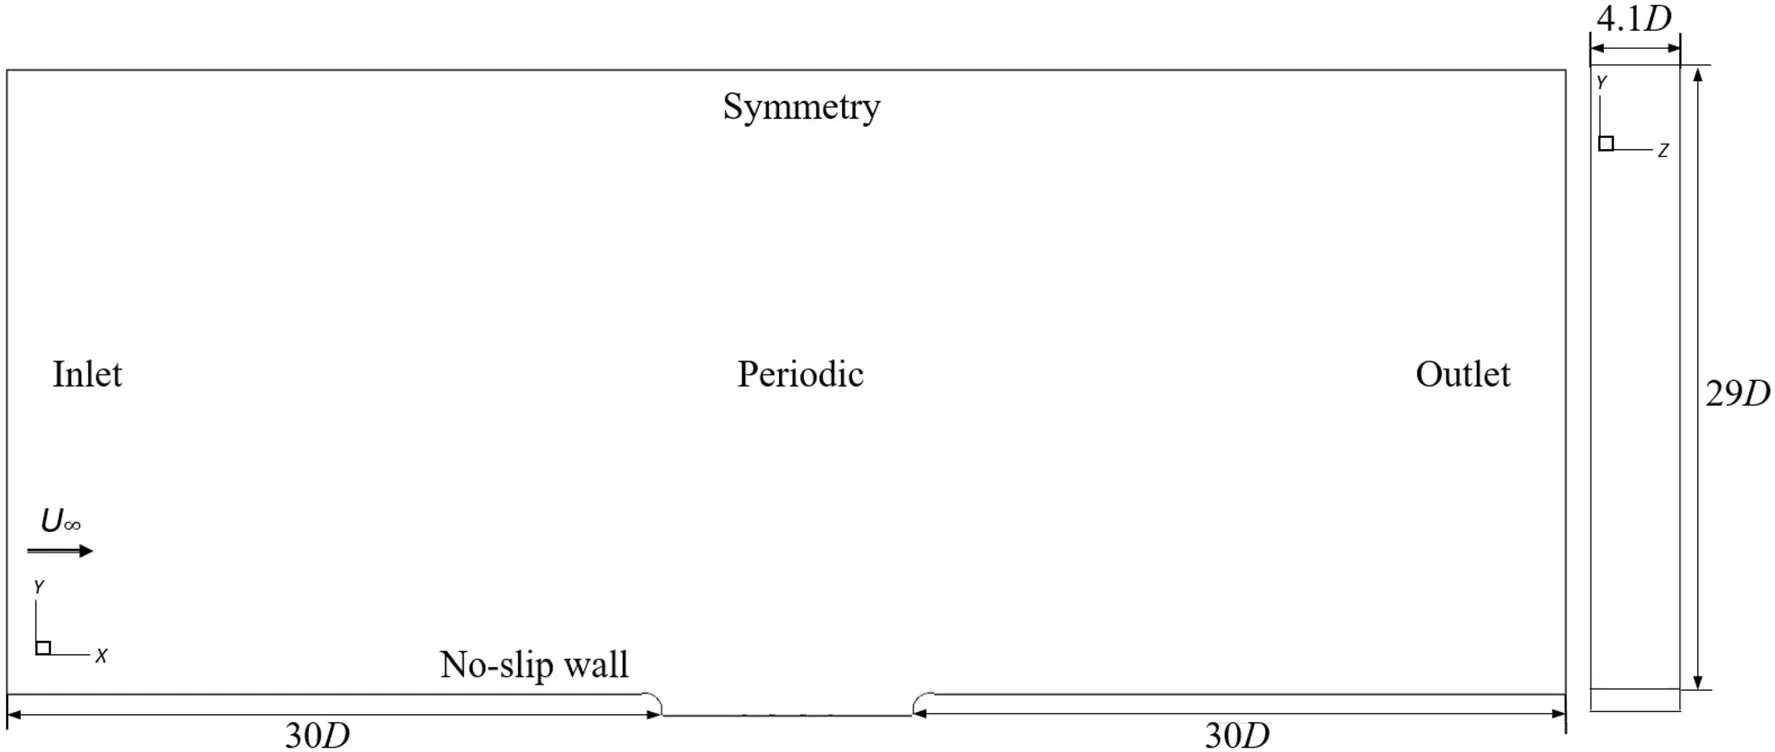
Fig.4 Computational domain and boundary conditions
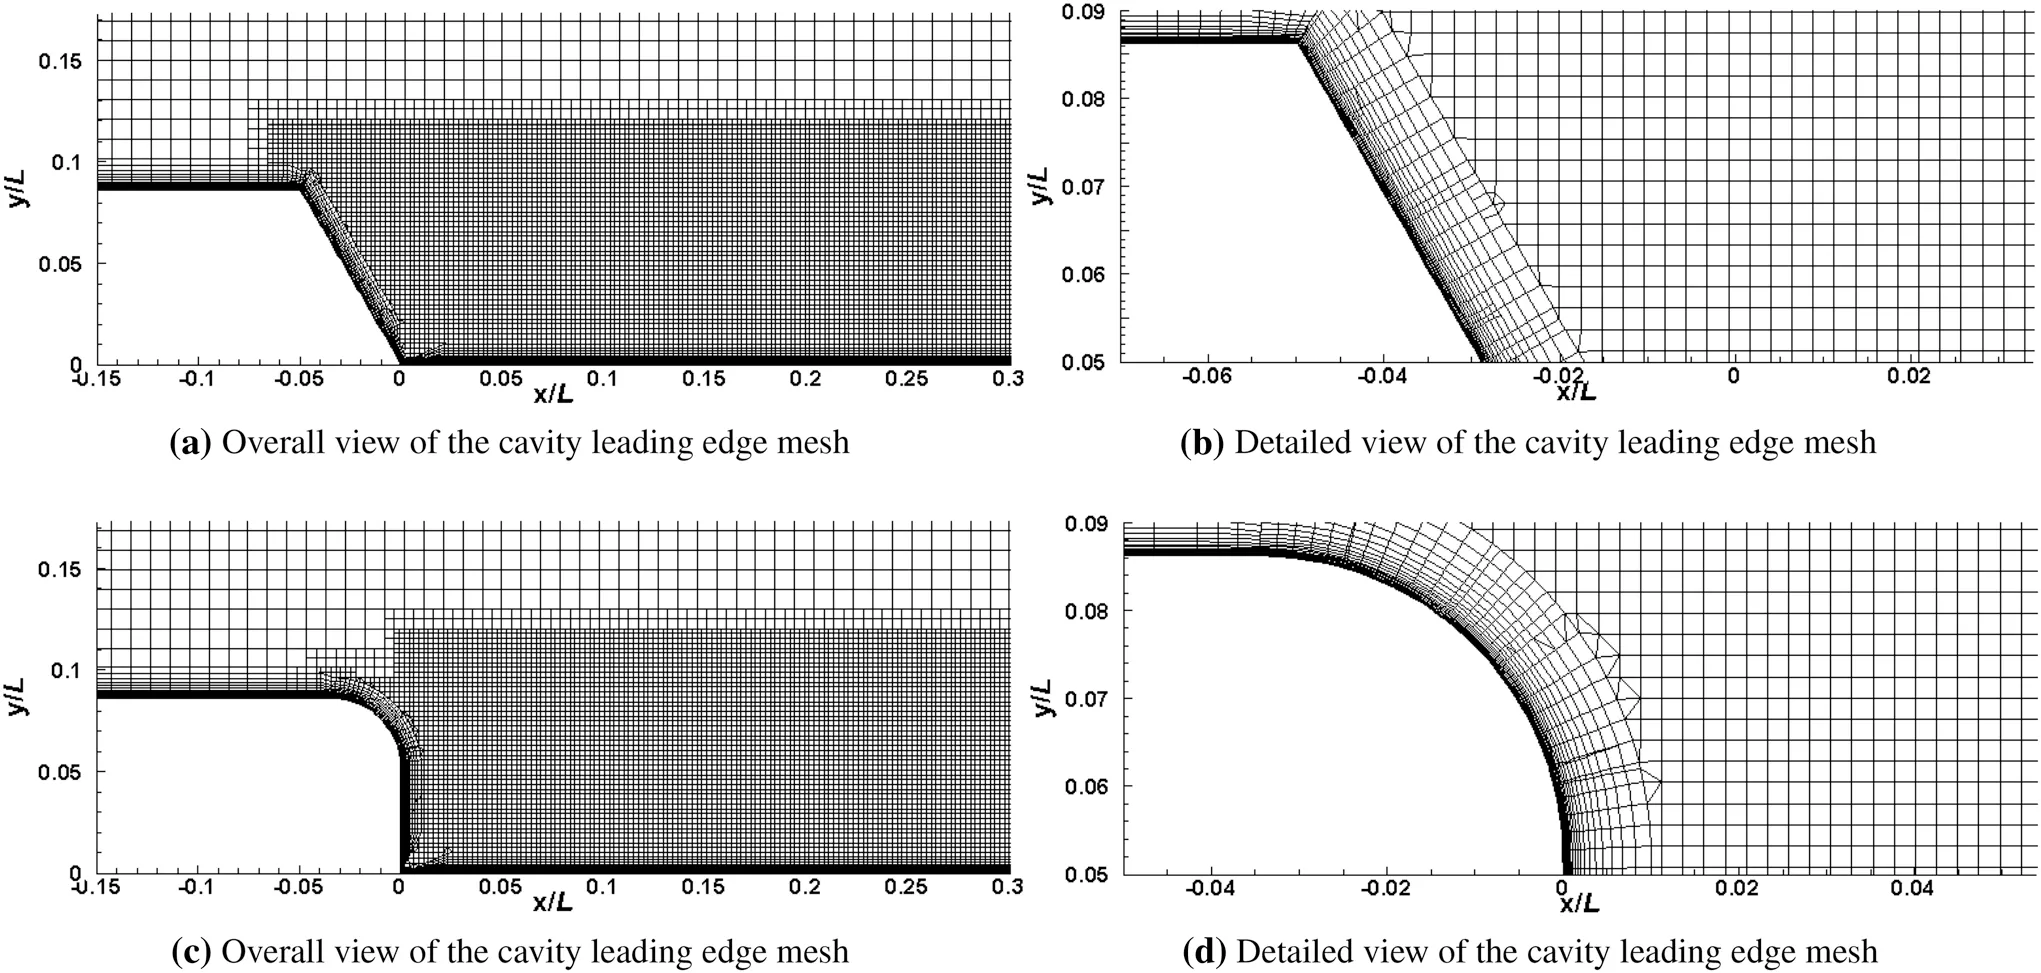
Fig.5 Overview and details of the meshes
In all cases,the rms lift coefficientis much higher than the rms drag coefficientBoth treatment methods of the cavity edges reduce the fluctuating lift and drag forces considerably.The largest reductions are the rounded edges.For h/D=0.8,the fluctuating lift and drag forces are reduced by 89%and 88%,respectively,compared with the baseline case.
3.2 Q-criterion
Figure 7 shows three-dimensional instantaneous flow features around the cavity based on the Q-criterion as normalisedthe second invariant of the velocity gradient[26].The iso-surfaces are coloured by the instantaneous velocity magnitude. For the baselineconfiguration shown in Fig.7a,the incoming flow separates immediately at the cavity leading edge,and Kelvin-Helmholtz(K-H)instabilities develop in the separated shear layer which leads to a highly turbulent flow occurs in the cavity region.Another highly unsteady flow region is seen at the cavity trailing edge and aft cavity wall region.When the cavity edges are rounded,the highly turbulent flow generated at the trailing edge of the cavity is significantly reduced as shown in Fig.7b for h/D=0.2 and Fig.7c for h/D=0.8(the other two cases show similar trend,therefore are not shown).This can also be seen in the turbulence kinetic energy as shown in Fig.8. It can effectively diminish the unsteady flow in this region even when the trailing edge is only slightly modified (see Fig.7b).Furthermore,the shear layer from the cavity leading edge is weakened by the rounding.Results for the sloped cavity walls are shown in Fig.7d,e.Here also,the highly unsteady flow is reduced.However,the reduction of the turbulent flow generated by the cavity trailing edge is much smaller than for the cases with the rounded cavity edges.The strength of the shear layer from the leading edge is similar to the baseline case.
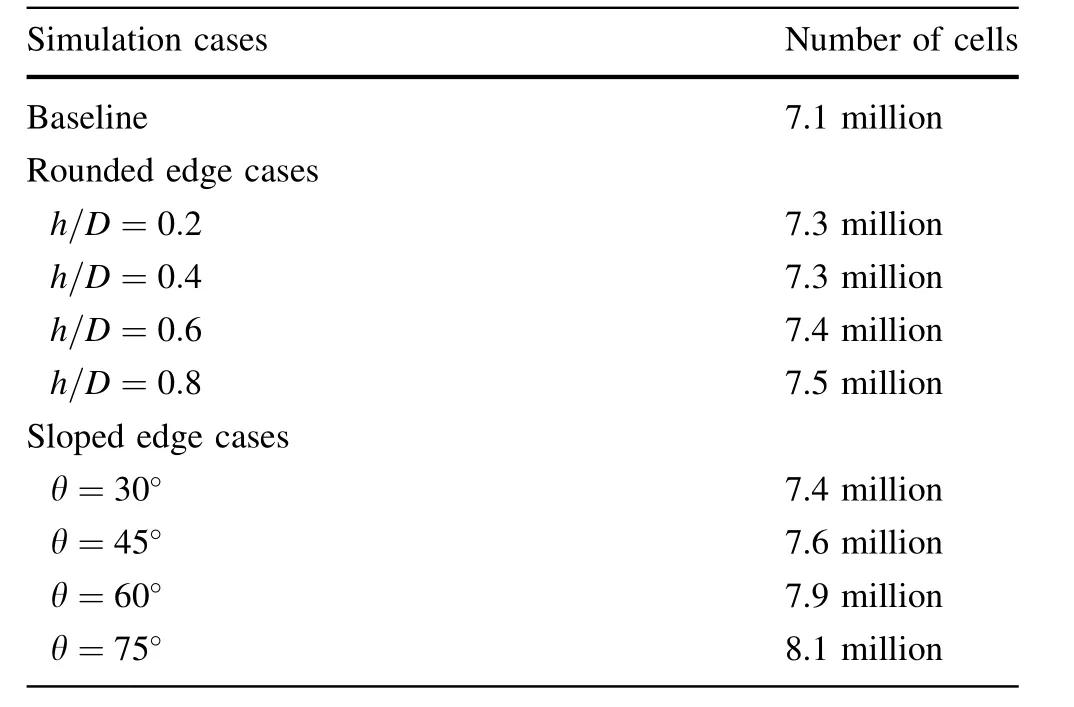
Table 2 The grid for each cases
3.3 Time-averaged velocity field
Figure 9 displays contours of the time-averaged streamwise velocity(Ux)with two-dimensional sectional streamlines at the mid-span plane.For the baseline cavity shown in Fig.9a,the incoming flow separates from the leading edge of the cavity and develops a shear layer,which impinges around x/L=0.6 on the cavity floor.This introduces a recirculation region behind the upstream wall of the cavity between x/L=0 and x/L=0.6.When the cavity edge is rounded,this recirculation region becomes smaller and the shear layer impingement point moves upstream. For h/D=0.2,the impingement point occurs at x/L=0.48.The point moves continuously closer to the upstream wall and reaches x/L=0.4 for h/D=0.8.A similar flow pattern can be seen in the sloped edge cases.By increasing the angle θ,the shear layer impingement point moves upstream and the recirculation region becomes smaller.However,the change is not as significant as in the rounded edge cases.Another recirculation occurs in the vicinity of the trailing edge.The flow separated from the cavity trailing edge reattaches on the cavity aft wall at x/L=1.1.This recirculation is eliminated for all rounded trailing edge cases,whereas it is only eliminated for sloped edge cases at large angles(θ=60°and 75°)and is reduced in size for the other sloping angles.The strong unsteady flow with recirculation zone can be used to determine potential noise source.Therefore,when the recirculation zone is reduced,the reduction of the noise may be archived.The cavity edge treatments reduce unsteady flow from the cavity,and the effect of these flow field changes on the far-field noise will be quantified in Sect.4.
4 Aeroacoustic results for the modified cavities
The radiated noise is predicted for two far-field receivers,located 2.5 m away from the centre of the cavity at the side and at the top.The far-field pressure sampling frequency was’125 kHz,and a Hanning window with 50%overlap was used to determine the spectra[27].All spectra are converted to full-scale frequencies and amplitudes according to the following equation[28]:

where f is the frequency,L(f)is the SPL at frequency f,D is a characteristic length of the model,r is the distance between the sound source and the observer,U∞is the flow speed,and n is the speed-dependent exponent of the sound power and is taken as n=5.8 for the current low Mach number cases [29]. The variables with subscript ‘m’represent the corresponding parameters of the scale model.The full-scale frequency f can be obtained from the following equation for the Strouhal number:

The spectra are presented in one-third octave bands.
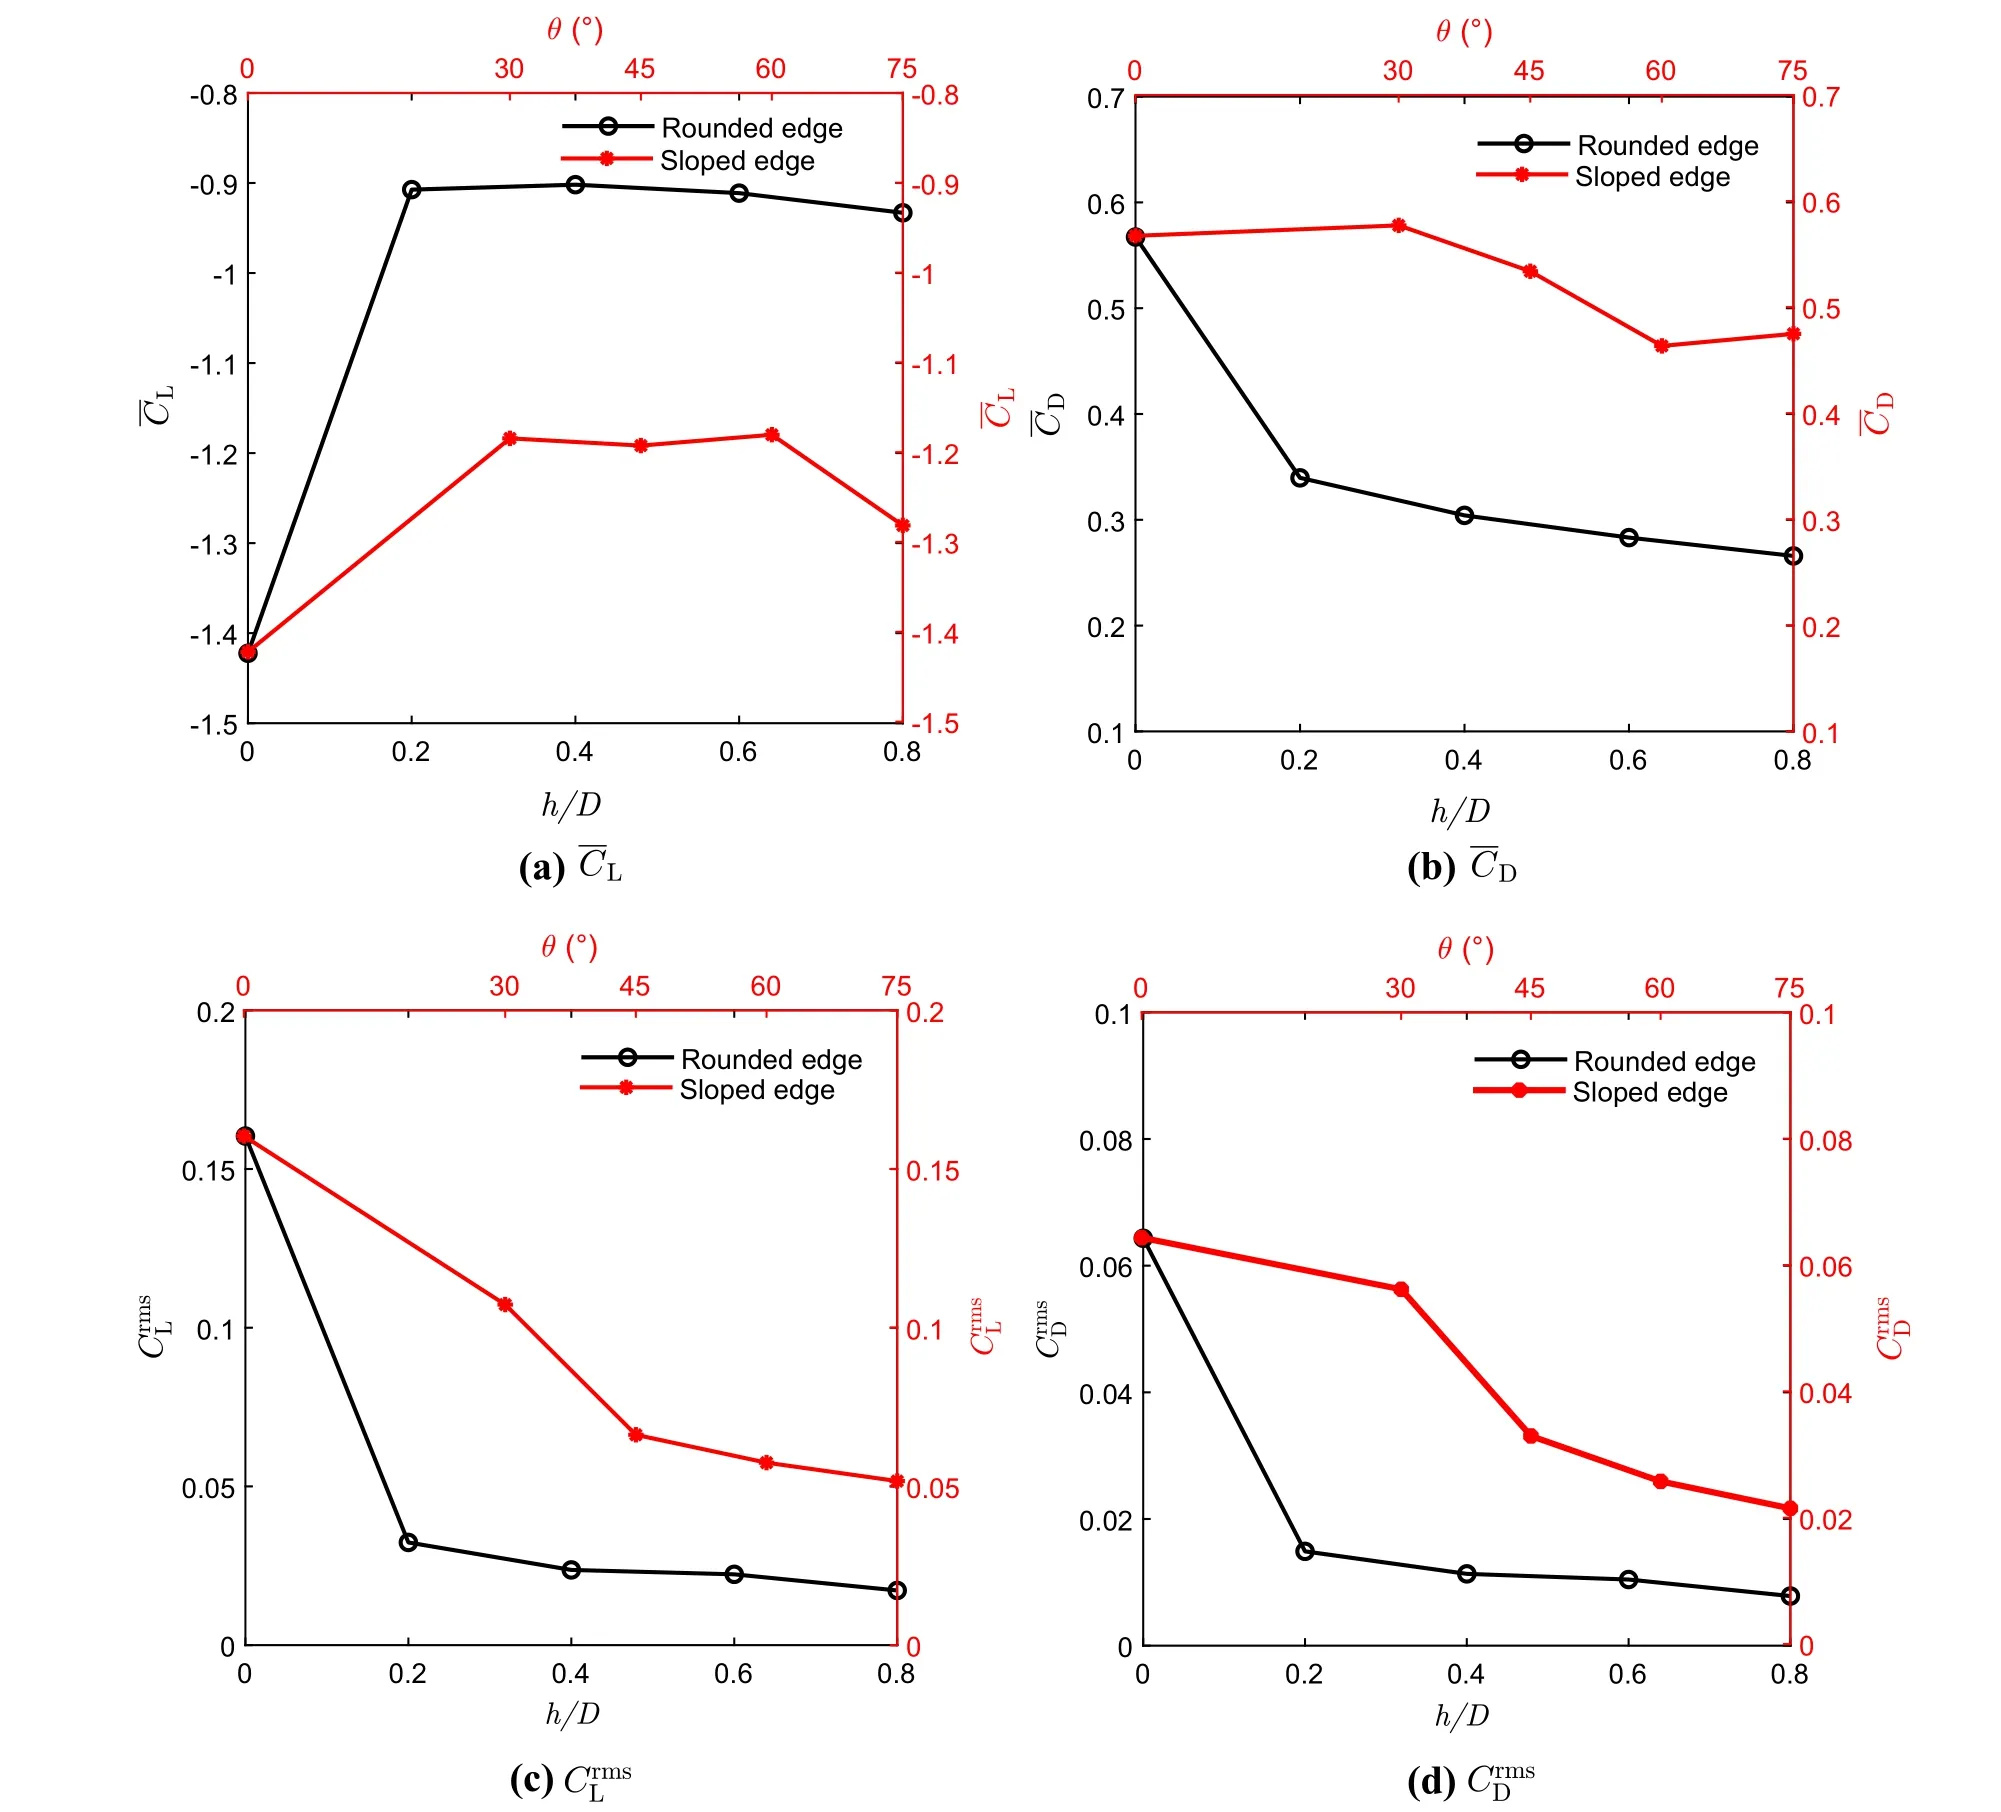
Fig.6 Force coefficients for different cavity edge treatment cases
The spectra of the radiated sound pressure from the cavity at the side receiver are plotted in Fig.10.There are no strong tonal components,which is expected for a classic closed cavity[13].By rounding the cavity edges,the SPLs are reduced in the low-frequency region below about 630 Hz,but they are unaffected at high frequency as shown in Fig.10a,b.Similarly,the spectra of the radiated noise from the sloped edge configurations become lower in the low-frequency region as the angle θ is increased.However,the spectra of the noise for θ=60°and 75°are similar.These reductions are not as significant as for the rounded edge cavity configurations.The variation of spectra at the top receiver is similar,therefore,not shown in here.
The overall SPLs(OASPLs),calculated by integrating the spectra over frequency up to 2000 Hz,are given in Table 3.Compared with the noise levels for the baseline case,the case with rounded edges with h/D=0.8 shows a reduction of 15.2 dB for the receiver at the side and of 12 dB for the receiver at the top.The noise levels for the sloped edge with θ=75°are reduced by approximately 5.3 dB at the side and 7.2 dB at the top compared with the baseline case.The rounded cavity edges with h/D=0.8 have the largest effect on the noise from the cavity.
5 Effect of the cavity geometry on pantograph noise
5.1 Geometry
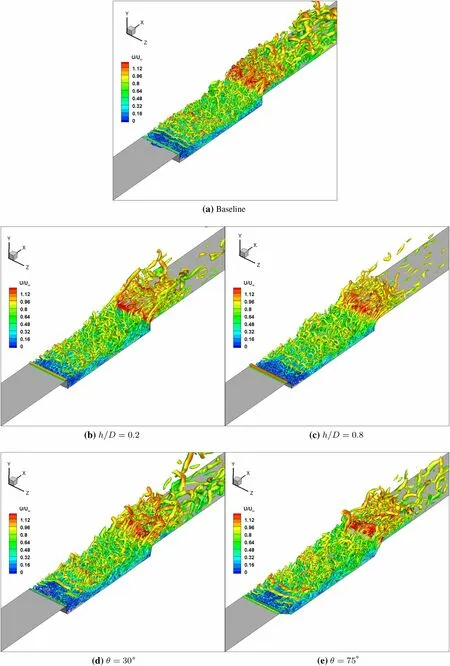
Fig.7 Flow structure demonstrated by iso-surface of Q-criterion Qnorm=2.5
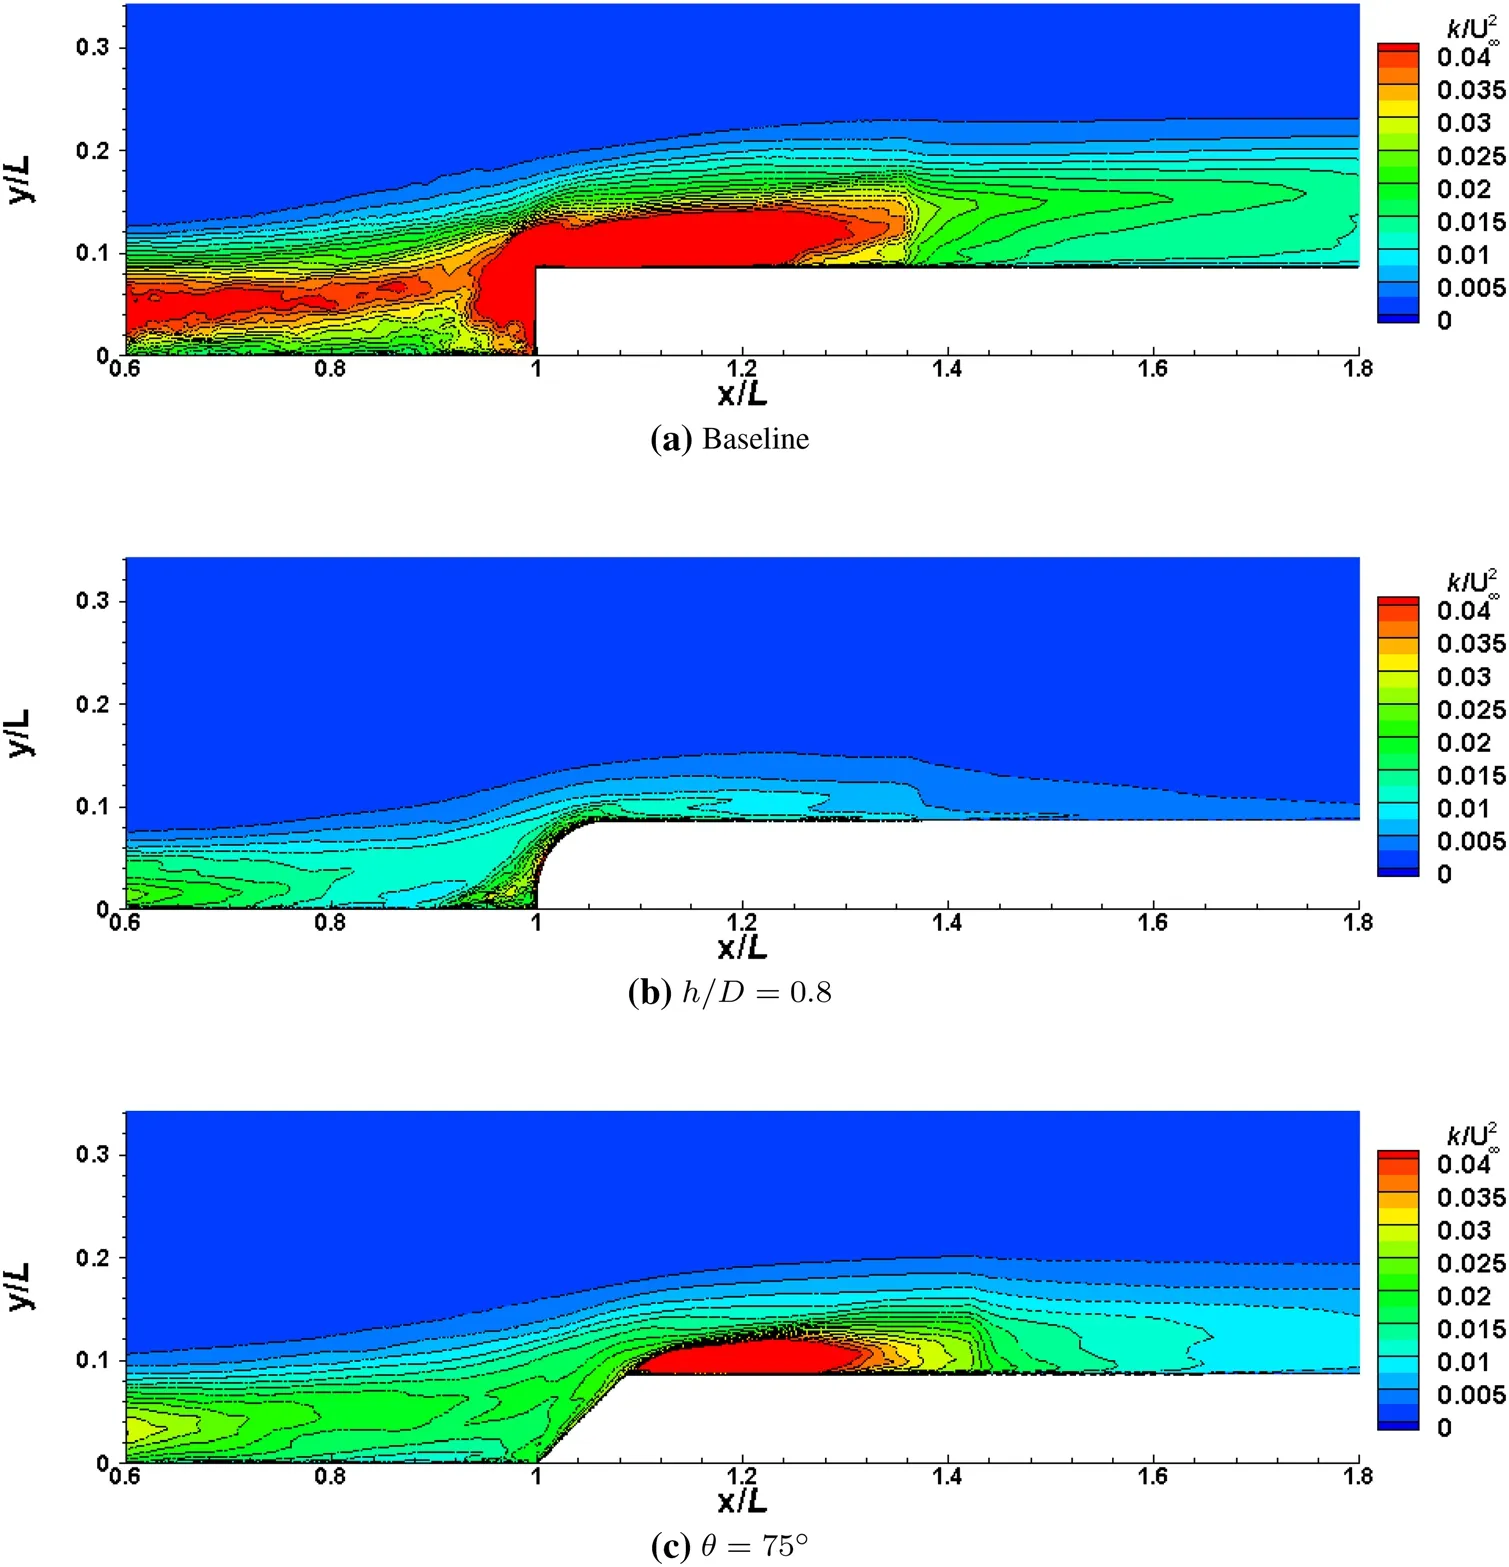
Fig.8 Comparison of turbulence kinetic energy for the baseline(a),h/D=0.8(b)and θ=75°(c)in the cavity trailing edge region
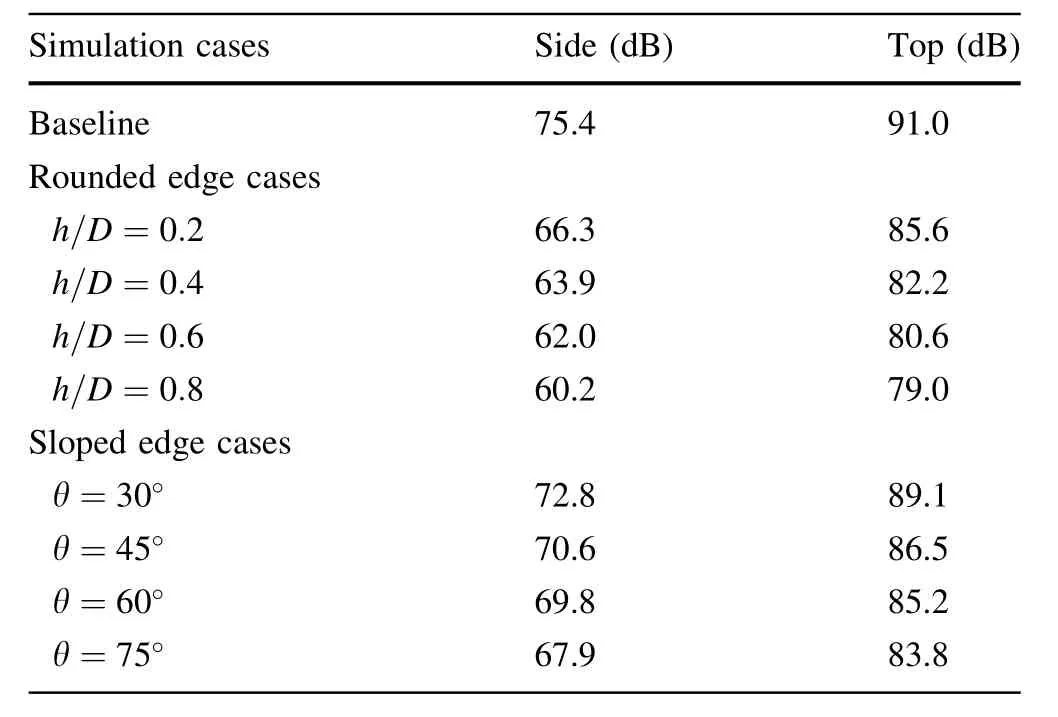
Table 3 OASPL at the side and the top receiver positions
The influence of the cavity edge treatments on the flow and noise of the pantographs is investigated here.In the previous section,the rounded case with h/D=0.8 shows the lowest level of the noise from the cavity.This modification for the cavity is therefore chosen to investigate effects of the modified cavity on pantograph aerodynamic noise.Two 1/10 scale DSA 350 pantographs(one raised and one folded)are installed inside the modified cavity.Two cavity and these cases(cases 3 and 4)are simulated considering different train running directions and compared with the cases(cases 1 and 2)of the same pantographs installed in a rectangular cavity.Furthermore,the effects of the train running direction are investigated.The freestream direction is set as the positive x-direction for cases 1 and 3 and as the negative x-direction for cases 2 and 4, as shown in Fig.11a.In this study,it is assumed that the pantographs and the recess are installed on the top of the leading coach and the effect of leading coach nose on boundary layer is negligible[14].Furthermore,as thin boundary layers occur on the leading coach roof,the flow does not influence the flow speed around upper part of raised pantograph including panhead[15].The pantograph shown in Fig.11b is simplified by keeping all the large and medium parts and only removing the small parts,such as straps and springs as given in detail in Table 4.
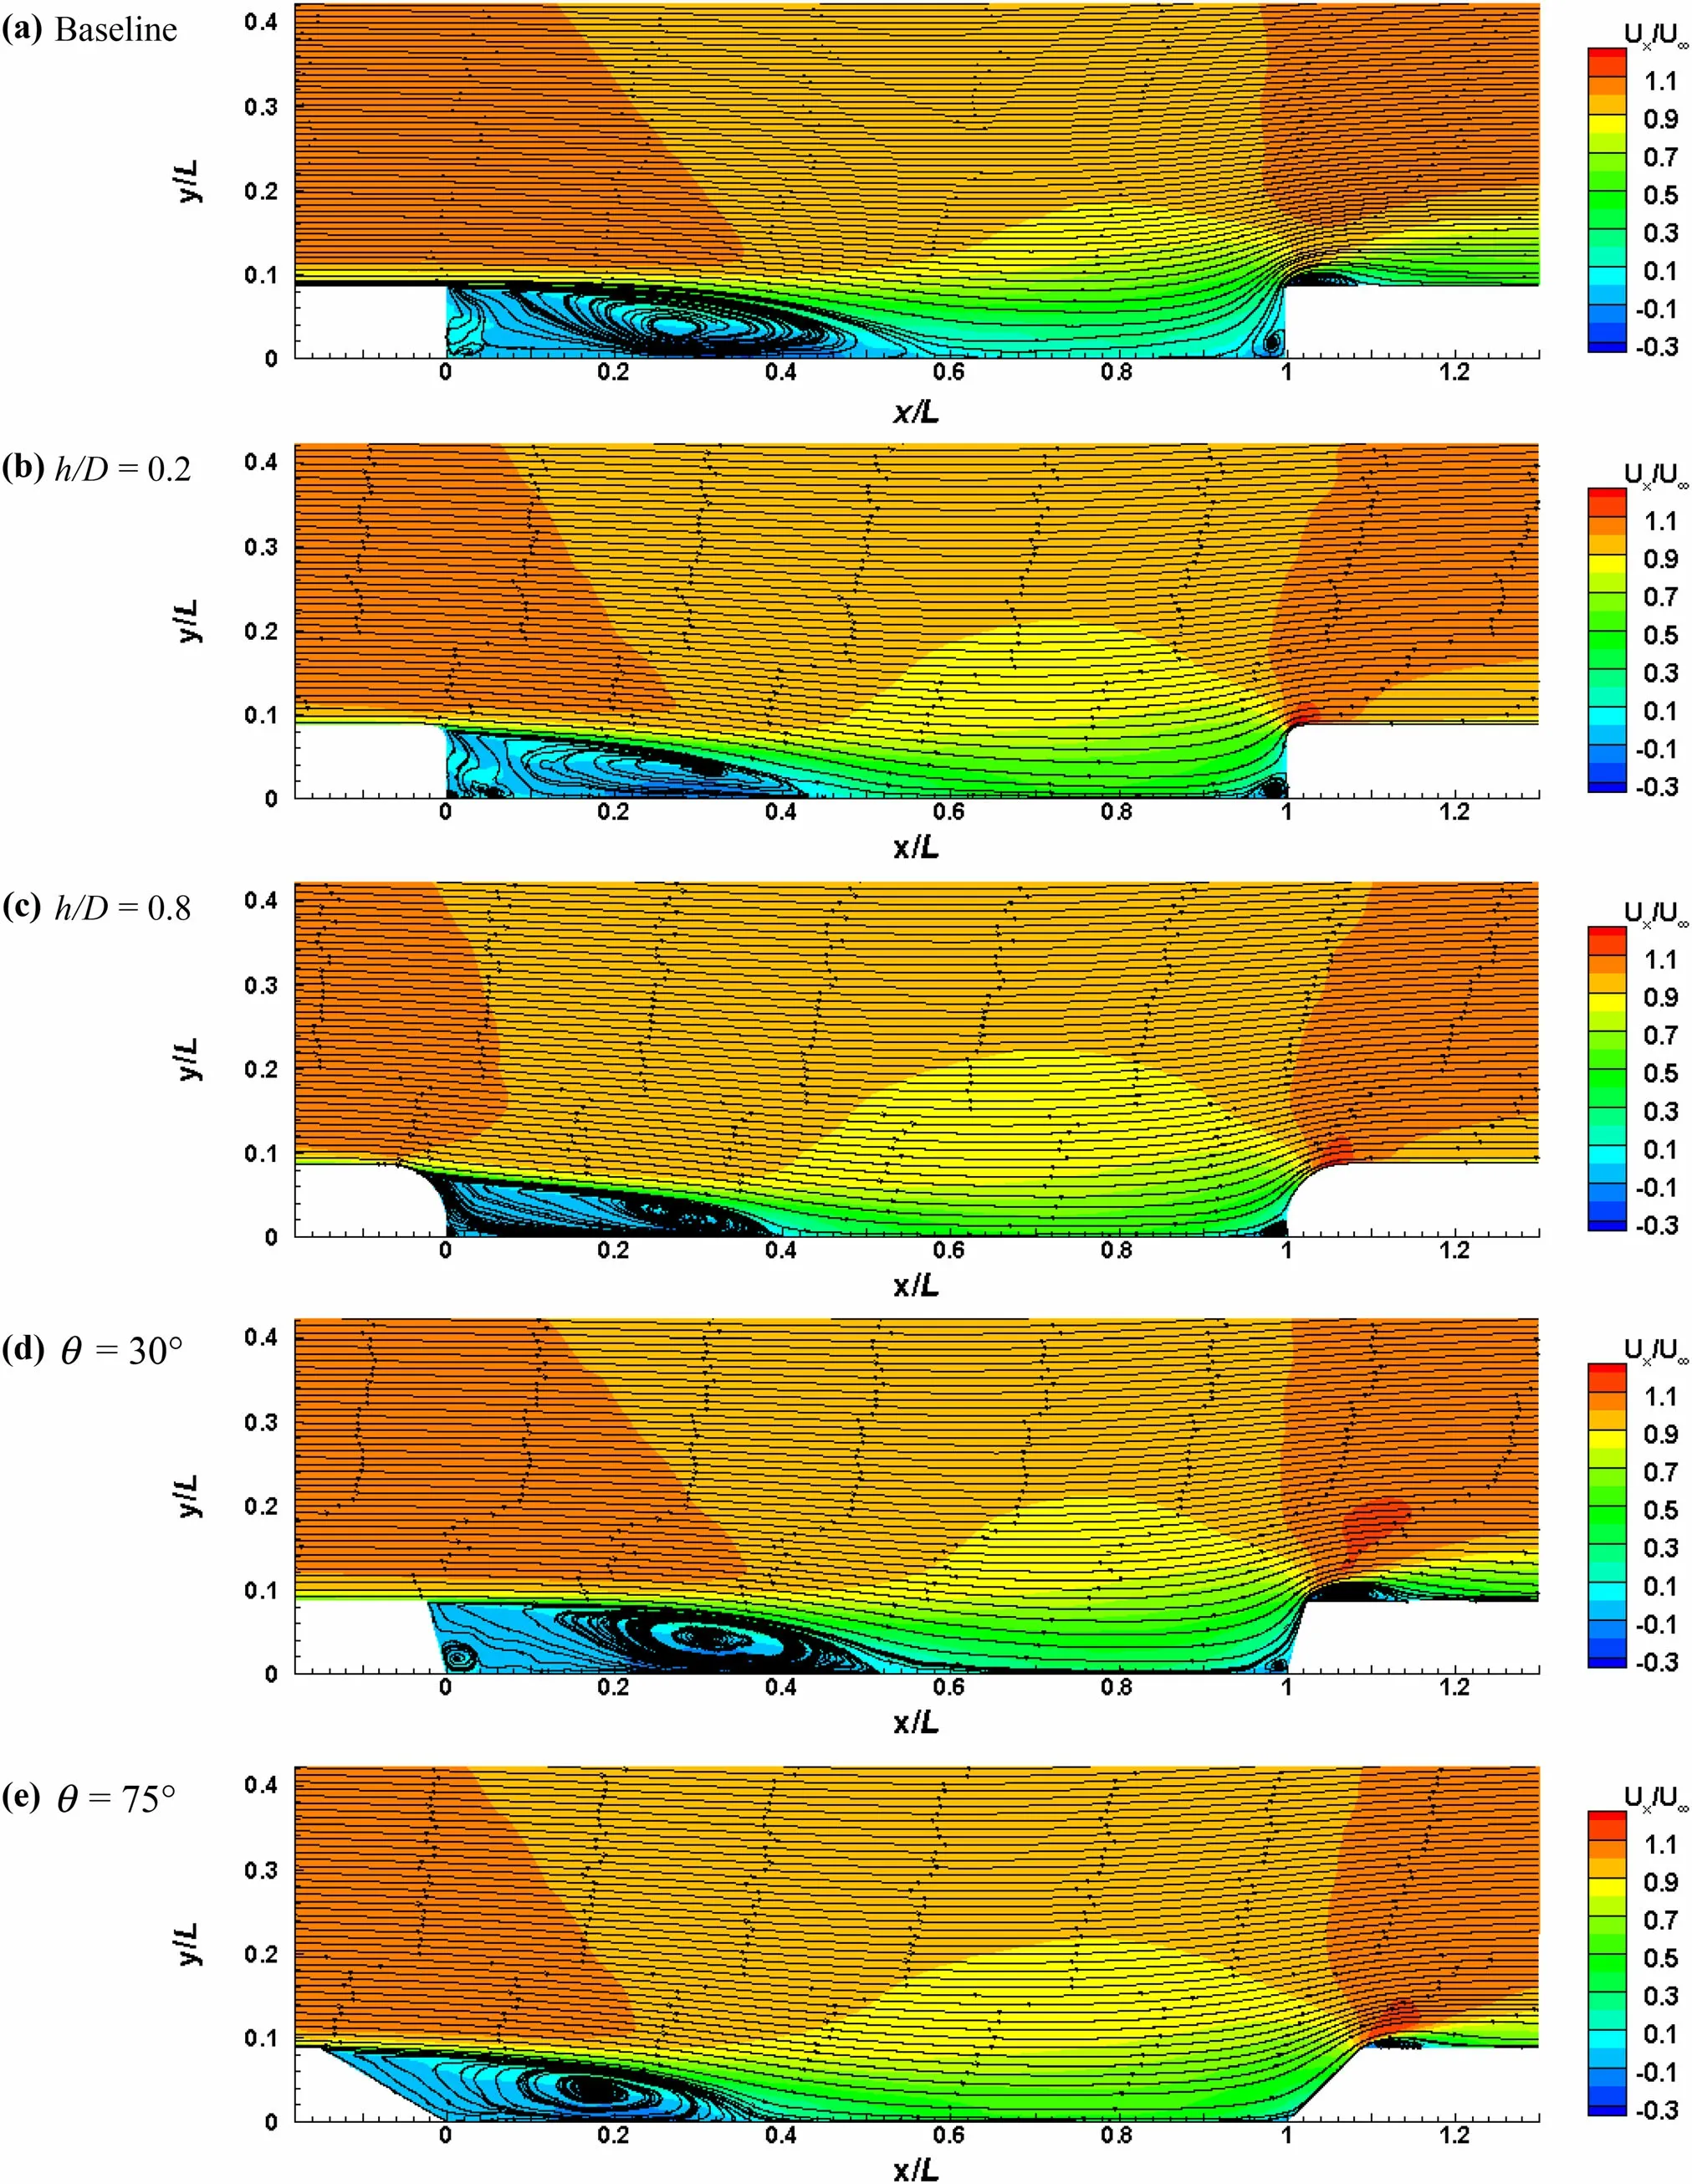
Fig.9 Mean streamline with time-averaged velocity contours
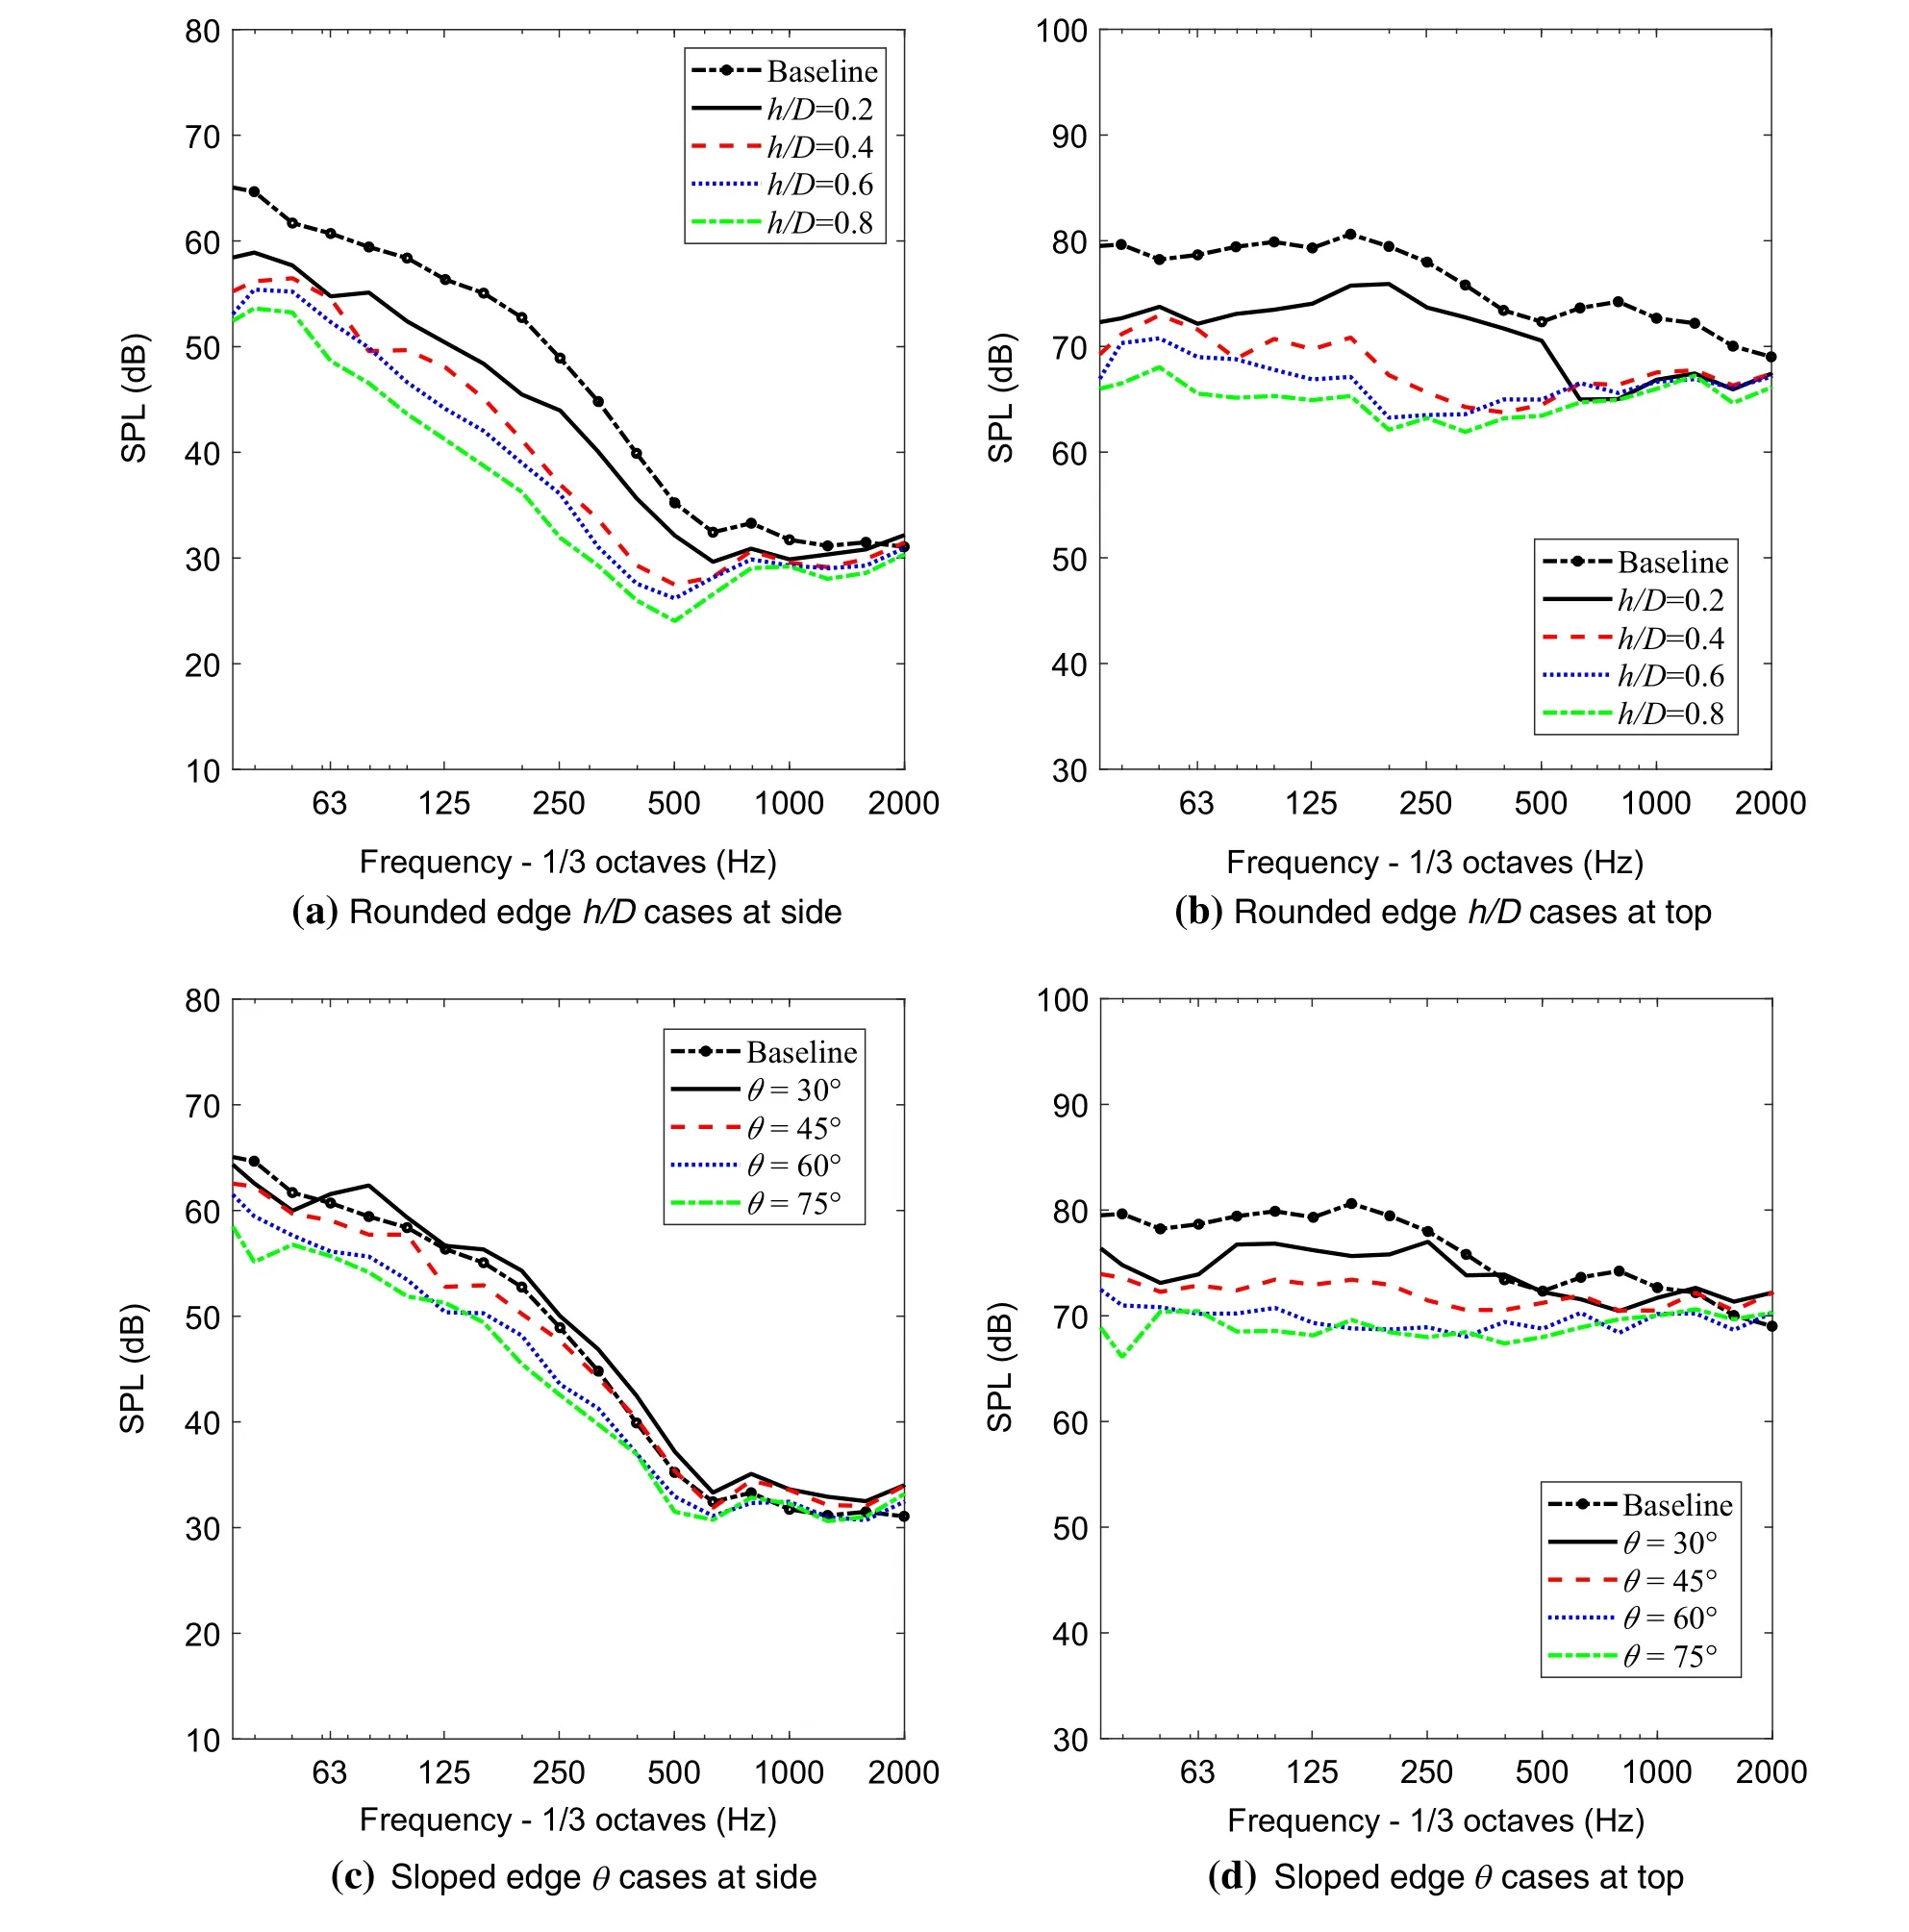
Fig.10 Sound pressure levels at the side receiver
5.2 Numerical test section
The computational domain size and boundary conditions are identical with the previous cavity cases as shown in Fig.4.A hexa-dominated mesh is also used for the pantographs. Different cell sizes are specified for each refinement zone.The panhead regions are refined with a minimum cell size of 0.4 mm,and several refinement zones are used for the pantograph components and wake regions.The total number of cells used for each case is listed in Table 5.It is verified thatis less than 1 on all surfaces.As before,a non-dimensional time step UΔt/D=0.0095 is used.
5.3 Aerodynamic results
5.3.1 Time-averaged velocity field
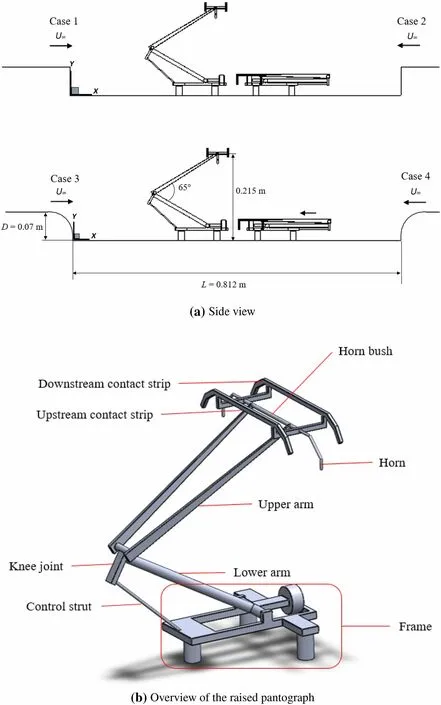
Fig.11 Description of the geometry

Table 4 List of retained and omitted parts

Table 5 The grid for each cases
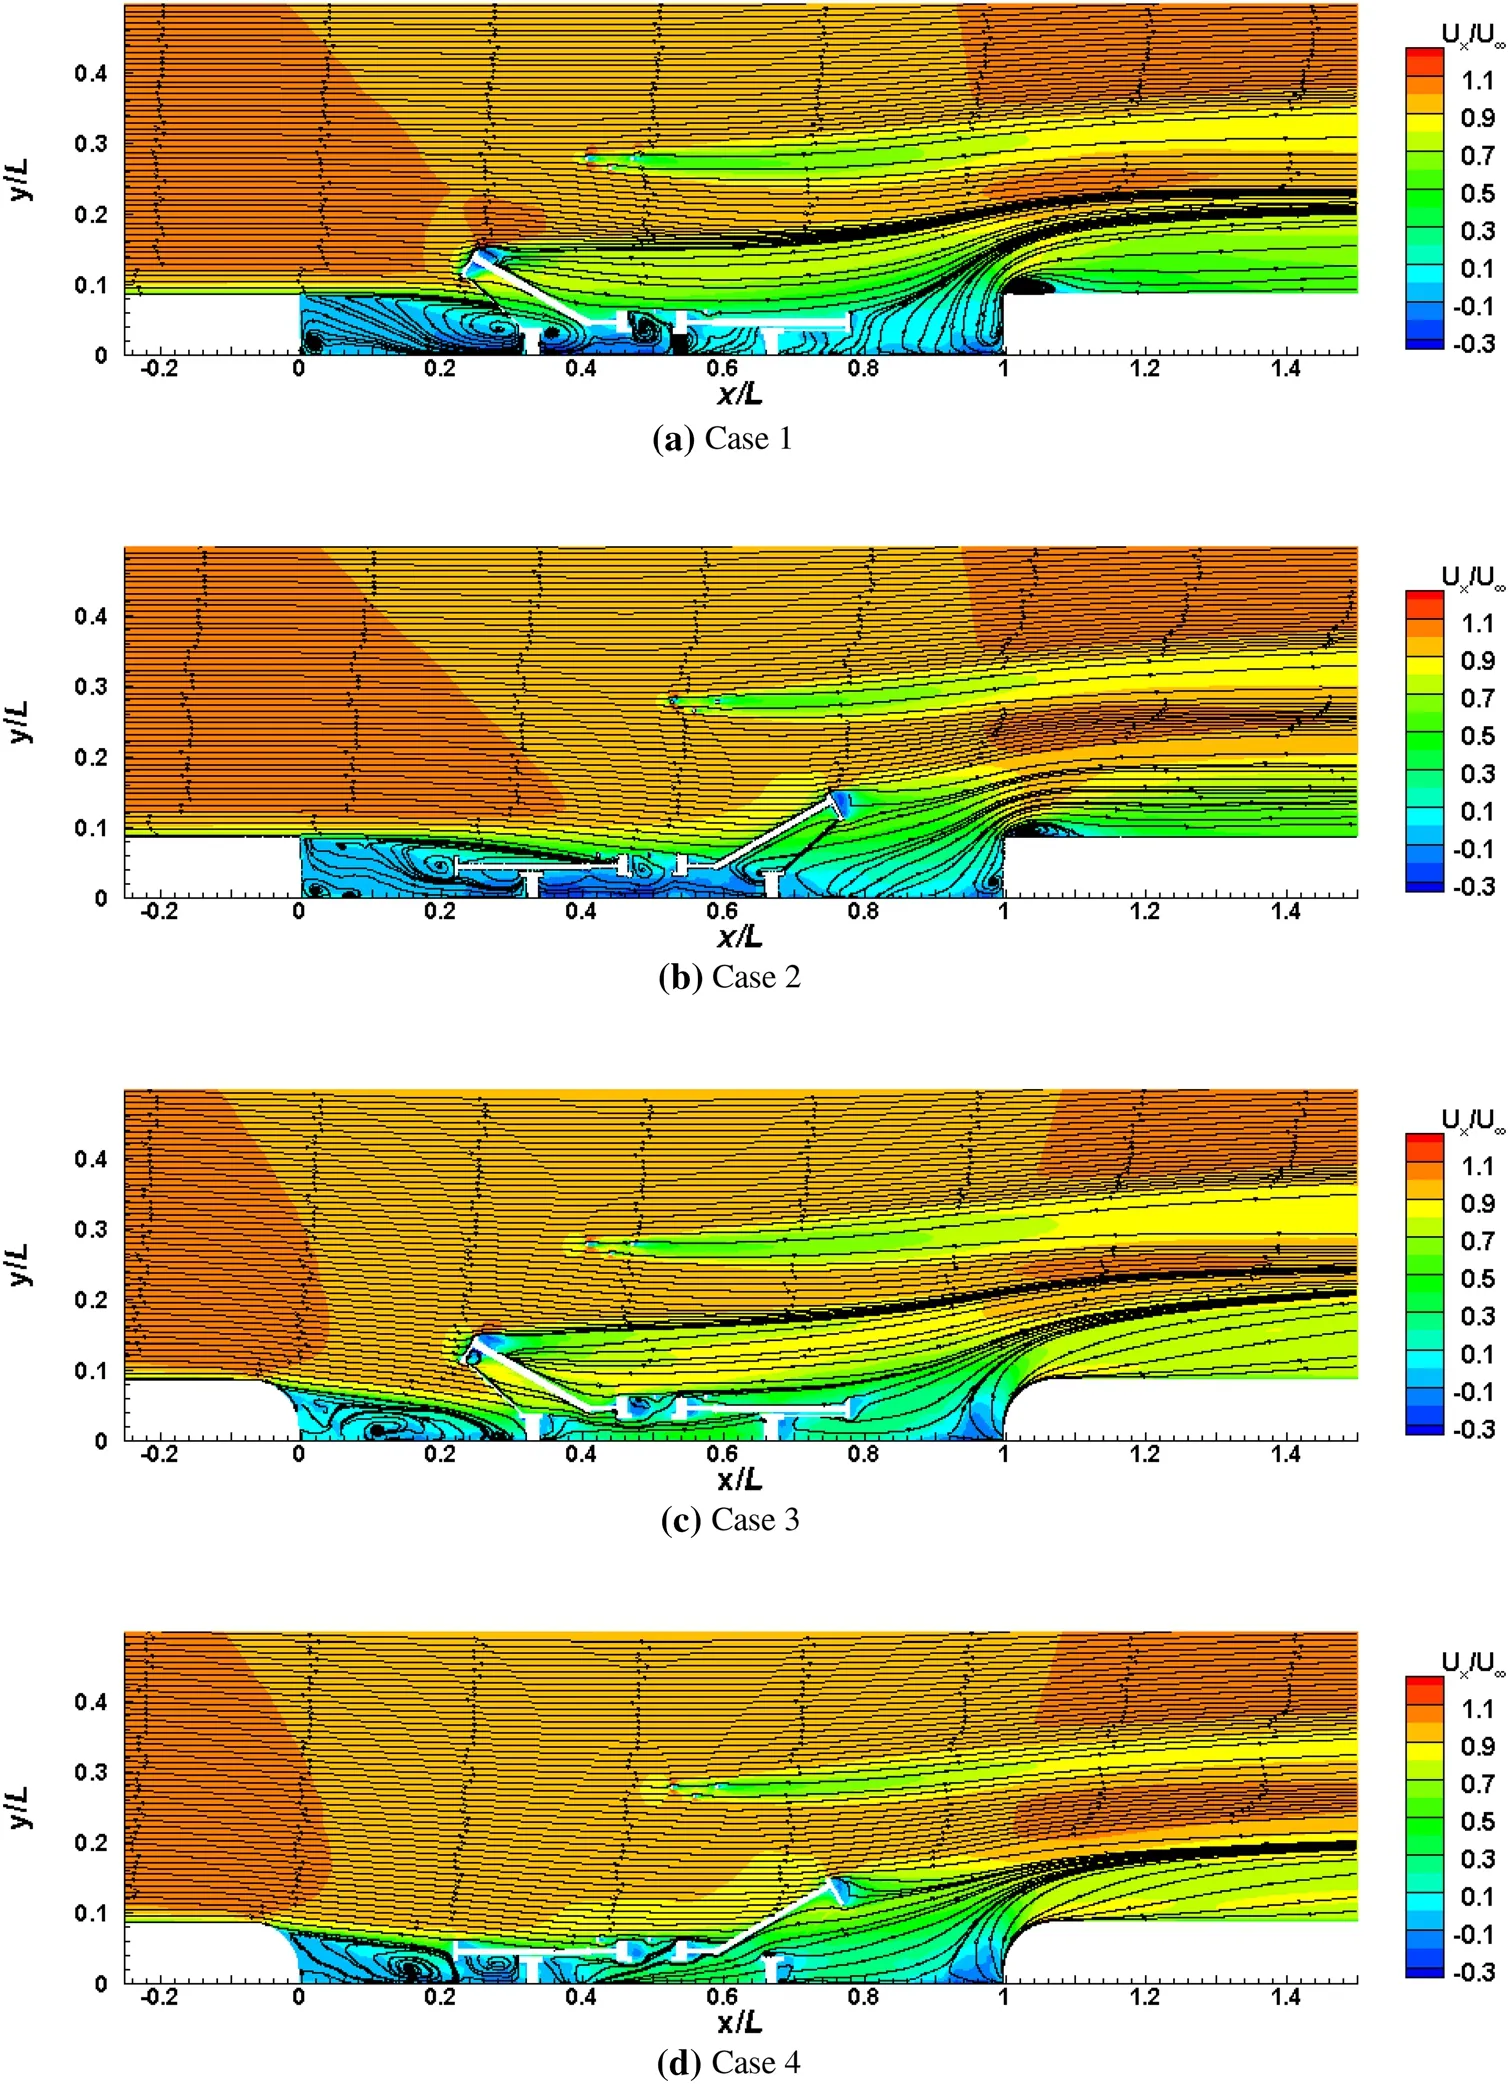
Fig.12 Mean streamline with time-averaged velocity contours
Figure 12 displays contours of the mean streamwise velocity at the mid-span plane(z/W=0.5)together with two-dimensional in-plane streamlines.For the two cases in which the cavity edges are rounded(cases 3 and 4),the incoming flow follows and attaches initially to the rounded edge surface before separating at θ=30°,whereas the flow separates immediately at the leading edge for cases 1 and 2.Due to the delayed separation in the rounded edge cases,the separated shear layer reattaches earlier to the cavity floor and results in smaller recirculation regions and only interacts with pantograph components in the foot part of the cavity.Variation of the flow separation changes the behaviour of the separated shear layer and its interaction with the pantographs and the cavity. The shear layer impinges onto the front part of the cavity(x/L=0.3)and interacts with the front foot of the raised pantograph in case 3 and the joint of the folded pantograph in case 4.However,the shear layer impinges at the middle of the cavity floor and interacts with more parts of the pantographs in both cases 1 and 2.The separated flow impinges on most of the lower parts of the raised pantograph including the foot,the frame and the control strut in case 1.In case 2,most of the folded pantograph panhead is within the shear layer impingement region.These different impingement regions may generate different features of the surface pressure fluctuations of the pantographs.
Figure 13 displays the profiles of the time-averaged streamwise velocity Uxat different streamwise and spanwise locations for cases 2 and 4 with pantographs.The lines at x/L=0.52 are located just before the upstream contact strip of the raised pantograph,and the lines at x/L=0.54 are just in front of the horn of the pantograph.
The profiles in cases 2 and 4 are similar for all locations above the cavity region(y/D=1-4);however for case 4,the flow speed in this region is approximately 3%lower than that for case 2 at x/L=0.26 and x/L=0.34.For case 4,the flow speed outside the cavity region is generally smaller than that for case 2,whereas with rounded cavity edges the flow speed is higher in the cavity region than for the rectangular cavity.This means that the rounded cavity edge reduces the flow speed around the upper parts of the raised pantograph(the upper arms and the panhead),but increases the flow velocity around the lower parts of the raised pantograph and the folded pantograph.
At the locations just ahead of the panhead(x/L=0.52)and the horn of the raised pantograph(x/L=0.54),the values of Uxbetween y/D=3 and 3.5 in case 4 are about 4%lower than for case 2.The effect of the rounded cavity edge on the flow upstream of both the raised and folded pantographs will change the levels of the radiated noise from the pantographs,compared with cases 1 and 2.This will be discussed in more detail in the far-field results section.
5.4 Aeroacoustic results of the modified cavity with pantographs
5.4.1 Pantograph far-field validation
To validate the far-field acoustic pressure prediction,simulations were performed for a raised DSA 350 pantograph installed on a flat wall,and the obtained far-field sound pressure spectra are compared with measurements from a wind tunnel for a full-scale DSA350 pantograph[29].A velocity inlet is applied at the inflow.The simulation is performed for a flow speed of 83.3 m/s(300 km/h).A hexa-dominated mesh generated with several refinement zones is used for all cases.For the purpose of a mesh dependence study for the pantograph,three meshes(coarse,medium and fine)were generated with different mesh densities and mesh sizes.Thirty-eight refinement regions were used for the pantograph.All refinement regions had a surface growth rate of 1.1.Different cell sizes are applied for each refinement zone as shown in Fig.14b,c for the fine mesh.Furthermore,14-30 prism layers were used to resolve the boundary layer near solid surfaces.The nondimensional wall distanceis smaller than 1.0.A nondimensional time step UΔt/H=0.00272 is used,where H(0.245 m)is the height of the pantograph,to ensure that the CFL number is less than 1 for simulations.
Radiated noise at a receiver 5 m(at full scale)from the centre of the panhead at a position normal to the flow direction at the side of the pantograph,the same location as measured by Lo¨lgen[9].The sampling frequency was 125 kHz at 1/10 scale.The spectra are calculated by segmental average using a Hanning window with 50%overlap[27].Results from the 1/10 scale for the current numerical simulations are converted to full scale using the aeroacoustics similarity law[28]as given by Eq.(1).
Figure 15 shows a comparison between experimental and numerical far-field pressure spectra in 1/3 octave bands converted from the narrow band spectra from the simulations.Although numerical results for all cases are slightly over-predicted in the low-frequency region, excellent agreement from the medium and fine meshes is seen up to 800 Hz and in particular the first peak at 315 Hz,produced by the contact strips,and the second peak at 630 Hz,generated by the horns,are in good agreement with the experimental data.Numerical results at frequencies above 630 Hz are lower than the measurement.This is because the pantograph geometry in the numerical study has been simplified by removing smaller components such as straps and springs,which generate the high-frequency peaks,the numerical results do not match the measurements at high frequencies.From this mesh dependence study,the medium mesh set-up is selected as the basis for generating meshes for the pantographs.
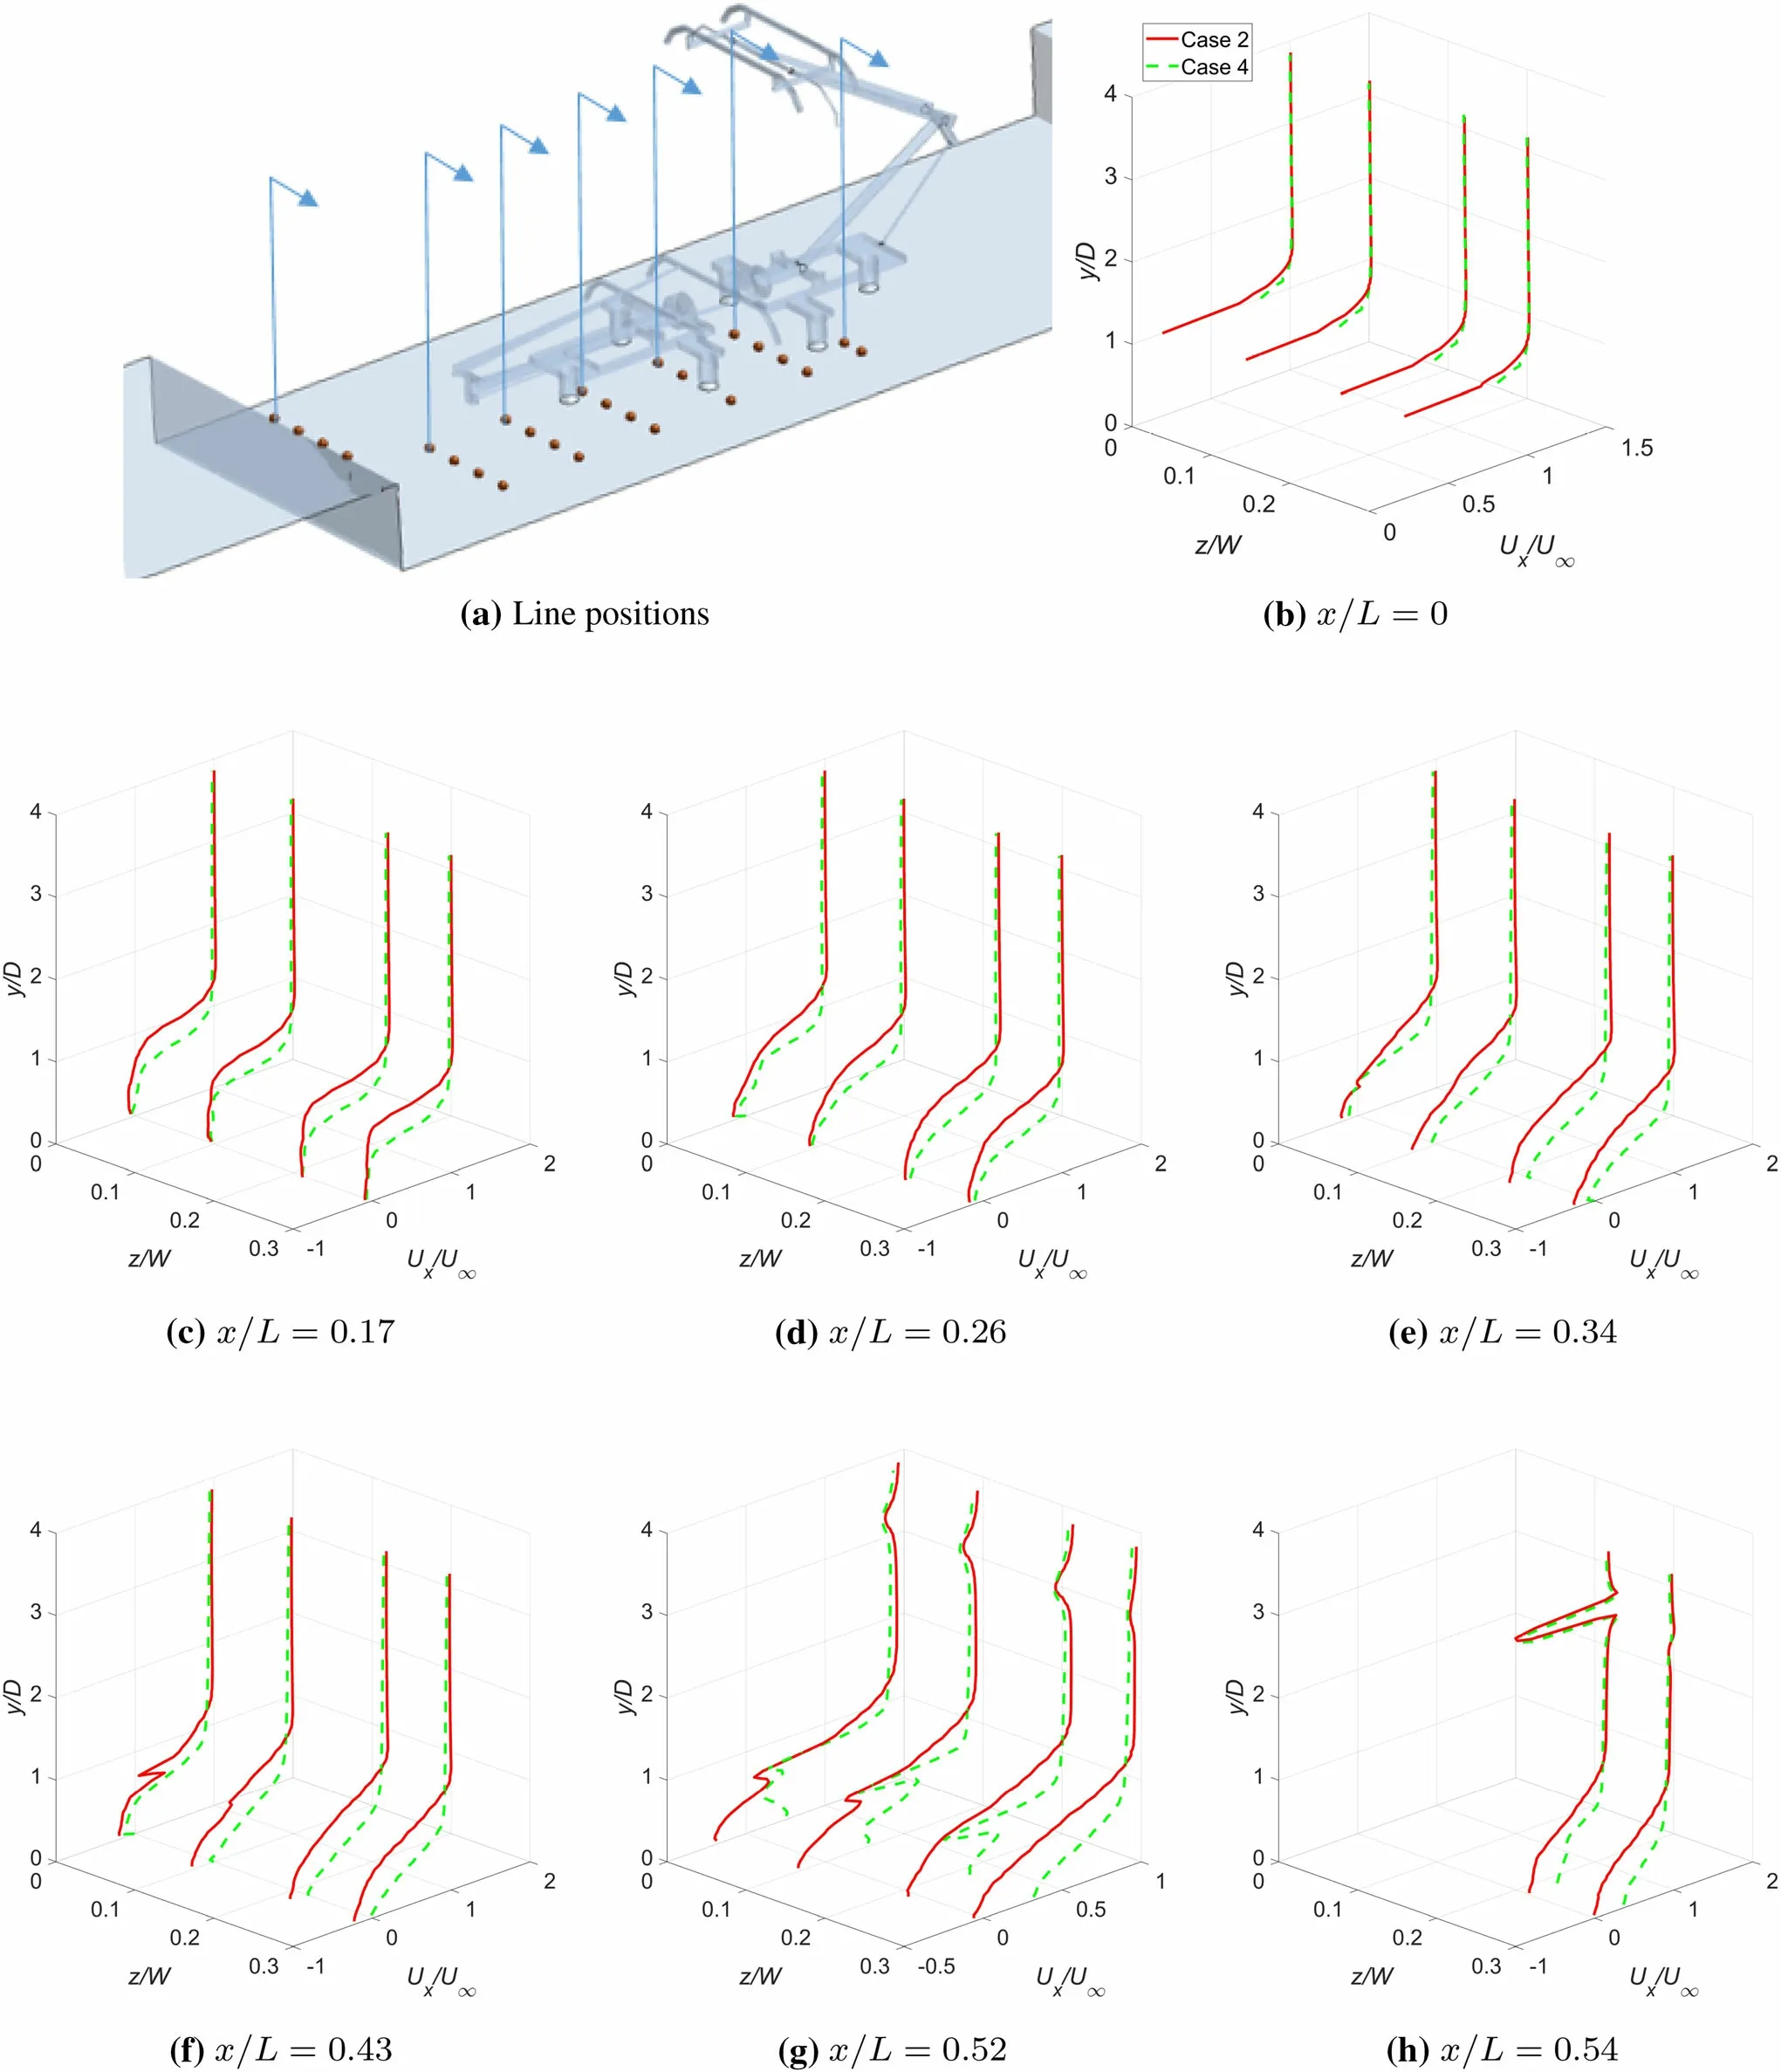
Fig.13 Time-averaged streamwise velocity Ux from case 2 with rectangular cavity and case 4 with rounded cavity
5.4.2 Sound pressure level
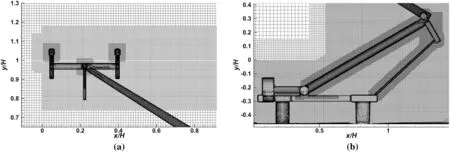
Fig.14 a Mesh around the raised pantograph frame and b mesh around the panhead
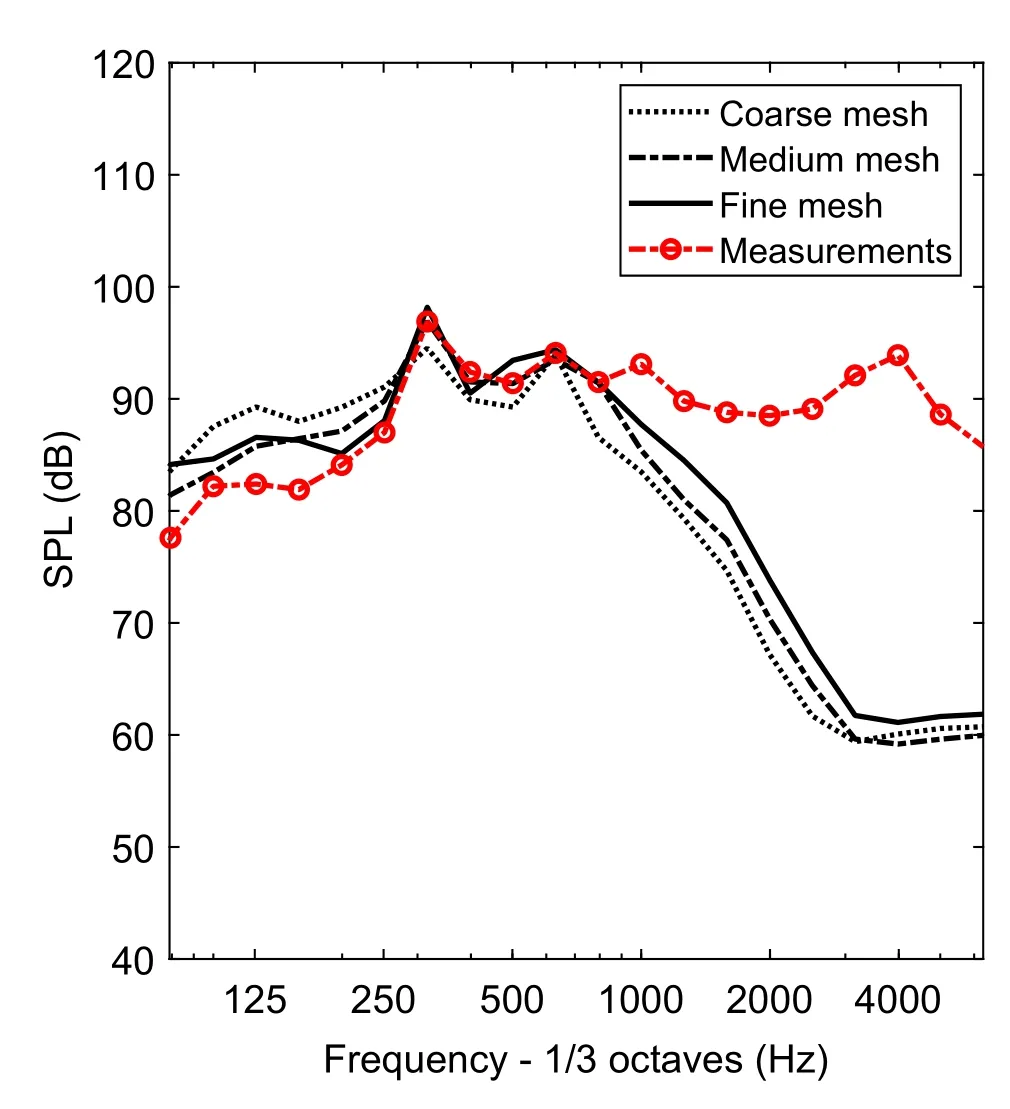
Fig.15 SPL comparison of experimental[29]and numerical results
Radiated sound pressure is calculated for the whole system,and also by considering different sources as different components only at two far-field receivers,one directly to the side and one directly above the cavity at a distance of 2.5 m(corresponding to 25 m at full scale)from the centre of the cavity floor.The same method as in Sect.4 is used for sampling the sound pressure and calculating the spectra.The results given in this section do not consider reflections from the train roof,and only direct sound pressure is accounted.The results are converted to full scale from the 1/10 scale model for the current simulation,using Eqs.(1)and(2).
The spectra of the radiated sound pressure at the side receiver from the whole system,the raised pantograph,the folded pantograph and only the cavity walls,including the aft cavity wall,are shown in Fig.16.In the low-frequency region below 160 Hz,there is a large difference between the rectangular cavity(cases 1 and 2)and the rounded cavity(cases 3 and 4)edges in the whole system noise.This is because the rounded cavity edge configuration reduces the noise radiated from the cavity at low frequency as shown in Fig.16d.Figure 16b shows the noise radiated from the raised pantograph where two peaks at 250 Hz and 500 Hz are seen for all cases.At the first peak generated by the contact strip,the highest level happens in case 1(80 dB)and the lowest level in case 4(78 dB).The difference of the level between cases 1 and 4 at the second peak(500 Hz)is approximately 2.5 dB.The contribution from the raised pantograph dominates the overall sound spectrum.
The contributions from the folded pantograph(Fig.16c)are generally lower with no strong tonal components.As discussed in Sect.3.3,for the rounded edges,the flow velocity within the cavity region is higher than for cases 1 and 2 and consequently the levels of the radiated noise from the folded pantograph are approximately 7 dB higher for cases 1 and 2.Figure 16d shows the noise radiated from the cavity walls.In the frequency region below 500 Hz,the differences between the rounded cavity cases and the baseline cases are significant(around 12 dB).
Figure 17 shows the corresponding spectra of the radiated sound pressure at the top receiver position.In general,the SPL at this location is much higher than that at the side location,especially for the sound radiated by the cavity.Furthermore,the differences between the noise radiated when the cavity edges are rounded(cases 3 and 4)and without it are much less,compared with the levels at the side position.The OASPLs for total and each components,calculated by integrating the spectra over frequency up to 2500 Hz,are given in Table 6.It can be seen that at side position,the total OASPLs from cases 3 and 4 are 0.5 dB lower than that from cases 1 and 2.At the top position,a total reduction of 1.7 dB is achieved with the rounded edge treatments.It is noted that the noise reduction in practice could be smaller than the results from the simulations in this study since the results above 630 Hz are underpredicted due to the simplification of the geometry of the pantographs.To obtain sound power level(SWL),a total of 244 far-field receivers are used in the model,located on a sphere with radius 2.5 m(corresponding to a radius of 25 m at full scale)from the middle of the cavity floor.Receivers are also placed symmetrically below the cavity wall to consider reflections from the train roof.The direct and reflected sound pressure are summed in the time domain to account for their phase;the latter is taken from the direct radiated sound to the mirrored receiver.The sound power can be obtained from
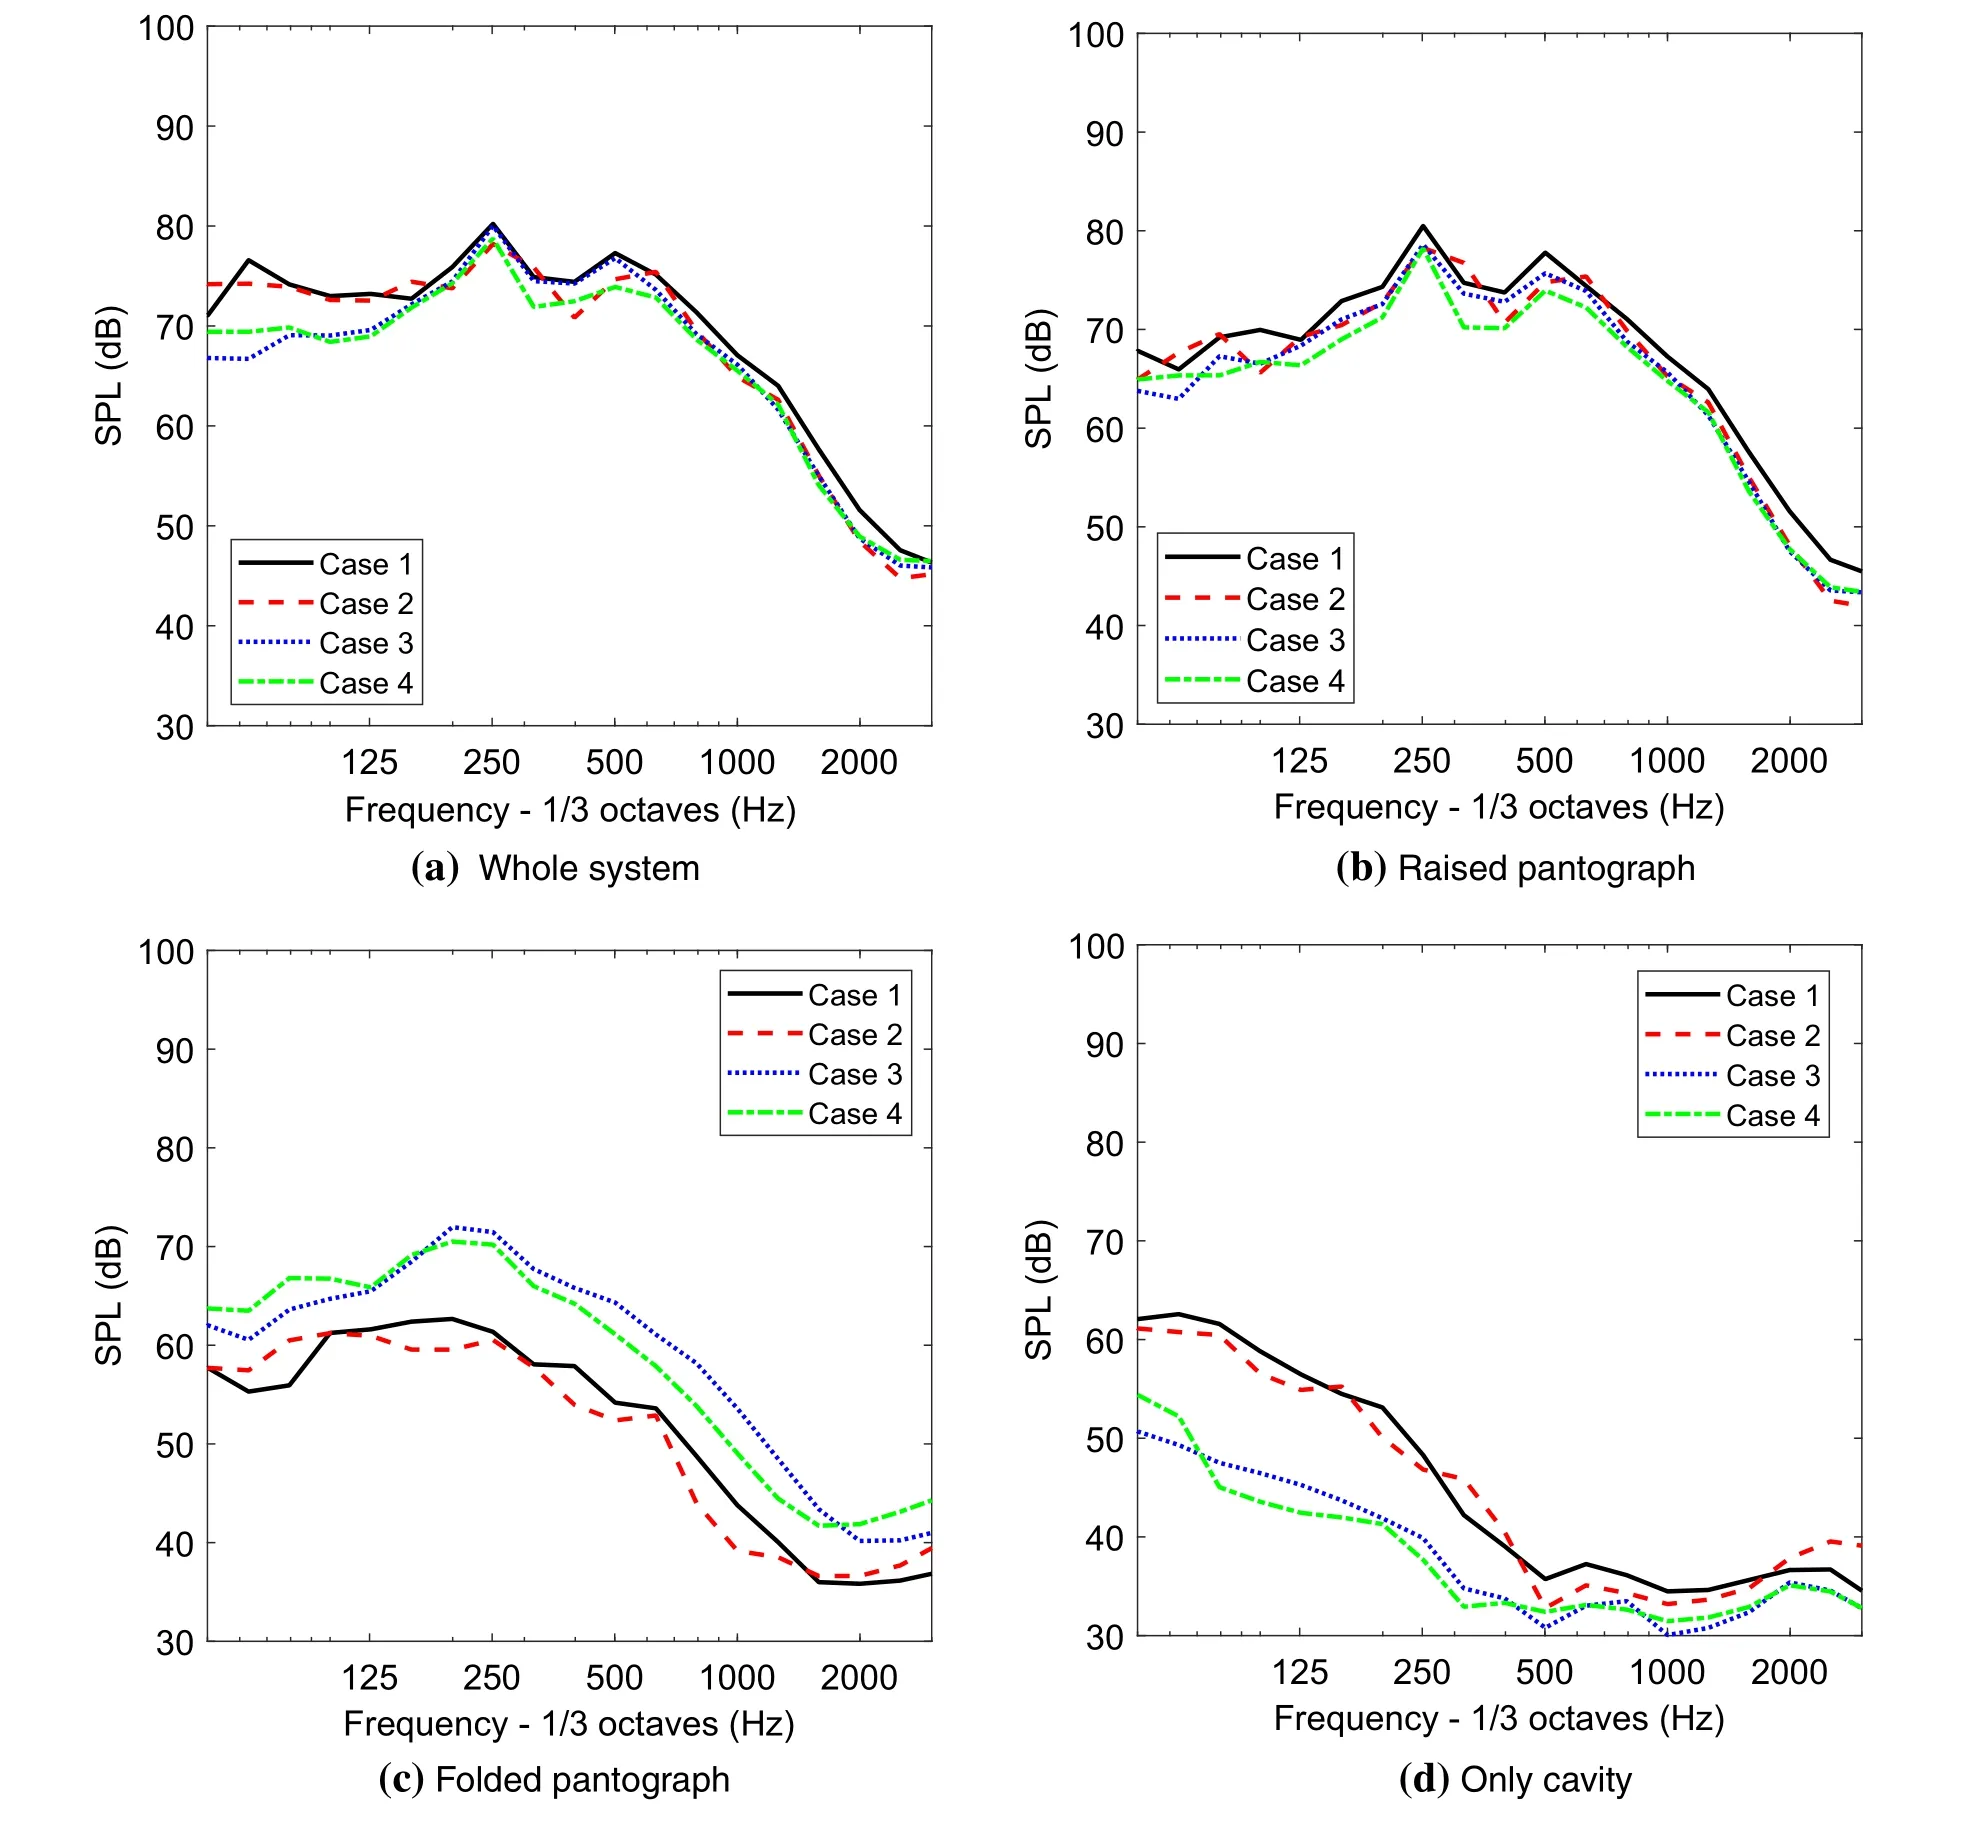
Fig.16 Sound pressure levels at side receiver position

where prmsis the rms acoustic pressure,ρ is the density,c is sound speed,and S is the surface area of the hemisphere.
The sound power levels for the four cases are listed in Table 7.The sound powers from the rounded cavity edges configuration(cases 3 and 4)are around 2 dB lower than the cases without the treatment.This is due to mainly reduction of the noise radiated from the cavity wall by rounding the cavity edges.
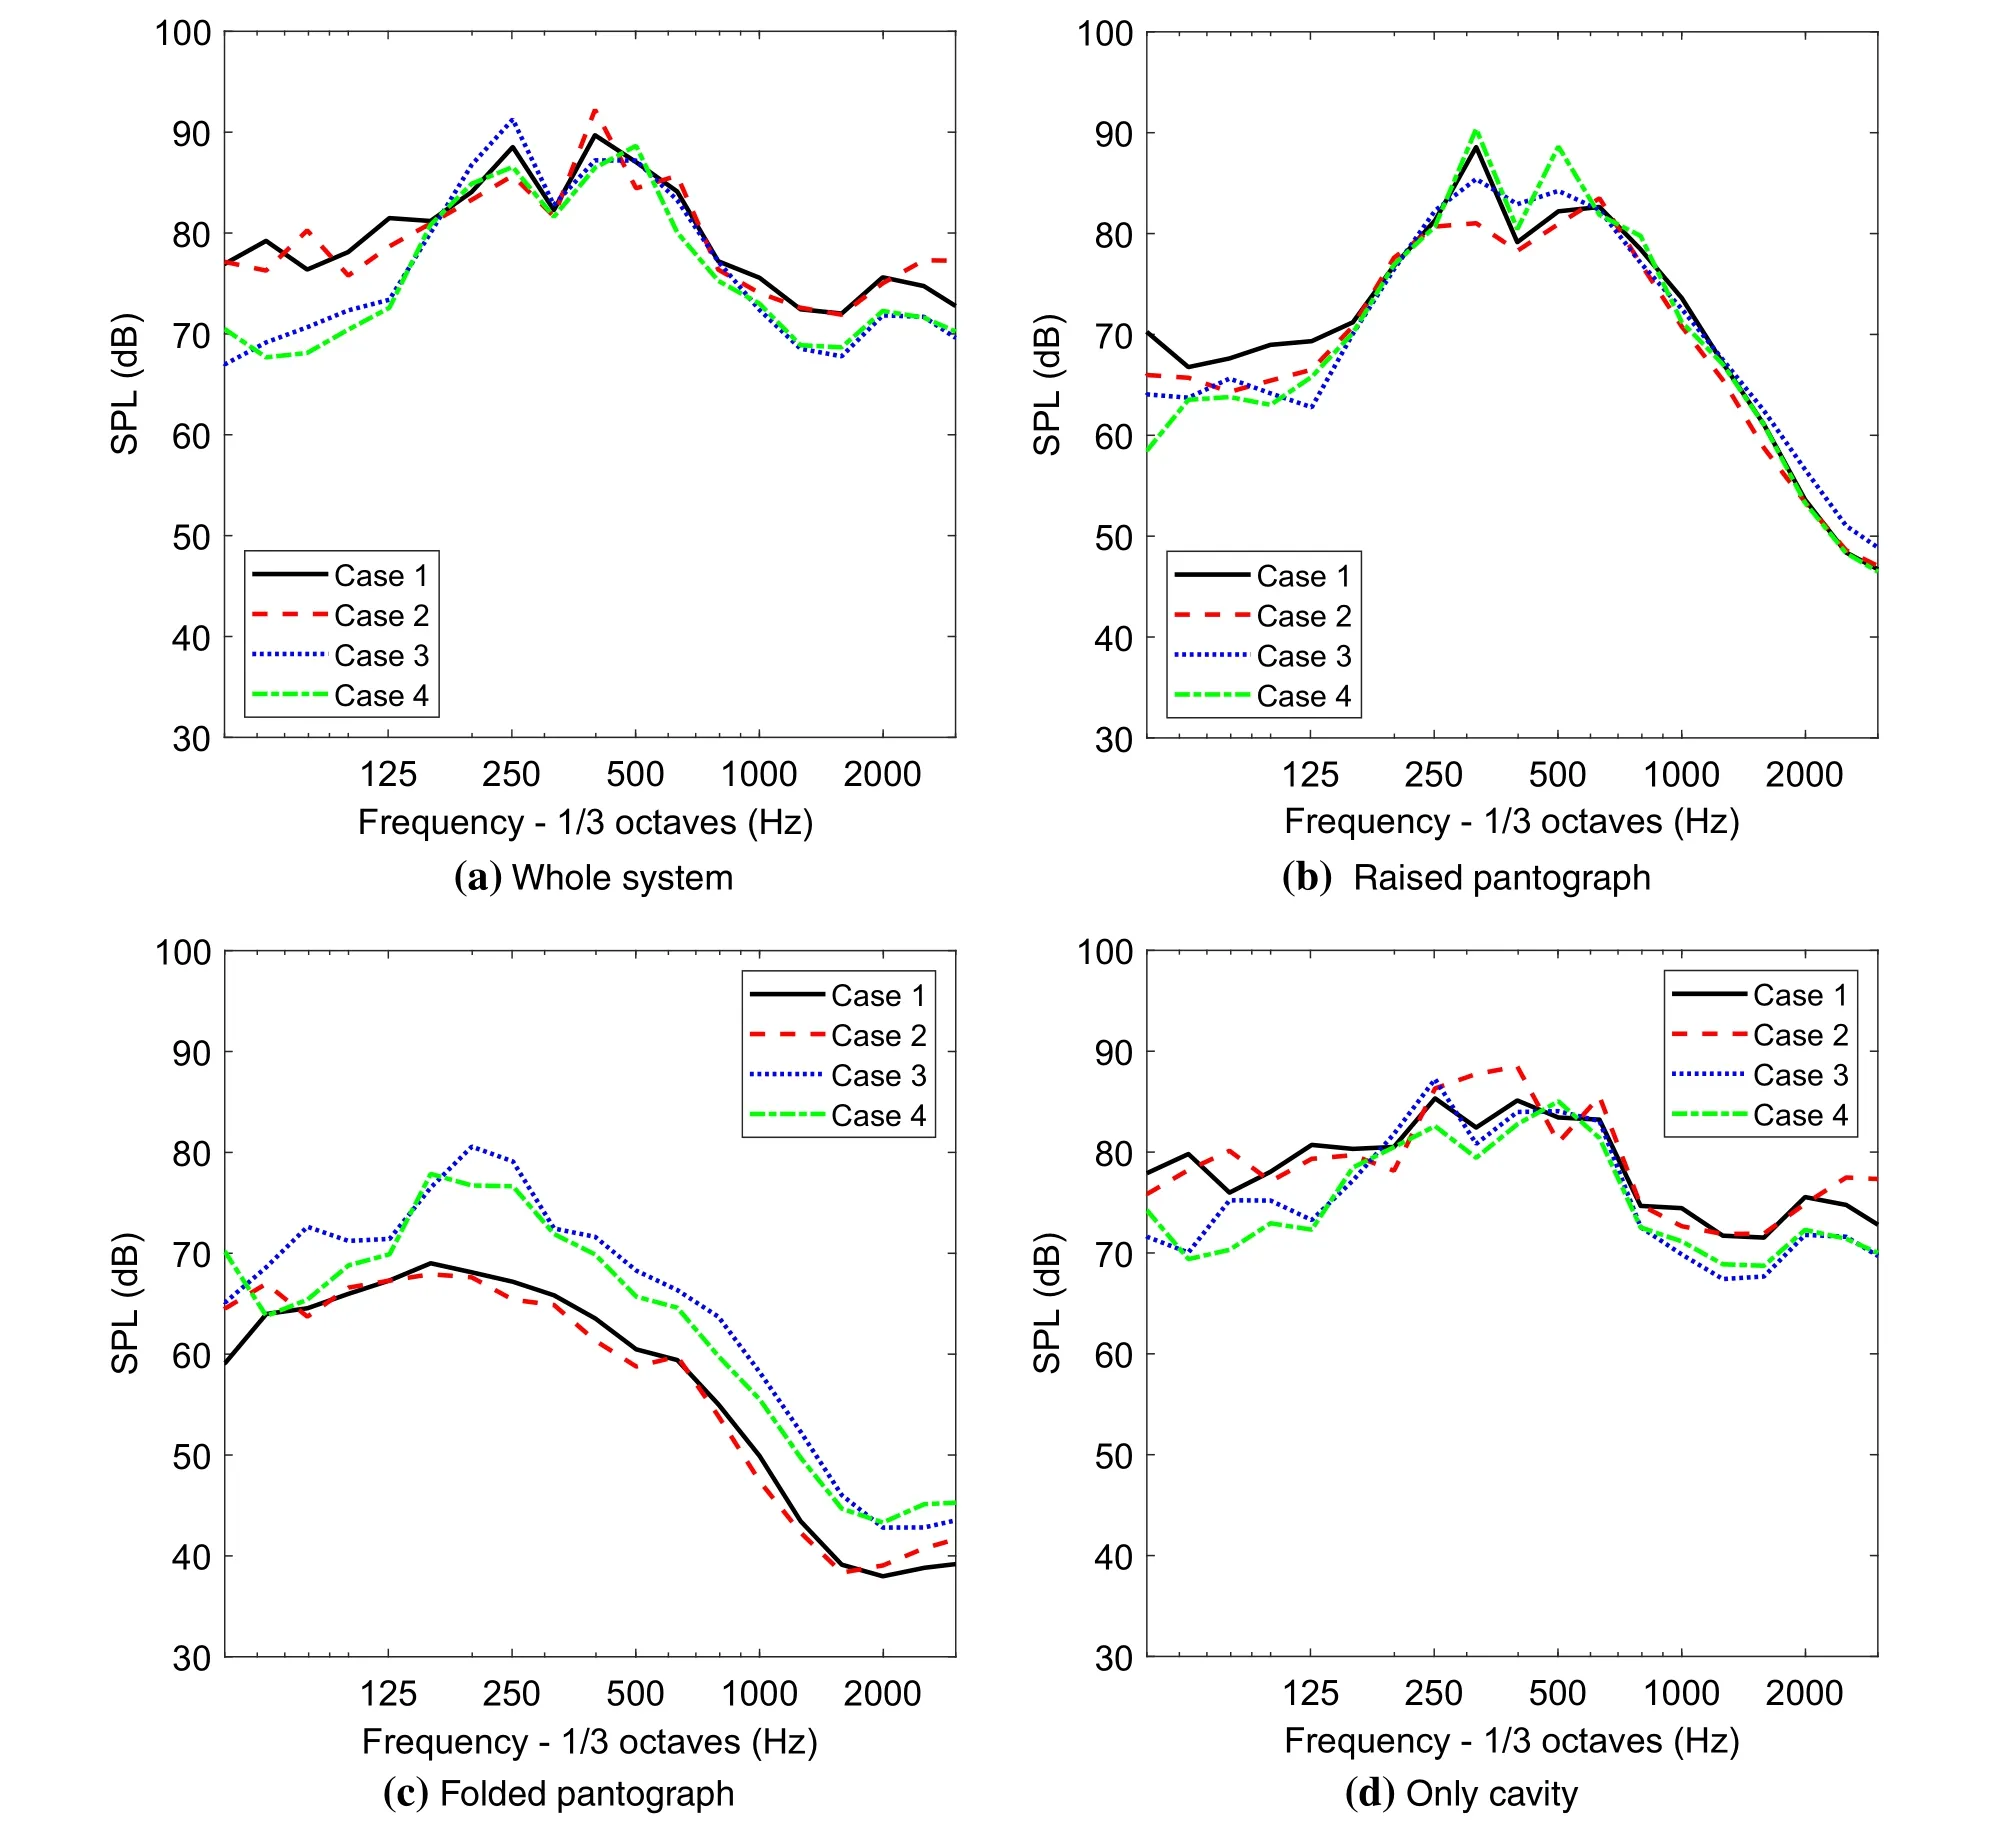
Fig.17 Sound pressure levels at top receiver position
6 Conclusions
Numerical simulations have been performed to investigate effects on the flow features and far-field acoustics of different cavity edge configurations by rounding and sloping the cavity edges.Both the cavity edge treatments show a reduction in the mean drag and the(negative)lift coefficients.When the cavity edges are rounded,the RMS values of the drag and the lift coefficients are also significantly reduced.Both treatments of the cavity show a significant reduction of the unsteady flow in the cavity trailing edge region.By rounding the cavity edges,the recirculation in the upstream region is reduced and the small recirculation region generated by the cavity trailing edge is eliminated.Consequently,the rounded cavity edge configuration with h/D=0.8 gives a 15.2 dB reduction in noise at the side receiver position and a 12 dB reduction at the top receiver position,compared with the baseline case.
Furthermore,the flow and noise characteristics of two DSA 350 pantographs located in a cavity with the rounded cavity edge have been investigated and compared with those for the same pantographs installed in a rectangular cavity.It is found that when the cavity edges are rounded,a slightly lower velocity occurs upstream of the upper parts of the raised pantograph than in the baseline case.However,the rounded cavity edge configuration causes higher velocities inside the cavity region.Consequently,the noise radiated from the raised pantograph with the rounded edgecavity is approximately 1 dB lower than for the baseline at the side receiver,whereas the noise radiated from the folded pantograph increases by 7.5 dB compared with the baseline case.However,its contribution to the total noise is still negligible.Furthermore,the noise radiated from only the cavity itself is significantly reduced.For the noise generated by the whole system,two(one raised and one folded)pantographs and the cavity,when the cavity edges are rounded with radius h/D=0.8,a total reduction of 0.5 dB at the side and 1.7 dB at the top are achieved.

Table 6 OASPLs in dB at the side and the top

Table 7 Sound power levels(re 10-12 W)from cases 1 and 2 with a rectangular cavity and cases 3 and 4 with the rounded cavity
AcknowledgementsThis research project has been supported by the Iridis 4 and Lyceum High Performance Computing Facility at the University of Southampton.
Open AccessThis article is licensed under a Creative Commons Attribution 4.0 International License,which permits use,sharing,adaptation,distribution and reproduction in any medium or format,as long as you give appropriate credit to the original author(s)and the source,provide a link to the Creative Commons licence,and indicate if changes were made.The images or other third party material in this article are included in the article’s Creative Commons licence,unless indicated otherwise in a credit line to the material.If material is not included in the article’s Creative Commons licence and your intended use is not permitted by statutory regulation or exceeds the permitted use,you will need to obtain permission directly from the copyright holder.To view a copy of this licence,visit http://creativecommons.org/licenses/by/4.0/.
杂志排行
Railway Engineering Science的其它文章
- Active suspension in railway vehicles:a literature survey
- Train-track coupled dynamics analysis:system spatial variation on geometry,physics and mechanics
- Train energy simulation with locomotive adhesion model
- Power management in co-phase traction power supply system with super capacitor energy storage for electrified railways
- Computational fluid dynamics simulation of Hyperloop pod predicting laminar-turbulent transition
