Optimization of yield criterion and simulation based on QP980 high strength steel①
2020-04-13GuanYanzhi管延智LiCaijunWangHaiboJiangYuan
Guan Yanzhi (管延智),Li Caijun,Wang Haibo,Jiang Yuan
(*School of Mechanical and Materials Engineering,North China University of Technology,Beijing 100144,P.R.China)(**Engineering Research Center of Variable Cross-Section Roll Forming,Beijing 100144,P.R.China)
Abstract
Key words:QP980 steel,stress-strain,yield criterion,finite element simulation
0 Introduction
At present,the demand is stronger for materials with high mechanical properties and the development of new varieties of high-strength steels is promoted.Quenched Ductile steels belong to the third generation of advanced high-strength steels,mainly composed of high-strength martensite,ferrite and residual austenite.Quenching and partitioning (QP) steel strength can reach 1 500 MPa.The corresponding elongation is still 15% with good mechanical properties[1].It is the future development trend that automotive will apply QP steel widely.Due to different internal structures,metal sheets have different yield behaviors under the same deformation conditions.In the deformation,the trip effect due to the residual austenite phase transition is beneficial to the improvement of the plasticity of the steel,so that the QP steel has the characteristics of high elongation and high strength[2].However,the steel material is usually subjected to stress in many directions in practical application,only one-way tensile test can’t fully reflect the performance of the material.In this work,a two-way tensile experiment of QP980 is carried out on an arm opening 10-shaped specimen[3],and the stress-strain relationship is analyzed by processing the experimental data,and the obtained data are validated by the usual yield criterion[4].Roll forming is a material saving,energy saving,high efficient and advanced net forming technology[5],achieving 1 000 MPa grade ultra high strength steel variable cross-section member forming at normal temperature and suiting for sheet metal forming.Through the method of theory and experiment of plastic work contour map comparison,exploring its forming mechanism based on the yield criterion is more suitable for steel material,obtaining the minimum error criterion and further optimizing the parameters obtained for QP980 material yield criterion.It is a foundation that QP980 ultra high strength steel can obtain high precision finite element simulation results.
1 QP980 tensile experiment of high strength steel
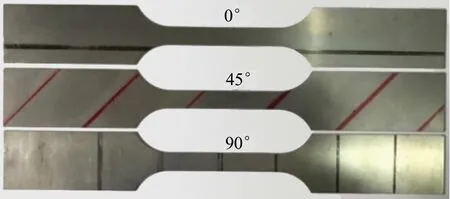
First,according to China’s national standards,the thickness of 1mm QP980 steel plate for laser cutting to obtain experimental specimens as shown in Fig.1.This experiment uses the biaxial tension testing machine developed by the Beijing Variable Cross Section Roll-forming Technology Research Center to carry out tensile test[6],check the tensile sensor and the extension meter before the experiment,its error is less than 1%.
(a) Uniaxial tensile specimen

(b) Biaxial tensile specimen
1.1 Uniaxial tensile test
In order to enhance the accuracy of the experiment,the direction of 0 °,45 ° and 90 ° along with the rolling direction (hereinafter referred to as 0 ° direction,45 ° direction,90 ° direction) are 3 times repeated unilateral experiments.According to the variation data of load (F) and deformation (Δl) obtained by unilateral experiment,the experimental data of each direction are calculated by stress and strain,and the real stress-real strain curve is plotted as shown in Fig.2.
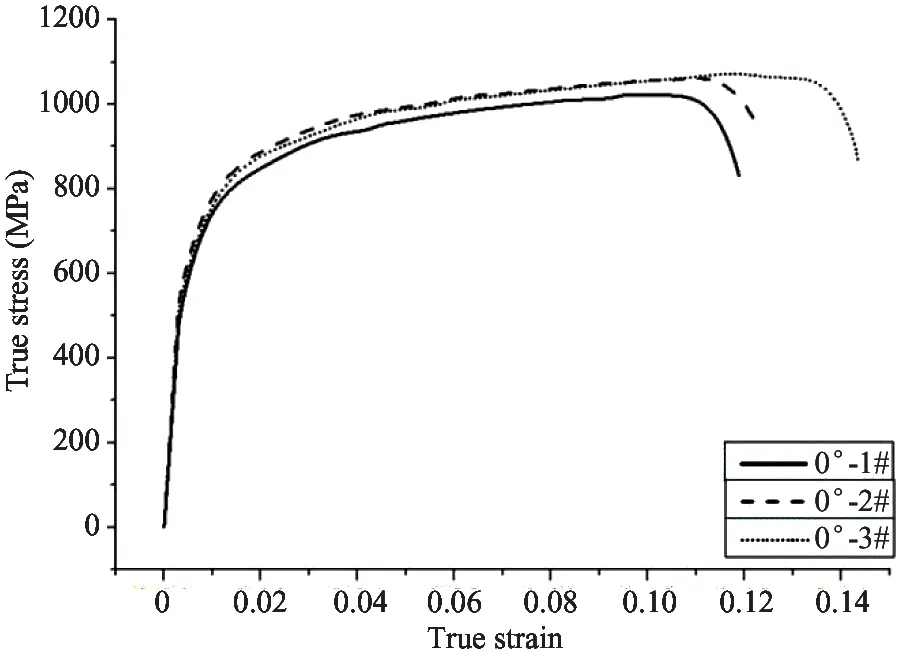
(a) Uniaxial tensile true stress-strain 0 ° direction
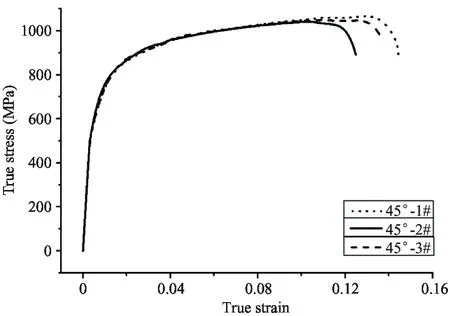
(b) Uniaxial tensile true stress-strain 45 ° direction
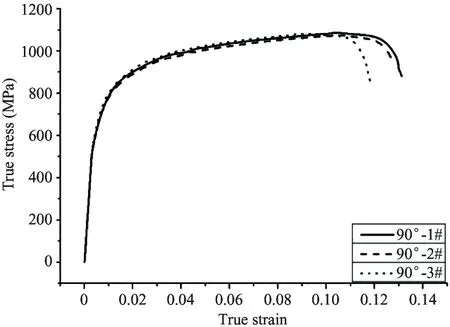
(c) Uniaxial tensile true stress-strain 90 ° direction
In Fig.2,the curves of three different directions are roughly the same,and the effect of specimen cutting direction on stress and strain is not significant.But overall,the 90 ° direction’s comprehensive performance is a little better,with high strength and elongation rate.
According to the experimental data,the performance indexes of one-way tensile experiment are calculated as shown in Table 1.Because there is no obvious yield point in the stress-strain curve of the material,the yield strength of 0.2% is equivalent to the real strain quarter.
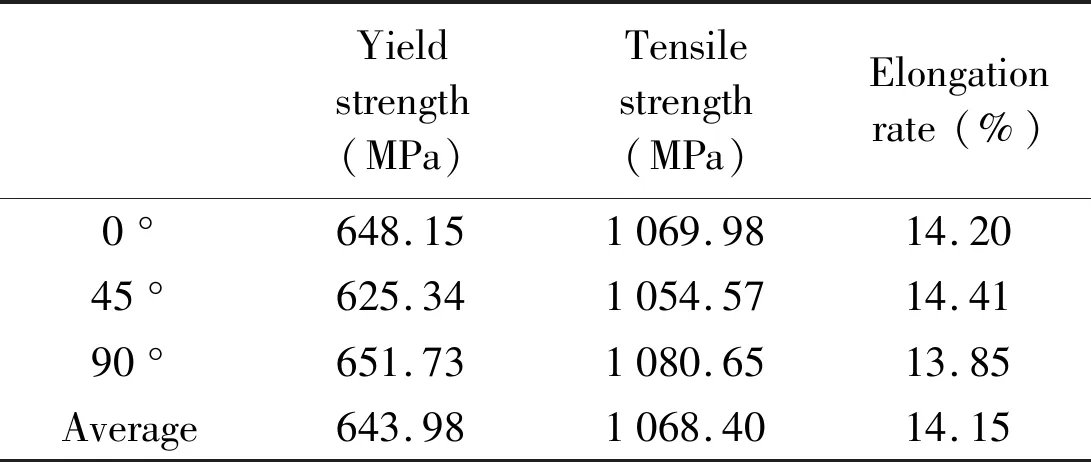
Table 1 QP980 mechanical parameters in different directions
The results show that the yield strength of the QP980 is about 640 MPa,the tensile strength is about 1 060 MPa.
1.2 Biaxial stretching experiment
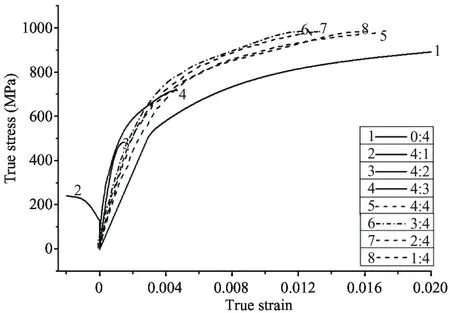
The Biaxial stretching experiments with 3∶4 different loading ratios of 4∶1,4∶2,4∶3,4∶4,2∶4,1∶4 and seven were carried out by cutting the double tensile specimens along the rolling direction.The experimental data of each direction are calculated and treated by stress and strain,and the real stress-strain curve of biaxial tensile is plotted as shown in Fig.3.
(a) Biaxial tensile true stress-strain proportion 4∶1

(b) Biaxial tensile true stress-strain proportion 4∶2

(d) Biaxial tensile true stress-strain proportion 4∶4

(e) Biaxial tensile true stress-strain proportion 3∶4

(f) Biaxial tensile true stress-strain proportion 2∶4

(g) Biaxial tensile true stress-strain proportion 1∶4
As shown in Fig.3,the stress-strain curves in both directions are quite different when the double-pull specimens are loaded with unequal loads in the rolling direction and the vertical rolling direction.In the experiment with the load ratio of 1∶4 or 4∶1,the negative strain occurs in the small load direction value,indicating that the specimen in this case did not stretch along the direction,but retracted.
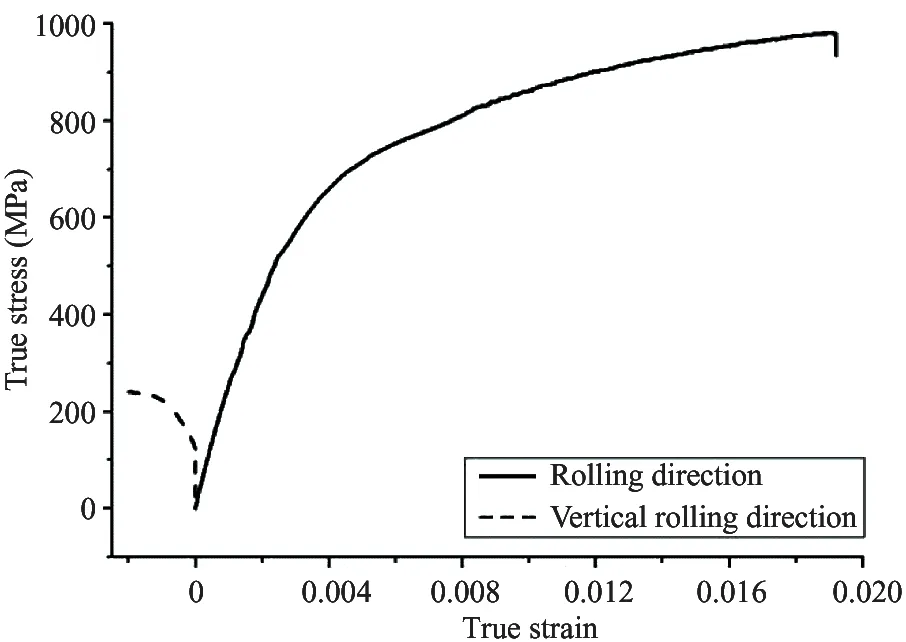
The data from the direction of 0 ° (4∶0) and 90 ° (0∶4) in the unilateral experiment are converted to the double pull data.The stress-strain curves of the rolling direction and the vertical rolling direction are compared in Fig.4.

(a) True stress-strain curve of biaxial tensile rolling direction
(b) True stress-strain curve of biaxial tensile vertical rolling direction
Fig.4True stress-strain curve of biaxial tensile
2 Research on yield behavior
After obtaining the bidirectional mechanical properties of QP980 under different loading ratios,it can be determined which kind of yield criterion is more suitable for the material.
2.1 Plastic contour experiment on QP980
Using the tensile test data and the unit volume plastic work equivalence principle,the experimental plastic work contour is plotted as shown in Fig.5.
According to the theory of plastic increment,the yield surface will be enlarged continuously as the load increases or the deformation enlarges.In Fig.5,the contour of each plastic work has an external convex trend,and when the value of the equivalent strain point is increased from 0.2% to 1.5%,the contour of the experimental plastic work corresponding to each strain point is gradually expanded outward.
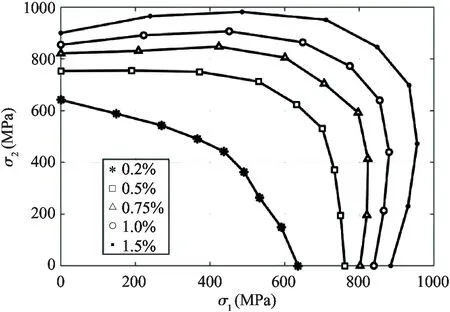
Fig.5 Experimental plastic work contours of QP980
2.2 Comparison of theoretical curves and experimental curves of different yield criteria
The corresponding stress at 0.5%,0.75%,1% and 1.5% four strain points are compared with Mises,Hill’48,Hosford and Barlat89 four common yield criteria,and the required data is shown in Table 2.
The strain points in the table are selected according to the tensile test results,because different results are calculated according to different strain points,which will cause some errors.Therefore,in order to reduce the error caused by the selection of strain points,the theoretical and experimental curves of yield criterion are normalized.
2.2.1 Analysis and comparison of Mises yield criterion

Table 2 The biaxial stretching yield stress value of QP980
Mises yield criterion formula in plane stress state:
(1)
where,σ1is the stress of the material rolling direction andσ2is the stress of the vertical rolling direction of the material.σsis equivalent stress and the corresponding stress value in Table 2 taken according to different strain points.
The Mises description criteria and experimental points are shown in Fig.6.It can be seen from the graph that although the theoretical curve is in line with the experimental point,the whole theoretical curve is in the upper right of all experimental points,so Mises criterion is not good to the yield behavior of QP980 high strength steel.
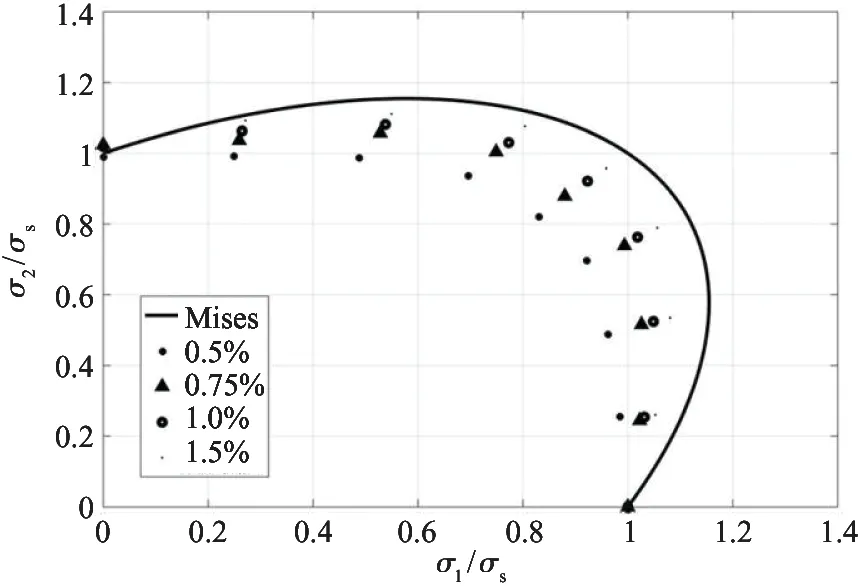
Fig.6 Comparison between normalized experimental plastic work contours and Mises yield criterion
2.2.2 Analyze and compare Hill’48 yield criterion
Under the condition of plane stress,Hill’48 yield criterion formula[7-10]is calculated.The simplified formula is
(2)
where,σbis the equal tensile stress.The corresponding equivalent stress in Table 2 is obtained by each parameter according to different strain points.Get the regular Hill’48 criteria and experimental points,shown in Fig.7.

Fig.7 Comparison between normalized experimental plastic work contours and Hill’48 yield criterion
As can be seen from Fig.7,the theoretical curve of Hill’48 runs through the experimental point and is basically consistent with the external convex trend of the experimental point line,so Hill’48 yield criterion is good for the QP980 high strength steel material.
2.2.3 Analyze and compare Hosford yield criterion
QP980 is a body-centered cubic structure of metal,so Hosford yield criterion formula can be simplified as
(3)
In Eq.(3),ris the plastic strain ratio.Each parameter is valued according to the different strain points by Table 2.Hosford criterion is compared with the experimental point in Fig.8.

Fig.8 Comparison between normalized experimental plastic work contours and Hosford yield criterion
The curve in Fig.8 is far from the line between the theoretical curve and the experimental point,so Hosford yield criterion is not suitable to describe the yielding behavior of QP980.
2.2.4 Analyze and compare Barlat89 yield criterion
The formula of Barlat89 yield criterion is
f=a|K1+K2|n+a|K1-K2|n
(4)
where,
According to the plastic strain ratio calculation parameter[8]:
c=2-a
where,the yield strength of the material 45 ° in the direction of single pull isσ45.The data in Table 2 is entered into the formula of Barlat89 yield criterion.Barlat89 criterion is compared with the experimental point in Fig.9.

Fig.9 Comparison between normalized experimental plastic work contours and Barlat89 yield criterion
It can be seen from the graph that the theoretical curve of Barlat89 yield criterion is larger than that of experimental point,and the difference of coincidence degree is that the Barlat89 yield criterion is not suitable for QP980 high strength steel.
2.3 Compare yield criterion error calculation
In order to express more clearly the coincidence degree of yield criterion for QP980 high-strength steel,the yield trajectories and the error values of experimental data are compared by calculating various yield criteria.The calculation formula of the error δ is as follows:
(5)
where,diis the straight line distance from the experimental yield point to the corresponding theoretical point.σ1iis the abscissa of the experimental yield point;σ2iis the ordinate of the yield point of the experiment;kis the number of experimental points,and the value ofkis 7.
The error and average error of each yield criterion at each strain point are calculated by using Eq.(5),Table 3 and Table 4 can be obtained.
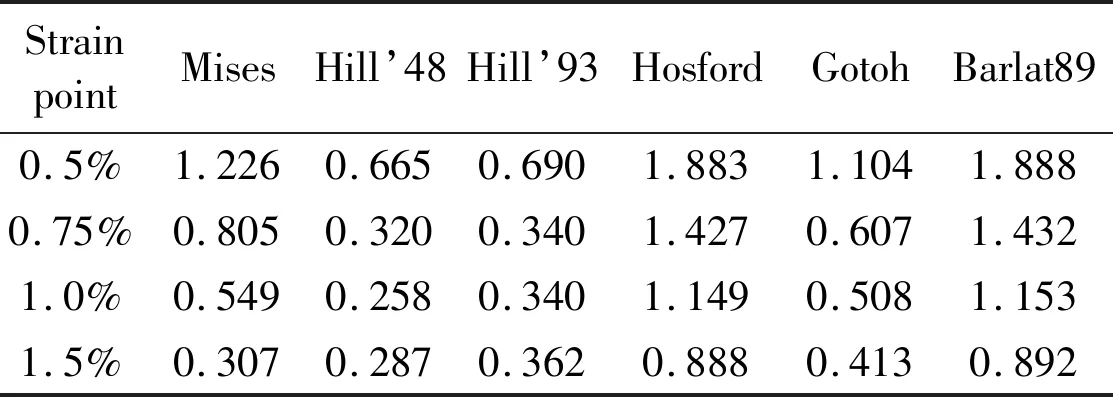
Table 3 Error size of each yield criterion at each strain point
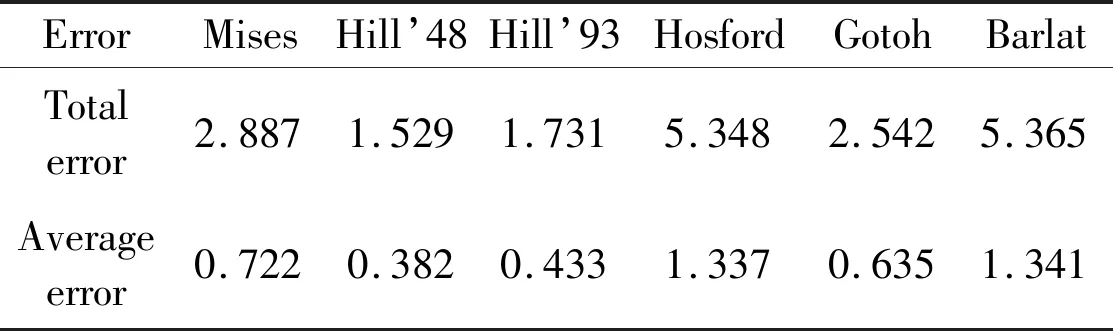
Table 4 Average error of each yield criterion at each strain point
According to the data in Table 3 and Table 4,the error values of the yield criteria at different experimental points on the experimental plastic contour are drawn into a columnar diagram,as shown in Fig.10.

Fig.10 Comparison of different experimental point error
It can be clearly observed from the figure that the relative error between Hosford and Barlat89 yield criterion is larger than that of Mises and Gotoh yield criterion.Hill’ 48 error value is relative minimum.
3 Optimization based on Hill’48 yield criterion
Due to the Hill’48 yield criterion’s error still reached 38.2%,optimizing the Hill’48 criteria of solving method about stress anisotropy.In the experimental plastic work line of Fig.5,the extruding trend of the curve is more obvious as the strain increases.Therefore,the equivalent plastic strain parameter (ε-p) is introduced into the expression of Hill’48 yield criterion.Since theε-phas no units,it has no effect on the ends of the expression.On the basis of Eq.(1),the optimized expression is
(6)
(7)

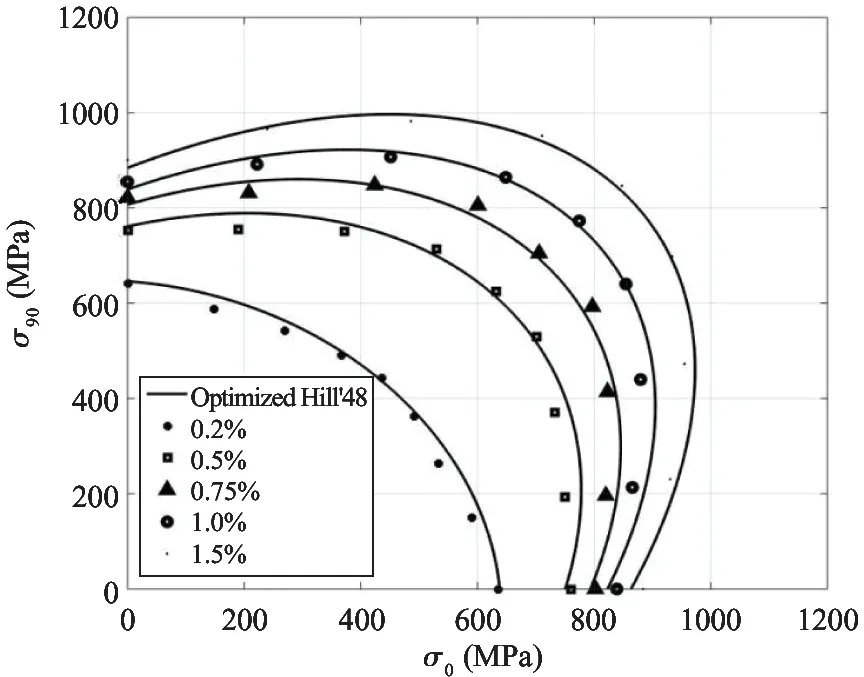
Fig.11 Experimental plastic contour fitting curve
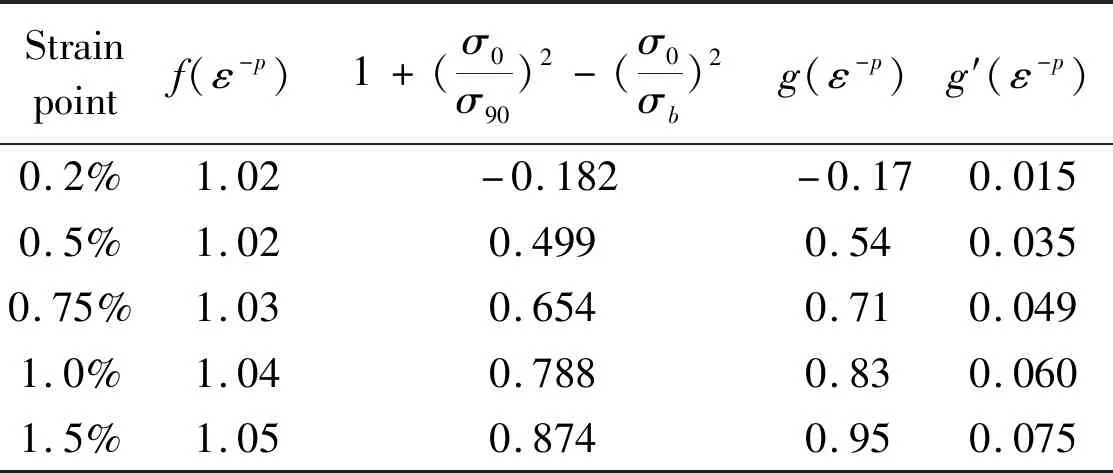
Table 5 Fitting parameters of optimization formula
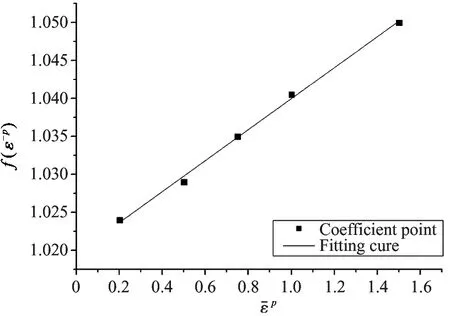
(a) f(ε-p) fitting diagram

(b) g′(ε-p) fitting diagram
The parameter formula obtained after fitting is as follows:
f(ε-p)=1.02+1.97ε-p
(8)
g′(ε-p) = 8.36ε-p-240.15ε-p2
(9)
The optimum formula is
According to Eq.(10),the optimized yield criterion is compared with the experimental point,as shown in Fig.13.

Fig.13 Comparison between the optimized yield criterion and experimental points after regularization
The error and average error of each yield criterion at each strain point are calculated by using Eq.(5),Table 6 can be obtained.

Table 6 Error after optimization of Hill’48 rule
Draw the error value into a columnar graph and compare it with Hill’48,as shown in Fig.14.

Fig.14 Error comparison between optimization criteria and Hill’48
As can be seen from Table 4 and Fig.14,the average error of the optimized Hill’48 yield criterion is 29.8%,which is 8.4% lower than that of Hill’48.The error of the optimized curve at the strain point 0.75% is only 0.149.Therefore,the optimized Hill’48 yield criterion is more suitable for describing the yield behavior of QP980 high strength steel.
4 Finite element simulation based on QP980 roll forming model
4.1 Establishment of QP980 roll forming model
Because many forming mechanism contains a variable height die dynamic roll forming process,so the production line structure design can’t completely guarantee the rationality and reliability of equipment and process reliability,so it is necessary in the production of equipment before using the finite element simulation analysis.In order to solve possible problems,improving equipment design success rate and reducing the costs[11].
Roll forming production line is variable height fixed die and dynamic roll,which is independently developed by Beijing Roll Forming Technology Center,as shown in Fig.15.ABAQUS is used to qualitatively research and analyse the forming process of QP980[12-14].
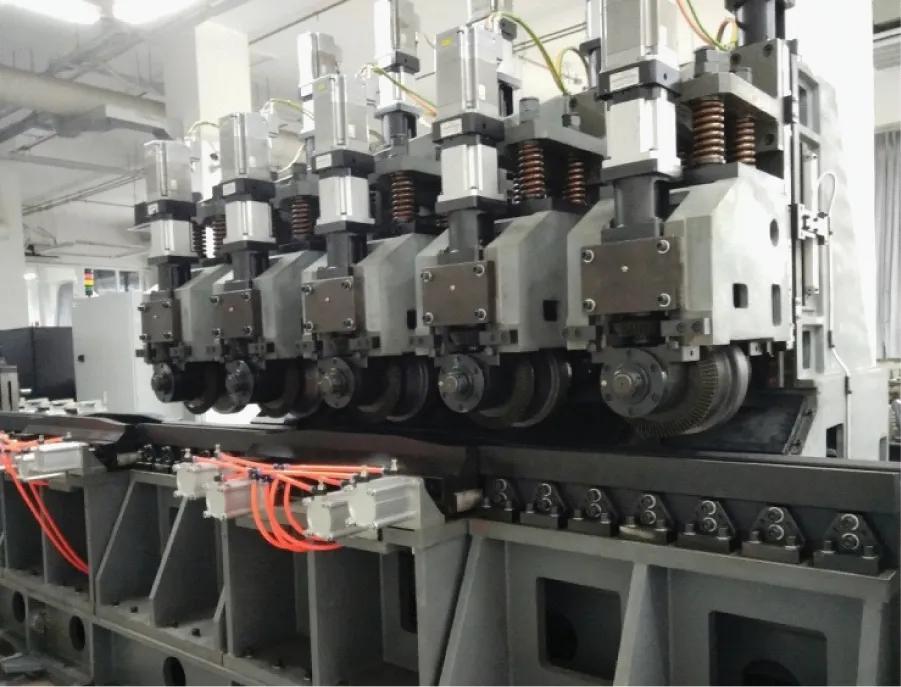
Fig.15 Variable section element of variable height fixed die roll forming line
The simplified 3D model is drawn in the SolidWorks software,and then the model is introduced into the ABAQUS finite element software,as shown in Fig.16.The model consists of five stands mould,forming rollers and experimental plates.The angles of the rolls are 30 °,50 °,70 °,84 °,84 °,respectively.The forming angles of the 4th stands are the same as those of the 5th passes.The reason is that the sheet can take full plastic deformation.The forming effect is good.

Fig.16 Simplified model of variable cross-section unit
4.2 Setting of model data
Through uniaxial and biaxial tension experiment of QP980 high strength steel,the parameters of material mechanical properties can be obtained.The main deformation occurs in the rolling direction in the actual forming process.Therefore use data about the direction of roll forming for simulation and analysis.The data of roll forming is that uniaxial tension tests of 0 ° direction.
The most suitable description of QP980 high strength steel is the optimized Hill’48 theory curve,so this simulation selects the Hill’48 criterion after optimization.Because of Mises yield criterion and Hill’48 yield criterion in the ABAQUS software,the formula coefficient is only needed when the software is used.The calculation formula given in the user’s manual is:
f(σ)=F(σ22-σ33)2+G(σ33-σ11)2
(11)
In this research,the simulation analysis only needs to consider the plane stress,soL,M,Nneed not be calculated.The values ofR12,R13andR23are all 1,and the other parameters are calculated as follows[14]:
(12)
The parameter values of Hill’48 yield criterion with ABAQUS are obtained,shown as Table 7.
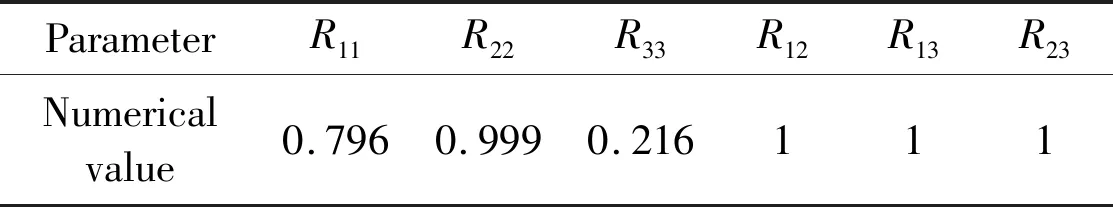
Table 7 Hill’48 yield criterion parameter value
5 Result of finite element simulation analysis of QP980 high strength steel
5.1 Equivalent stress analysis
The following Fig.17 is the equivalent stress cloud diagram of high strength steel QP980 after variable cross-section roll-forming production line.From the diagram,it can clearly be seen that the sheet forming quality is good,and there is no larger side wave.In the bending deformation zone equivalent large stress is relatively large,while equivalent stress is small in the no deformation zone,especially in the U shaped groove of stress concentration,the maximum stress also occurs in the area.

Fig.17 Equivalent stress cloud diagram of QP980 sheet metal after forming
5.2 Equivalent strain analysis
Fig.18 is the equivalent plastic strain cloud diagram of QP980 sheet.The equivalent plastic strain value in the no deformation area is almost zero.The equivalent plastic strain is mainly concentrated in the bending area and the inside of the U groove which is uniform.The maximum strain value is 0.167,which occurs near the U shaped groove.

Fig.18 Equivalent strain cloud diagram of QP980 sheet metal after forming
6 Experimental verification
Finite element simulation model of the QP980 high strength steel is verified by the prototype of the production line with variable height roll forming process.As shown in Fig.19,from the picture,it can be seen that the quality of the forming parts is better,the web is smooth,and the bending and warpage defects do not appear on the edge of the sheet metal.

Fig.19 QP980 high strength steel formed target parts of complete forming
In order to visually evaluate the closeness of the finite element simulation results and the experimental results,a three-dimensional laser scanner can be used to perform three-dimensional scanning on the experimental components to obtain a model of the molded part,and then the obtained model is compared with the finite element simulation results.The formed part was laid flat on the ground,aging treatment was performed to release the forming stress,and the data collected from the test piece was modeled after 6 months.The comparison between the simulation results and the experimental results is shown in Fig.20.

(a) overall comparison
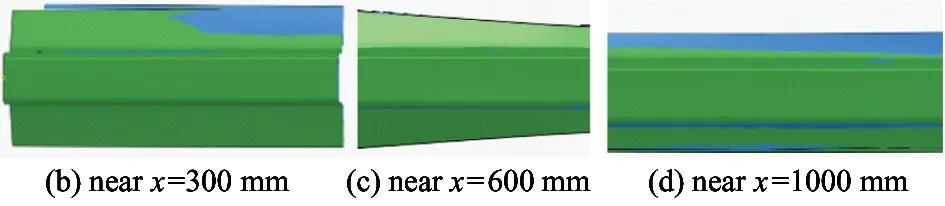
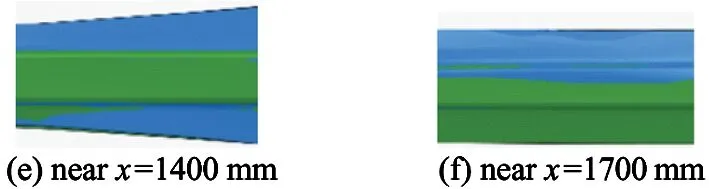
Fig.20 Comparison of simulation results and experimental results
It can be seen from Fig.20(a) that the simulation results are in good agreement with the experimental results in the middle of the molded part,and there are large differences at both ends of the formed part.It can be seen from Figs 20(c)-(e) that the airfoil rebound and web deformation of the simulation results are consistent with the experimental results in the range of 600-1 400 mm from the left side of the part.It can be seen from Fig.20(b) and Fig.20(f) that the molded part not only has a relatively serious longitudinal warping deformation,but also has a torsional deformation,and the torsional deformation is particularly evident at both ends of the part.
The maximum deviation values obtained from the comparison model are shown in Table 8.It can also be seen from the table that the deviation between the ends of the formed piece is large.Torsional deformation is mainly due to the existence of machining and assembly errors,so that the trajectory of the roll does not coincide with the contour of the mold,resulting in asymmetry of the force on both sides of the slab and the web.

Table 8 Maximum deviation between simulation results and experimental results (mm)
7 Conclusions
QP980 yields strength about 640 MPa,tensile strength of about 1 060 MPa,but also has good elongation properties.The experimental plastic work contour is drawn.QP980 has anisotropy characteristic.The work Compares with the QP980 experimental data by four commonly used yield rules of Mises,Hill’48,Hosford and Barlat89.Hill’48 yield criterion is in good agreement with the QP980 experimental data.The theoretical yield trajectory of Hill’48 yield criterion and the experimental plastic work contour line are the smallest relative to Mises,Gotoh and Hill’93,and the error after optimization is reduced by 8.4%.The quality of QP980 ultra high strength steel finite element simulation forming is better,in agreement with the actual forming parts.The optimized Hill’48 yield criterion is more suitable to describe the yield behavior of QP980 ultra high strength steel in variable cross section roll forming.
杂志排行

High Technology Letters的其它文章
- A bibliometric analysis of gene editing research①
- A hybrid optimization approach for the heterogeneous vehicle routing problem with multiple depots cooperative operation①
- Airport gate assignment problem with deep reinforcement learning①
- Research on transient characteristics of cavitation phenomena in pilot stage of jet pipe servo-valve①
- A 16-channel high-voltage reconfigurable and flexible-controlled implantable wireless closed-loop system for SCI repair①
- Model-free adaptive control of space manipulator under different gravity environment①