Wave-Breaking Features of Blocking over Central Siberia and Its Impacts on the Precipitation Trend over Southeastern Lake Baikal
2020-04-01DorinaCHYIZuoweiXIENingSHIPinwenGUOandHuijunWANG
Dorina CHYI, Zuowei XIE, Ning SHI, Pinwen GUO, and Huijun WANG,
1Collaborative Innovation Center on Forecast and Evaluation of Meteorological Disasters/Key Laboratory of Meteorological Disaster, Ministry of Education/Joint International Research Laboratory of Climate and Environment Change, Nanjing University of Information Science and Technology, Nanjing 210044, China
2International Center for Climate and Environment Sciences, Institute of Atmospheric Physics,Chinese Academy of Sciences, Beijing 100029, China
3Nansen-Zhu International Research Center, Institute of Atmospheric Physics,Chinese Academy of Sciences, Beijing 100029, China
4Climate Change Research Center, Institute of Atmospheric Physics,Chinese Academy of Sciences, Beijing 100029, China
ABSTRACT Precipitation over southeastern Lake Baikal features a significant decreasing trend in July and August over 1979-2018 and is closely related to blocking occurrence over central Siberia (45°-70°N, 75°-115°E). This study investigates the formation and maintenance of anticyclonic and cyclonic wave-breaking (AWB and CWB) blocking events and their climate impacts on precipitation in the southeastern Lake Baikal area. Both AWB and CWB blocking events are characterized by a cold trough deepening from the sub-Arctic region and a ridge amplifying toward its north over central Siberia, as well as an evident Rossby wave train over midlatitude Eurasia. For AWB blocking events, the ridge and trough pair tilts clockwise and the wave train exhibits a zonal distribution. In contrast, ridge and trough pair associated with CWB blocking events leans anticlockwise with larger-scale, meridional, and more anisotropic signatures. Moreover, the incoming Rossby wave energy associated with CWB blocking events is more evident than for AWB blocking events. Therefore, CWB blocking events are more persistent. AWB blocking events produce more extensive and persistent precipitation over the southeastern Lake Baikal area than CWB blocking events, in which moderate above-normal rainfall is seen in the decaying periods of blockings. A significant decreasing trend is found in terms of AWB blocking occurrence over central Siberia, which may contribute to the downward trend of precipitation over southeastern Lake Baikal.
Key words: Rossby wave-breaking, blocking, Siberia, precipitation, Lake Baikal
1. Introduction
Global warming has increased the expansion of drylands, one of which is the southeastern Lake Baikal area(Hessl et al., 2018; Huang et al., 2019). In accordance with global warming, this area has experienced dramatic warming and increased occurrence of drought during summer in recent decades (Obyazov, 2015; Hessl et al., 2018). The southeastern Lake Baikal area, including Northeast China, is a transitional zone between inland arid regions and the humid monsoon region (Huang et al., 2019). Therefore, the precipitation over southeastern Lake Baikal mostly results from the convergence of monsoon flows and midlatitude flows insitu (Berezhnykh et al., 2012; Antokhina et al., 2018). Aside from a dramatic decrease in East Asian summer monsoon northward propagation (Li et al., 2009), the warming over southeastern Lake Baikal increases the regional geopotential height, which is unfavorable for rainfall (Chen et al.,2017; Hessl et al., 2018). It has been noted that blockings over Eurasia and the Russian Far East increase the precipitation over southeastern Lake Baikal (Bueh et al., 2016; Antokhina et al., 2018, 2019).
Blocking circulation exhibits large variations in its structure and orientation. A split in the westerly flow can give rise to diffluent blockings, with a closed high on the poleward side of a closed low, also known as a dipole blocking(Rex, 1950). An amplified ridge can lead to an omegashaped blocking resembling a sandwich pattern, with a blocking high between two lows to the east and west (Barriopedro et al., 2010). Pelly and Hoskins (2003) proposed a novel blocking definition based on the reversal of potential temperature gradients on the dynamic tropopause with a poleward extrusion of warm air and an equatorward extrusion of cold air, to which Rossby wave-breaking (RWB) is integral(Tyrlis and Hoskins, 2008). RWB is characterized by the irreversible distortion of material contours due to the amplification of Rossby waves in regions of weaker zonal flow or diffluence (McIntyre and Palmer, 1983; Nakamura, 1994).Thorncroft et al. (1993) and Peters and Waugh (1996) introduced four different RWB patterns according to the direction and the extrusion intensity of the air mass, which were denoted as LC1/2 and P1/2. Based on these RWB features,blockings can be classified into warm- and cold-cyclonic blockings and warm- and cold-anticyclonic blockings(Masato et al., 2012, 2013; Shi et al., 2016).
The RWB characteristics of blockings have different influences on regional weather. Masato et al. (2012, 2013) identified five main winter blocking groups comprising anticyclonic RWB (AWB) of blockings over Europe and central Siberia and cyclonic RWB (CWB) of blockings over the western Pacific, central Pacific and Atlantic. They noted that AWB blockings over land areas causes cold temperature anomalies, while CWB blockings over oceans induces precipitation anomalies.
However, CWB blockings become more frequent over central Siberia during the summer, where the anticyclonic shear ambient flow in the winter turns to a cyclonic shear in the summer due to the poleward displacement of the westerly jet stream (Tyrlis and Hoskins, 2008). Climatological investigation of blockings over the Eurasian continent has shown that blockings over central Siberia become highly recurrent in July and peak in August, with 69% of its annual occurrence, and are significantly influential over East Asia (Li and Ding, 2004; Shi and Zhi, 2007; Cheung et al. 2013).Aside from the northward jump of the East Asian jet stream,there is an evident westward displacement of the jet core from 140°E to 90°E, to the north of the Tibetan and Iranian plateaus (Zhang et al., 2006). The blocking circulation over central Siberia significantly increases the summer rainfall amount in North China, and the occurrence of the northeastern China cold vortex (Liu et al., 2012; Xie and Bueh, 2015;Bueh et al., 2016). Shi et al. (2016) demonstrated that precipitation anomaly patterns in China differ in four RWB blocking events over northeastern Asia. Antokhina et al. (2019)noted that cyclonic anomalies lie to the south of blockings over central Siberia that are associated with precipitation over southeastern Lake Baikal, which suggests RWB blockings exert different impacts on precipitation over this region. Given the noted predominant blocking occurrences over central Siberia in July and August, and the diverse weather impacts of blocking configurations, we need to further examine blocking patterns over central Siberia and associated surface weather influences. These relations could shed light on the nature of climate change in the southeastern Lake Baikal region.
A number of studies have shown that Rossby wave propagation contributes to blocking formation and maintenance. Nakamura et al. (1997) and Michel and Rivière (2011)revealed that Rossby wave energy from the North Atlantic plays an important role in the formation of AWB blockings over Europe, whereas incoming Rossby wave packets for blockings over the North Pacific are absent. Gabriel and Peters (2008) noted that a CWB blocking is associated with a poleward Rossby wave flux, while an AWB blocking is related to an equatorward Rossby wave flux. These findings were confirmed in recent studies regarding RWB blockings over northeastern Asia (Bueh and Xie, 2013; Shi et al.,2016; Xie and Bueh, 2017). AWB blockings over northeastern Asia are triggered by Rossby wave packets from the North Atlantic and Europe. In contrast, CWB blockings tend to export Rossby wave energy downstream. Apart from the Rossby wave train over the Eurasian continent, Rossby wave packets excited by Tibetan Plateau diabatic heating, replenish the wave energy of RWB blockings over East Asia(Wang et al., 2011). It has also been recognized that planetary-scale climate modes such as the Arctic sea-ice concentration, North Atlantic Oscillation, and stratospheric planetary waves can modulate the occurrence of Urals blocking (Yao and Luo., 2015; Nath and Chen, 2016; Gong and Luo, 2017;Zhang et al., 2018; Lü et al., 2019). Luo and Yao (2014)showed that both AWB and CWB blockings are caused by reduced positive climatological stationary wave anomalies.The planetary-scale circulation provides an initial favorable background condition, in which the synoptic-scale disturbance triggers the dipole blockings (Luo et al., 2010; Jiang and Wang, 2012). In view of the above different wave propagation features in RWB blockings, it is of interest to examine the contribution of Rossby wave packets to different blocking circulations over central Siberia.
This study aims to investigate the lifecycle of RWB blocking events over central Siberia and their possible contributions to the decreased precipitation over southeastern Lake Baikal during July and August. Noting the relatively transient air mass intrusions associated with RWB over central Siberia (Masato et al., 2012), we mainly focus on AWB and CWB blocking events that are separated by their blocking direction. We explore the intraseasonal evolution of RWB blocking circulations in terms of Rossby wave propagation. Then, we investigate the contributions of AWB and CWB blocking events to the decreased precipitation over southeastern Lake Baikal on the basis of each weather impact, including surface air temperature and precipitation. In the following section, we describe the data and methods. Sections 3 presents the evolutions of AWB and CWB blocking circulation over central Siberia and the related lateral Rossby wave propagation on the intraseasonal time scale, as well as their influences on temperature and precipitation. Section 4 shows the contribution of RWB blockings to the decreased precipitation over southeastern Lake Baikal. Discussion and conclusions are provided in the final section.
2. Data and methods
2.1. Data
In this study, we use fifth-generation European Centre for Medium-Range Weather Forecasts (ECMWF) atmospheric reanalysis data (ERA5) (Copernicus Climate Change Service (C3S), 2017). ERA5 is produced using ECMWF's Integrated Forecast System with a horizontal spatial resolution of 31 km and 137 hybrid sigma-pressure (model) levels in the vertical direction, up to a top level of 0.01 hPa. The pressure-level variables used are hourly geopotential, air temperature and horizontal winds on 2.5° × 2.5° and 1.5° × 1.5° latitude/longitude grids. The near-surface variables include hourly 2-m air temperature, 10-m horizontal winds and precipitation on a 1° longitude × 1° latitude grid. We employ vertically integrated eastward and westward water vapor fluxes on a 1° longitude × 1° latitude grid. We also use hourly potential temperature on the dynamical tropopause (2 PVU,where 1 PVU = 10-6K m2kg-1s-1) with 2.5° × 2.5°, 2° ×2° and 1.5° × 1.5° latitude-longitude grids. The daily mean data are obtained by averaging the hourly reanalysis data.The period examined here is from 1 July to 31 August over the years 1979-2018.
The daily gridded precipitation data are from APHRODITE (Asian Precipitation-Highly Resolved Observational Data Integration Toward Evaluation of Water Resources)(Yatagai et al., 2012). This suite of precipitation data is derived based on rain gauge precipitation measurements in monsoonal Asia (15°S-55°N, 60°-150°E), the Middle East(15°-45°N, 20°-65°E) and Russia (34°-84°N, 15°-165°W),and provided on a 0.5° × 0.5° longitude-latitude grid. The data are available from 1951 to 2007 over three areas in version 1101 and are additionally extended to 2015 in version 1101 extend in monsoonal Asia.
2.2. Definition and classification of blocking events
Blocking events are identified on the basis of the reversal of potential temperature on the dynamic tropopause surface (e.g., 2 PVU) (Pelly and Hoskins, 2003), similar to Masato et al. (2012) and Shi et al. (2016). Unlike these studies, a low-pass filter with an 8-day cutoff period is applied to the potential temperature and pressure-level fields to remove the high-frequency disturbance. The reversal of potential temperature, denoted as B index, is calculated at each grid (λ0, φ0) within the 40°-70°N zonal belt for each day according to

where θ is the potential temperature at the dynamic tropopause and Δ φ is 30°. If the B index is positive, a transient local blocking occurs. The local maximum positive grid of the B index is referred to as the central location of the blocking.A blocking event is identified if the following three criteria are met (Masato et al., 2013; Shi et al., 2016):
(1) If there is a maximum positive B index at day n + 1 within a 36° × 27° box (longitude-latitude) centered at the blocking center at day n. Such a maximum is considered as a continuation of that blocking event; otherwise, it is considered as a new event.
(2) If there is no maximum positive B index within a box 1.5 times greater in both latitude and longitude than the box used in (1) centered at the blocking center on the onset day, it is considered to be the end of an event.
(3) The duration of the blocking event is at least four days.
Parallel blocking identifications are applied to 2.5° ×2.5°, 2° × 2° and 1.5° × 1.5° latitude-longitude grids. Blocking distributions are generally consistent with each other among the three different data resolutions, but with sharper features in the higher resolution data (not shown). Given that a blocking is a large-scale atmospheric circulation with a longitudinal scale between 12° (Tibaldi and Molteni,1990) and 45° (Rex, 1950), it is sufficient to resolve the blocking occurrence using the 2.5° × 2.5° grid.
As seen from Figs. 1 and 2a, an increased blocking occurrence over central Siberia (45°-70°N, 75°-115°E) is highly related to the variability of areal-average precipitation over southeastern Lake Baikal (40°-55°N, 105°-125°E). Meanwhile, a blocking maximum extends from the Ural Mountains to Lake Baikal (Fig. 2b). Therefore, we primarily focus on blockings over central Siberia where the blocking center should be in this region on the peak day (i.e., maximum B index). A total of 60 blocking events are identified over central Siberia during July and August. Since blocking events identified in terms of B index exhibit various RWB features (Tyrlis and Hoskins, 2008; Masato et al., 2012, 2013),we use the direction of breaking (DB) index to separate blockings into AWB and CWB blocking groups. The daily DB index is calculated in terms of zonal gradients of the areal average θ around the blocking center, as derived by Masato et al. (2012) and expressed as
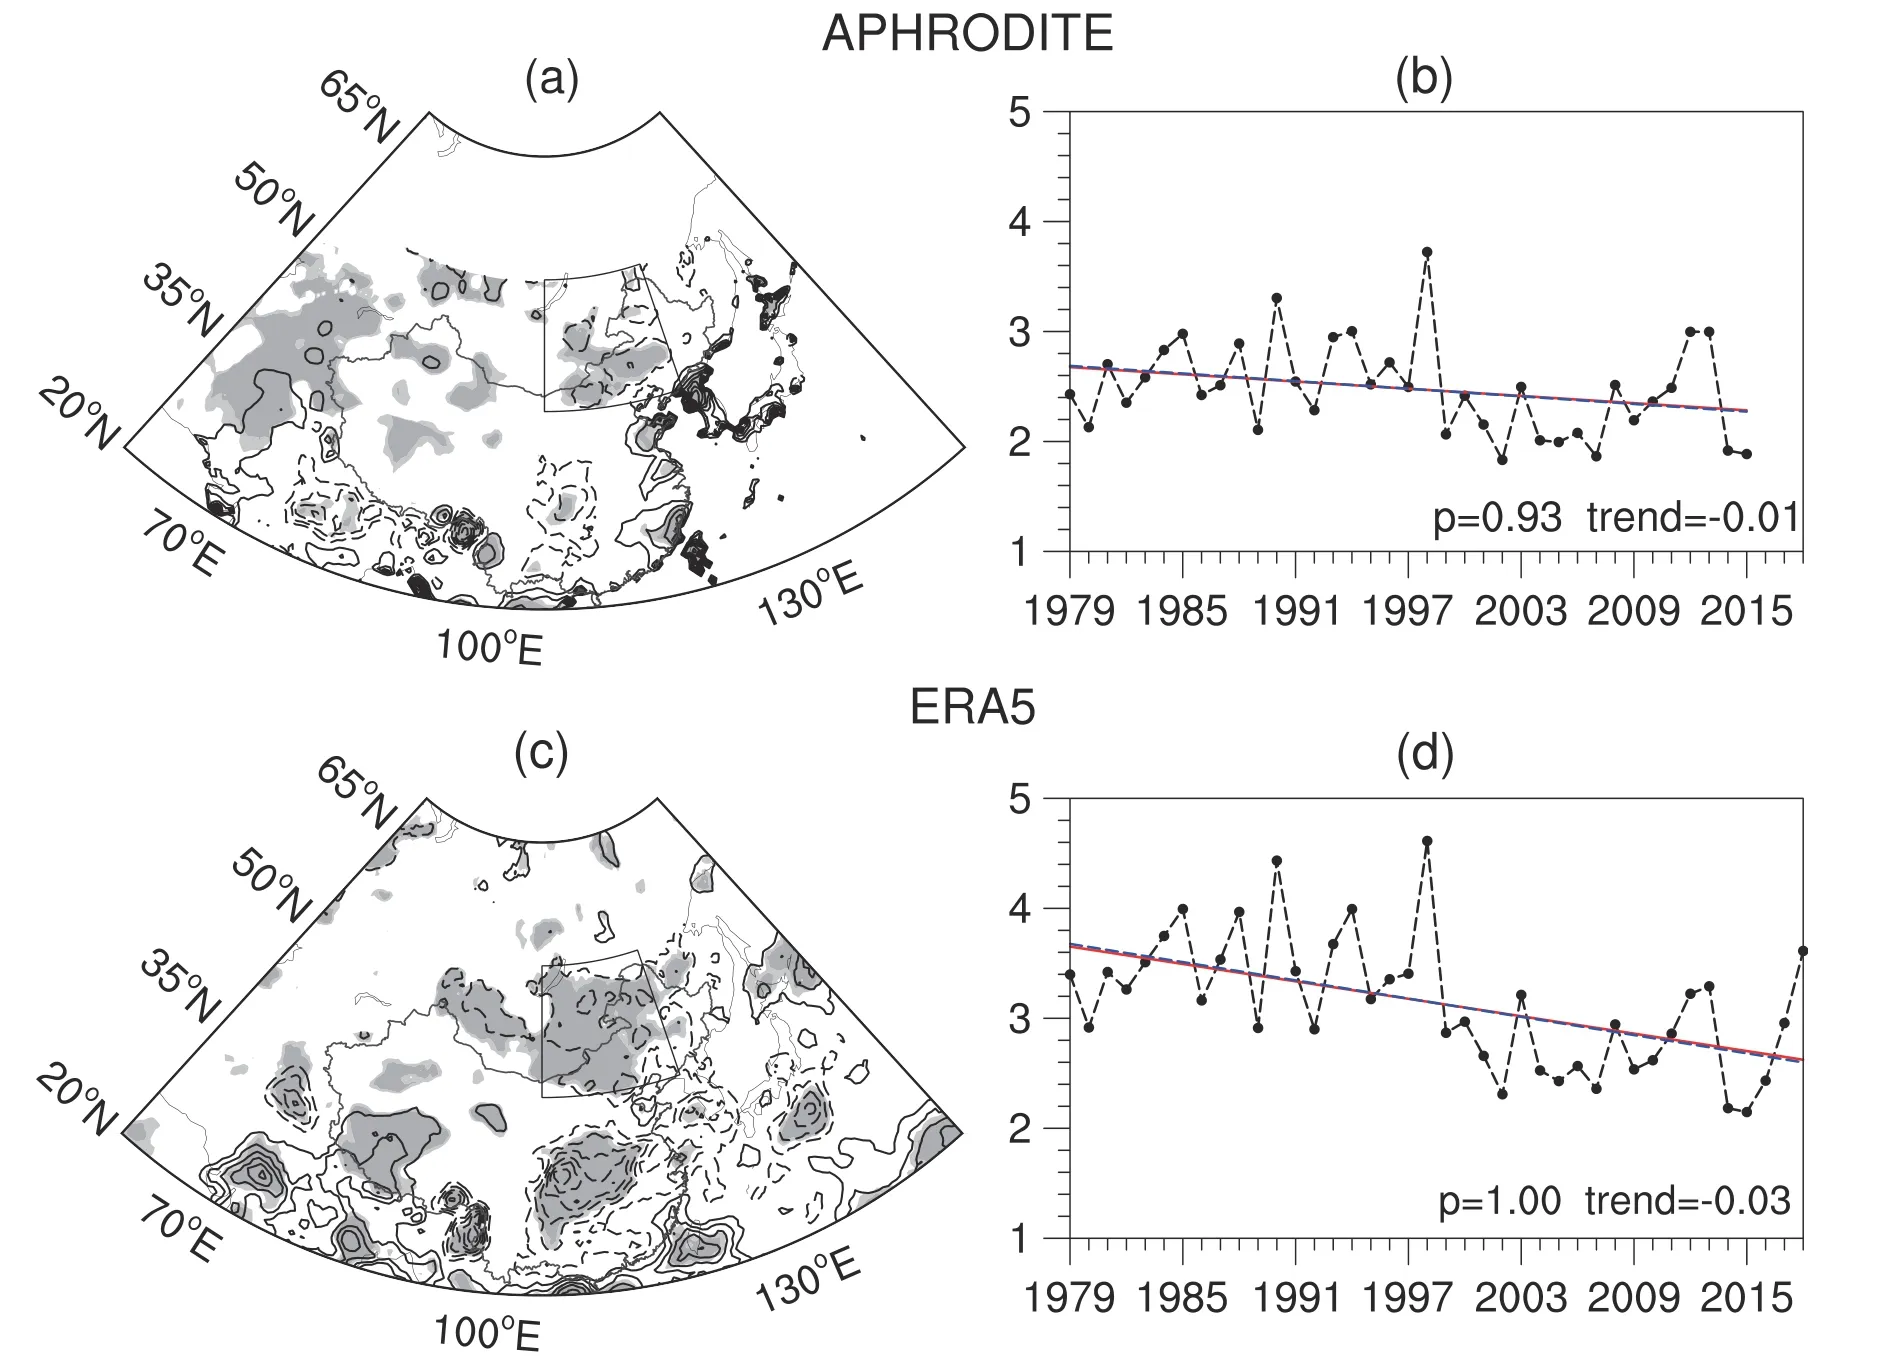
Fig. 1. (a) Spatial distributions of linear trends of precipitation and (b) trends and time series of areal-averaged precipitation within a box encompassing (40°-55°N, 105°-125°E) based on APHRODITE data. Dark (Light) shading in (a) indicates statistical significance above the 95% (90%) confidence level. The red lines in (a) represent the linear regressions, and the blue dashed line is the Theil-Sen estimate of the linear trend. (c, d) As in (a, b), but for ERA5.

where λcand φcrepresent the longitude and latitude of the blocking center, respectively, and Δλ is 2.5°. The instantaneous DB index is normalized by the standard deviation of all DB values when the B index is positive (e.g., during the blocking event). It has been noted that the orientation of a blocking event can change during its lifetime, particularly over Asia (Masato et al., 2012; Shi et al., 2016). Here, we use the temporal average of the DB index during each blocking event to represent the primary RWB feature of the blocking event. A blocking event is considered to be an AWB feature with an average DB index of no less than 0.2, while a CWB signature has an average DB index of no more than-0.2. Otherwise, it is defined as a neutral blocking. We adopt this threshold from Masato et al. (2012), who showed that the classification result is less sensitive to the threshold within a few decimals of variation. The numbers of AWB,CWB and neutral blockings are 18, 29 and 13, respectively.The present study mainly discusses the AWB and CWB blocking groups shown in Tables 1 and 2.
To test the sensitivity of the choice of blocking events,we adopt the blocking index defined by Tibaldi and Molteni (1990), which is characterized by reversed meridional 500-hPa geopotential height gradients around 60°N. As pointed out by Pelly and Hoskins (2003) and Jin et al. (2009),this blocking index has a deficiency in identifying blockings due to the fixed reference latitude. Therefore, we extend the reference latitude to 45°-70°N for every 5° to calculate the southern and northern eight-day low-pass filtered 500-hPa geopotential height gradients (GHGS and GHGN)for each longitude as follows:
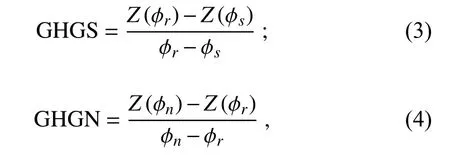
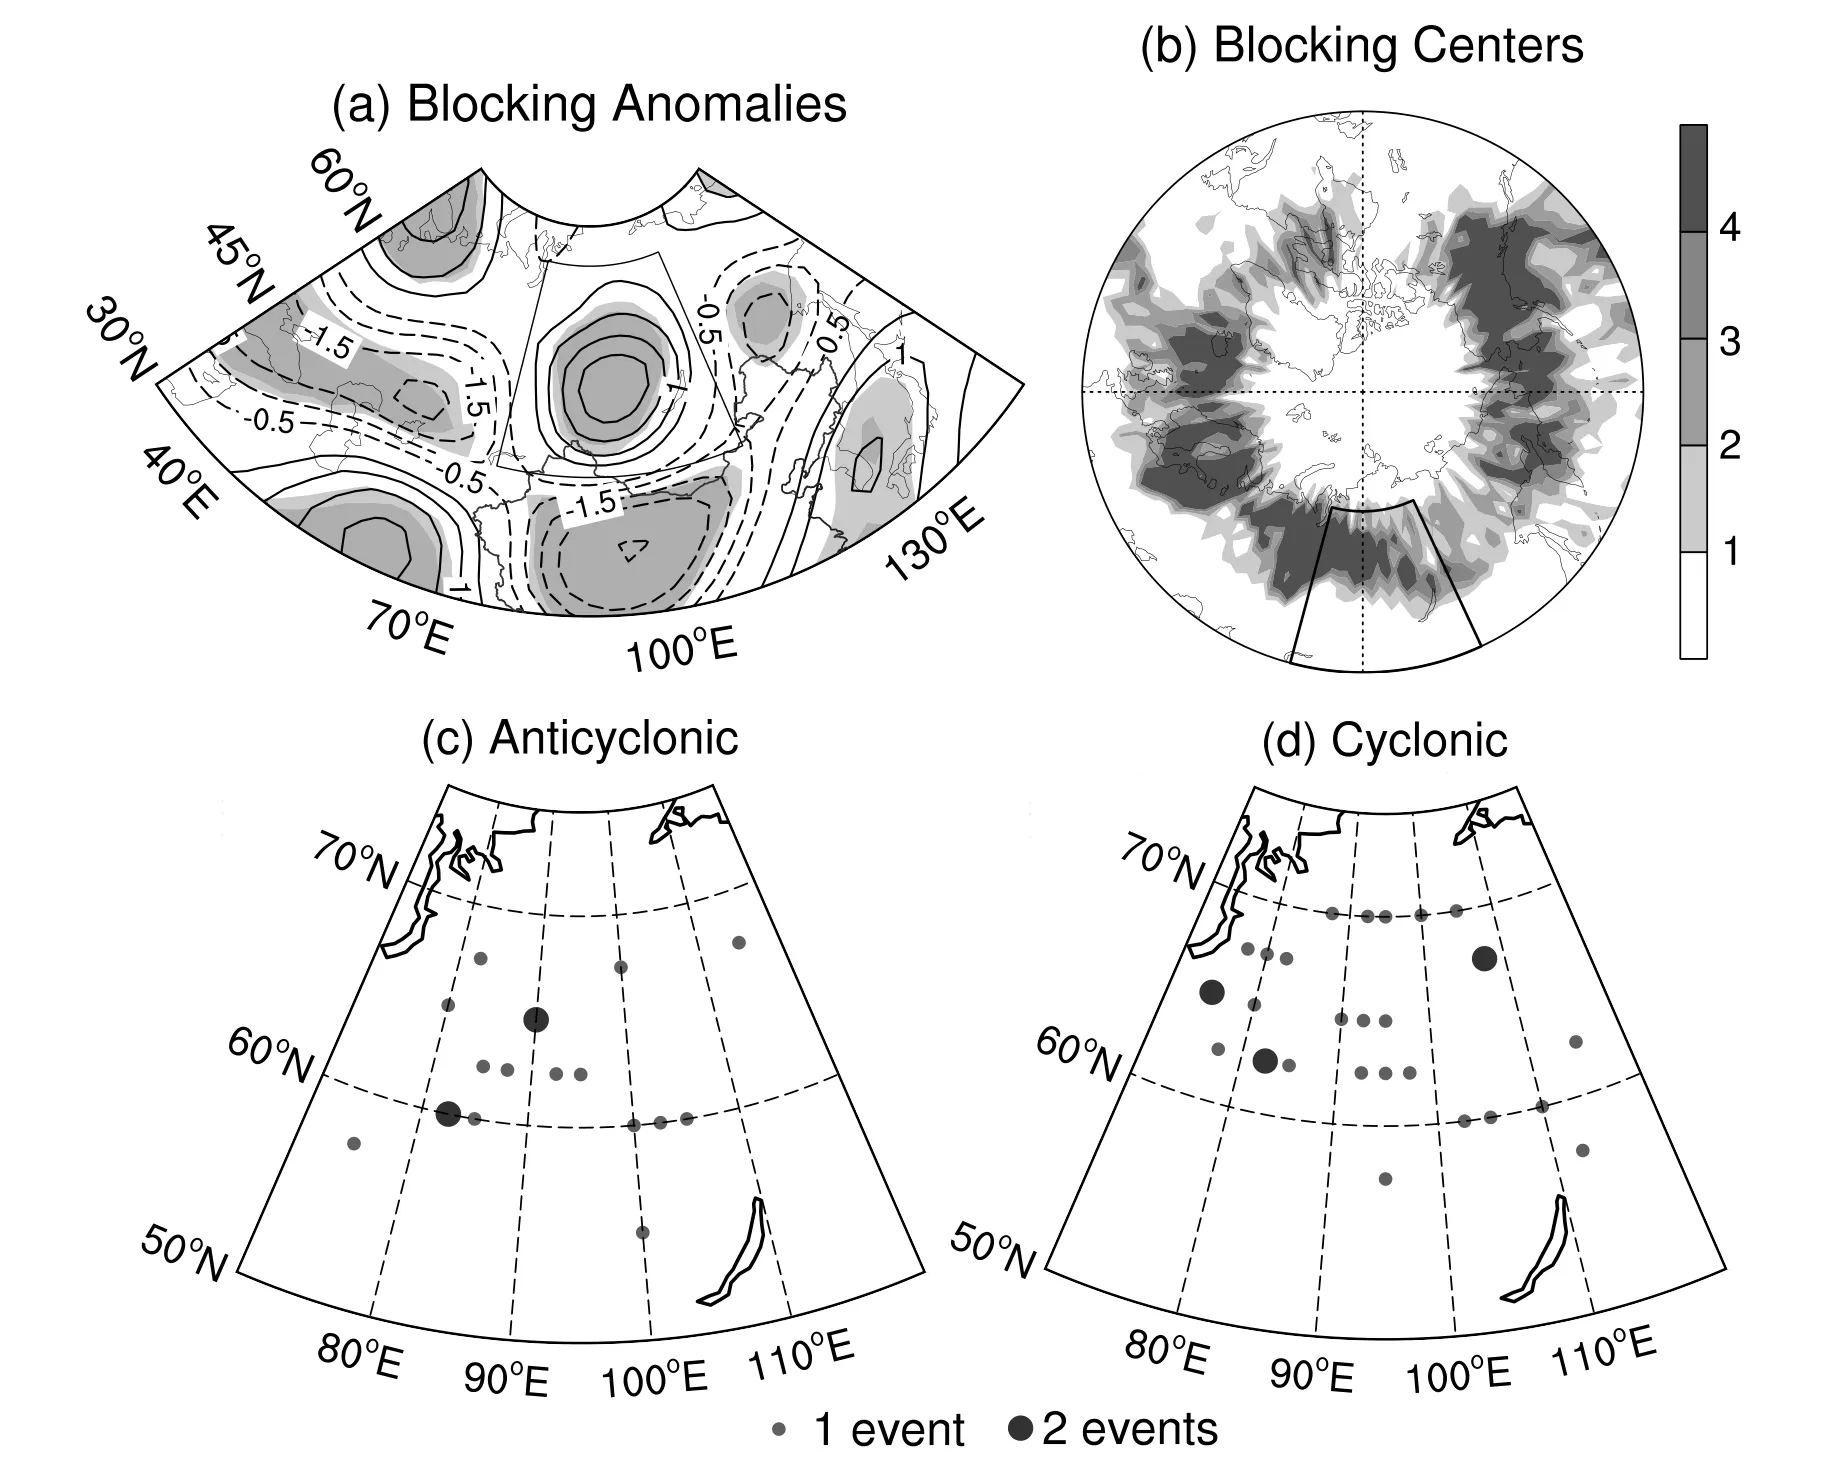
Fig. 2. (a) Map of B index anomalies regressed against the standardized areal-averaged precipitation within the box in Figs. 1a and b. Dark (Light) shading indicates statistical significance above the 95% (90%)confidence level. (b) Distribution of RWB blocking centers in July and August (1979-2018). A nine-point smoothing is used and the polygon designates the region of central Siberia. (c, d) The distribution of blocking centers on the peak day for (c) AWB and (d) CWB blocking events over central Siberia.
where φn=75°N+Δ, φr=60°N+Δ, φs=45°N+Δ, and Δ=-15°,-10°, -5°, 0°, 5° or 10°. A given longitude is considered to be blocked and assigned to be 1 if GHGS > 0 and GHGN <-10 for any 5° of latitude between 45°N and 70°N.
2.3. Wave activity flux
Rossby wave energy propagation is described by the wave activity flux (W) defined by Takaya and Nakamura(2001). The expression of lateral W is

where p is the pressure normalized by 1000 (hPa); U = (U,V) is the horizontal basic flow, which is the 31-day running average of the annual cycle (1979-2018); ψ′ is the streamfunction anomaly calculated from the geopotential according to ψ=φ/f; and u′ and v′ are geostrophic wind velocity perturbations. For each blocking event, daily perturbations are defined by subtracting the corresponding 31-day running mean annual cycle. The wave activity flux is calculated using the composite of the anomalous (u, v) and geostrophic streamfunction. The wave activity flux of the composite assumes that the composite fields represent the primary features of interest. The advantage of W is that it can depict the evolution of large-scale disturbances embedded in a zonally varying basic flow.
3. RWB blocking events over central Siberia
3.1. Precipitation trends and associated blockings
Figure 1 shows the spatial distributions of the linear trends of precipitation and the trends and time series of areal-averaged precipitation in (40°-55°N, 105°-125°E).The long-term trends are assessed by the Theil-Sen estimator, with significance evaluated with the nonparametric Mann-Kendall test (Sneyers, 1990). Significant decreasing trends in the average of precipitation during July and August are seen in the southeastern Lake Baikal area, including eastern Mongolia and northeastern and central China,while evident increasing trends are observed over the eastern coast of China (Fig. 1a). The increasing trend over southeastern Lake Baikal coincides with the decreased principal component of the first leading mode with above-normal pre-cipitation over Mongolia and Northeast China in Antokhina et al. (2019). As the downward trends are more prevalent over southeastern Lake Baikal, we define a box encompassing (40°-55°N, 105°-125°E). The areal-averaged precipitation within the box also exhibits an evident decreasing trend (Fig. 1b). The trends of ERA5 precipitation are basically consistent with those of APHRODITE but with more pronounced amplitudes (Figs. 1c and d). The decreasing trends dominate over southeastern Lake Baikal and central China.Meanwhile, the areal-averaged precipitation within the box exhibits more evident decreasing trends.
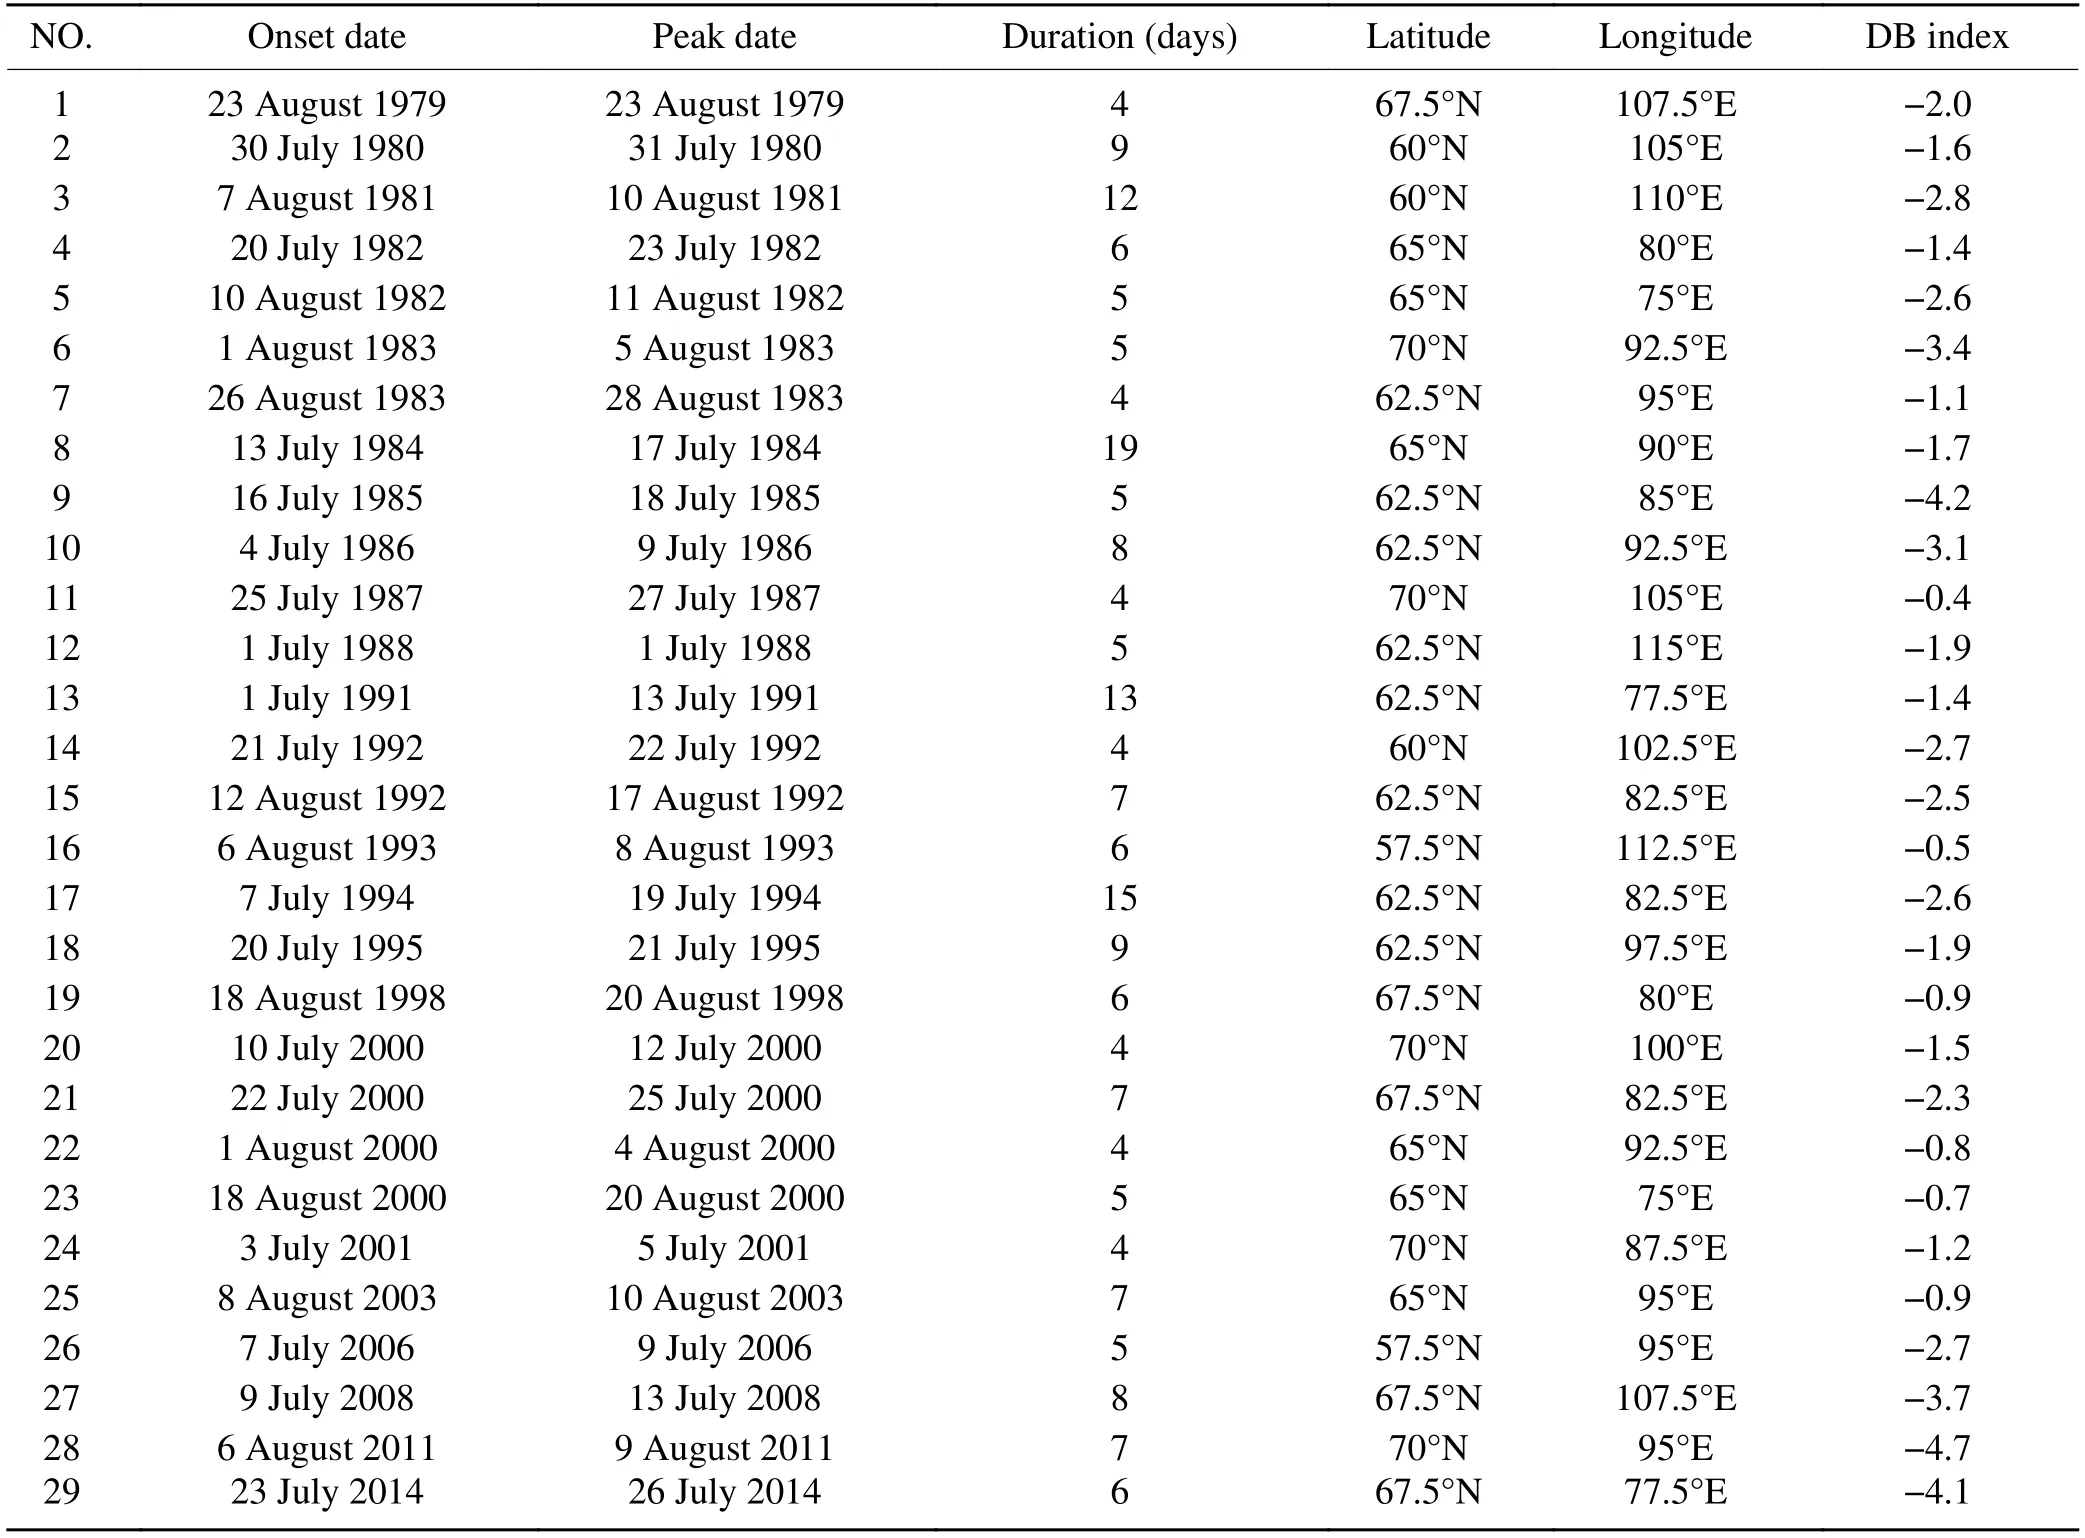
Table 2. As in Table 1, but for CWB blocking events.
To investigate the blocking influence on the precipitation in southeastern Lake Baikal, we regress the B index on to the standardized areal-averaged precipitation within the box in Figs. 1a and c and display the map of B anomaly in Fig. 2a. There is an evident dipole pattern, with a positive B anomaly over central Siberia and a negative one over northwestern China. The positive B anomaly suggests that high blocking occurrence over central Siberia increases the precipitation over the southeastern Lake Baikal area. This dipole pattern of blocking occurrence agrees with the dipole pattern of the 500-hPa geopotential height anomaly and blocking occurrence frequency around Lake Baikal associated with elevated precipitation over Inner Mongolia (Li et al., 2016;Bueh et al., 2016; Antokhina et al., 2019).
Tables 1 and 2 list the onset and peak dates, center positions on the peak days and DB indices of the RWB blocking events over central Siberia, and Figs. 2b-d display the geographic distribution of blocking centers. The lifetimes of AWB blocking events (5.5 days on average) tend to be shorter than those of CWB blocking events (7 days on average).Both AWB and CWB blocking events are likely to occur in July. The climatological blocking frequency distribution generally agrees with prior studies with alternative identification methods (Fig. 2b) (e.g., Diao et al., 2006). AWB blocking events mainly occur in the center of central Siberia,while CWB blocking events are evenly distributed over central Siberia (Figs. 2c and d). The scattered blocking distribution could lead to sparse significance in the composite.Most RWB blocking events are also detected by the blocking index defined by Tibaldi and Molteni (1990), except two AWB and four CWB blocking events (Fig. 3). By examining the synoptic chart (not shown), these six events are indeed RWB blocking events, which might be attributable to the relatively sharper features of potential temperature or potential vorticity in depicting the blockings (Hoskins et al.,1985; Pelly and Hoskins, 2003).
3.2. AWB blocking circulation features
Figure 4 shows the composite temporal evol ution of the 2-PVU potential temperature and 300-hPa circulation fields for AWB blocking events. Hereafter, for brevity, day 0 represents the peak day of a blocking event (i.e., the day with maximum B index), and days -N and N represent N days before and after day 0, respectively. The Student's t-test is used to assess the statistical significance of composite anomalies(Wilks, 2006). The wave activity fluxes calculated from the 1.5° × 1.5° grid quantitively agree with those from the 2.5° ×2.5° grid (not shown). Therefore, we use the 2.5° × 2.5° grid to depict the circulations and associated dynamical quantities. From days -6 to -4 (Figs. 4a and b), the potential temperature field on the dynamic tropopause features cold temperatures intruding southward over central Siberia from the sub-Arctic region, with warm temperatures amplifying weakly over the region from the Ural Mountains to the Kara Sea.From day -2 to 0 (Figs. 4c and d), the warm ridge over the Kara Sea leans southeastward with isolated warm air over northwestern central Siberia, while moderate closed cold air detaches from the further southward incursion of the cold trough over central Siberia. This warm and cold potential temperature pair exhibits an evident reversal of meridional temperature gradient, and thus an AWB signature over central Siberia. To the east, a warm ridge amplifies over Northeast China. At day 2 (Fig. 4e), this closed warm and cold potential temperature pair remains over central Siberia with slightly weakened amplitudes.
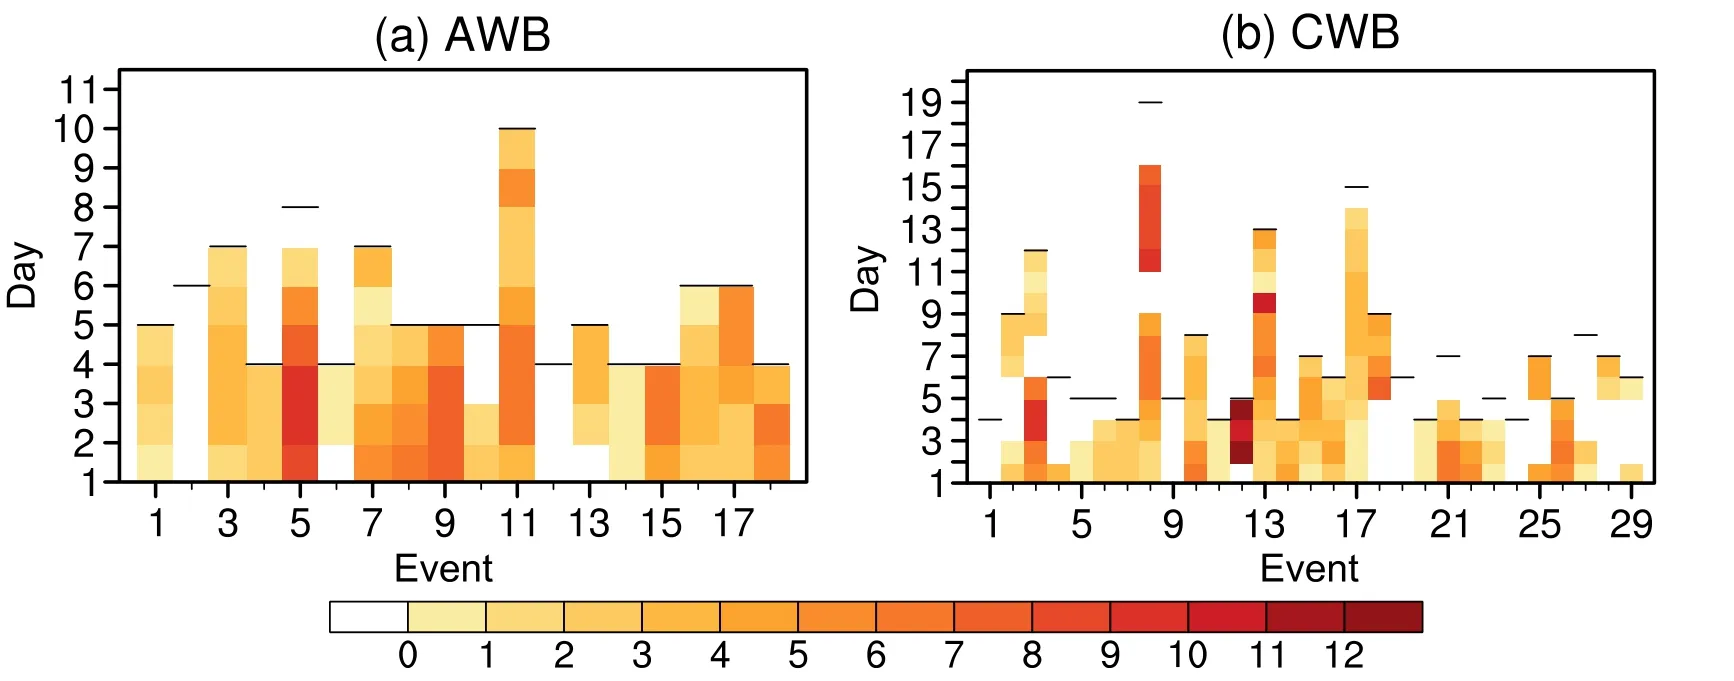
Fig. 3. Areal-averaged blocking occurrence over central Siberia identified using the blocking index defined by Tibaldi and Molteni (1990) for (a) AWB and (b) CWB blocking events. The black line designates the end of each blocking event.

Fig. 4. Composite temporal evolution of 2-PVU potential temperature (units: K) for AWB blocking events on (a) day-6, (b) day -4, (c) day -2, (d) day 0 and (e) day +2. The contour interval is 3 and the polygon designates the region of central Siberia. Dark (Light) shading indicates statistical significance above the 95% (90%) confidence level. (f-j)As in (a-e), but for 300-hPa geopotential height (units: gpm) and the contour interval is 50. (k-o) As in (a-e), but for 300-hPa geopotential height anomalies (contours) and wave activity flux (arrows; units: m2 s-2). The contour interval is 20 and the arrows are plotted where the flux is greater than 1.
The evolution of the 300-hPa geopotential height(Z300) field is consistent with that of the potential temperature field with smoother contours (Figs. 4f-j). The tilted warm ridge and cold trough pair resembles what was found in Bueh and Xie (2015), which favors a cold-air incursion to mid and low latitudes. In comparison with the potential temperature field, there are no evident closed lows or highs over central Siberia from the peak day onward. However,the warm ridge over Northeast China is more pronounced and extends further northward to the Sea of Okhotsk. The anomalous Z300 field is characterized by a quasi-stationary wave train over the Eurasian continent, with Rossby wave energy progressively propagating eastward until day 0(Figs. 4k-n). Therefore, the amplification of a positive anomaly and a negative anomaly over central Siberia is mainly due to the Rossby wave energy from the Scandinavian Peninsula. At day 2 (Fig. 4o), the incoming Rossby wave packets are considerably weakened and Rossby wave packets over central Siberia emit southeastward to the negative height anomaly over northeastern Asia. Therefore, the couplet over central Siberia becomes loosened in its reversal gradient.
3.3. AWB blocking impact on Asian weather
Given the quasi-stationary feature of the Z300 circulation field, we average the 2-m air temperature (T2m) anomalies overlaid with 10-m horizontal wind anomalies from days -4 to -2, -1 to 1, and 2 to 4, which is displayed in Fig. 5.Because the blockings are anchored over central Siberia, we primarily focus on their influence on weather over Asia. Prior to the peak days (Fig. 5a), there is a modest dipole of T2m anomalies over northern Eurasia. A significant warm T2m anomaly elongates meridionally along the Ural Mountains and a cold T2m anomaly resides to the north of Lake Baikal. The warm T2m anomaly is advected by anomalous southerlies, while the cold T2m anomaly is transported by anomalous northerlies. During the peak of blocking events(Fig. 5b), the amplification of AWB circulation intensifies both northerlies and southerlies over central Siberia. As a result, the warm T2m anomaly over the Ural Mountains is strengthened and displaced eastward, while the cold T2m anomaly is reinforced and advected southward from Lake Baikal to the Iran Plateau. In the decaying stage of blocking events (Fig. 5c), the wind anomalies weaken and the warm T2m and cold T2m anomaly pair is substantially weakened over Siberia with a southeastward displacement.The cold T2m anomaly extends from Lake Baikal to Northeast China. To the south, a warm T2m anomaly shifts southeastward from western China to southern China.
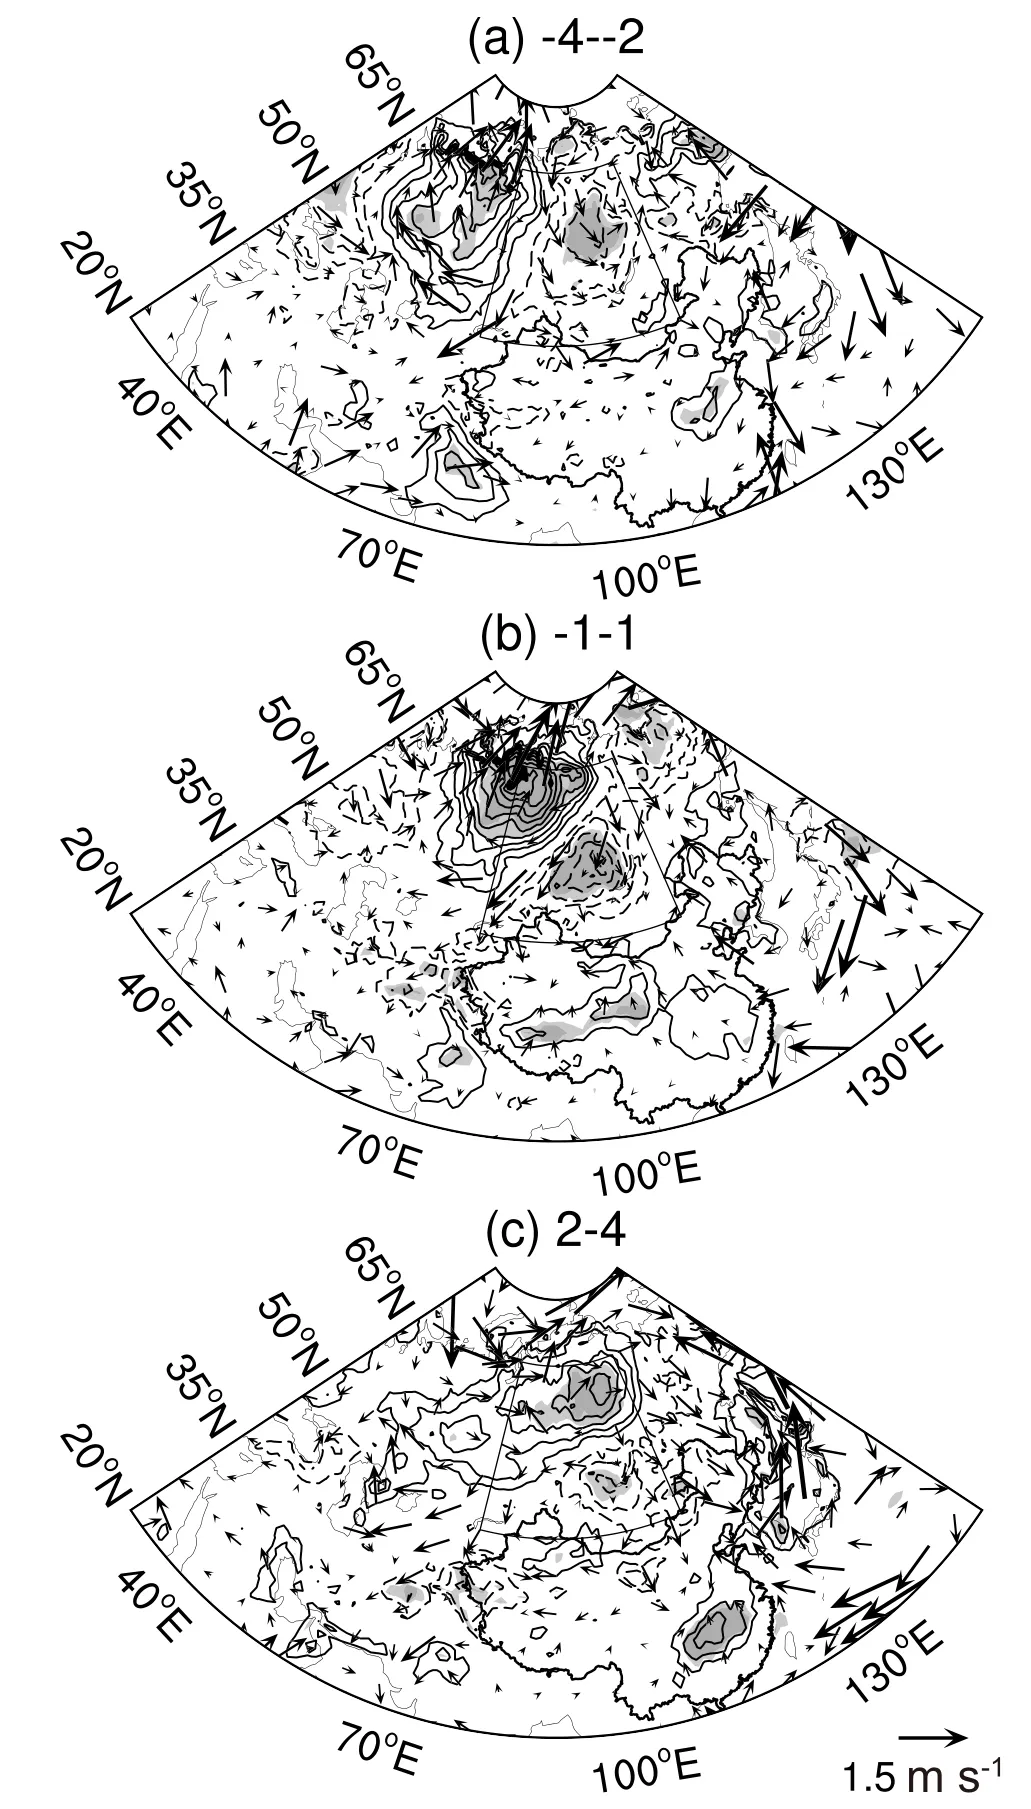
Fig. 5. Composite 2-m air temperature anomalies (contours;units: °C) and 10-m wind anomalies (arrows; units: m s-1)averaged over (a) days -4 to -2, (b) days -1 to 1, and (c) days 2 to 4 for AWB blocking events. The contours are drawn every 0.5 °C. The polygon designates the region of central Siberia.Dark (Light) shading indicates statistical significance above the 95% (90%) confidence level.
Because the precipitation data of APHRODITE in the Middle East and Russia are unavailable after 2007, we calculate the composite precipitation anomalies over the combined area of the monsoon area, the Middle East and Russia for events prior to 2008 in comparison with those of ERA5. The composite anomalous fields are nearly consistent between the two datasets (not shown). Figure 6 displays the composite temporal evolution of precipitation anomalies and anomalous water vapor fluxes with dates in accordance with the T2m field. The distribution of precipitation anomaly fields generally agrees with that of temperature anomaly fields. Prior to the peak of blocking events (Figs. 6a and d), an evident negative precipitation anomaly is seen to the east of the Ural Mountains and a negative anomaly is observed over northwestern China, to the east of the warm temperature anomalies and positive height anomalies (Figs. 5a and 4g-h). In addition, weak decreased precipitation is discernible over central China. During the peak of blocking events (Figs. 6b and e), the negative rainfall anomaly over the Ural Mountains extends eastward to central Siberia. The negative anomaly over northwestern China extends northward to western Mongolia. Meanwhile, increased rainfall prevails from northern China and eastern Mongolia to the Yakutsk region. In the decaying stage (Figs. 6c and f), the rainfall anomaly pattern is displaced eastward with respect to that in the peak period. The increased rainfall is prevalent from northeastern China to the Sea of Okhotsk, which is to the east of the weak cold T2m anomalies (Fig. 5c). Therefore, AWB blocking is favorable for cold air masses accumulating over Lake Baikal, and thus an increase in regional rainfall. Considering the anomalous water vapor fluxes, the negative precipitation anomaly over central Siberia lies within anticyclonic water vapor fluxes and is overlaid with divergent water vapor fluxes in its southeast (Figs. 6g-i). In contrast,southward anomalous water vapor fluxes from the Arctic and northwestward anomalous water vapor fluxes from the Sea of Japan and the Yellow Sea converge over the region from Mongolia to the Yakutsk region, which is favorable for increased rainfall in-situ.
3.4. CWB blocking circulation features
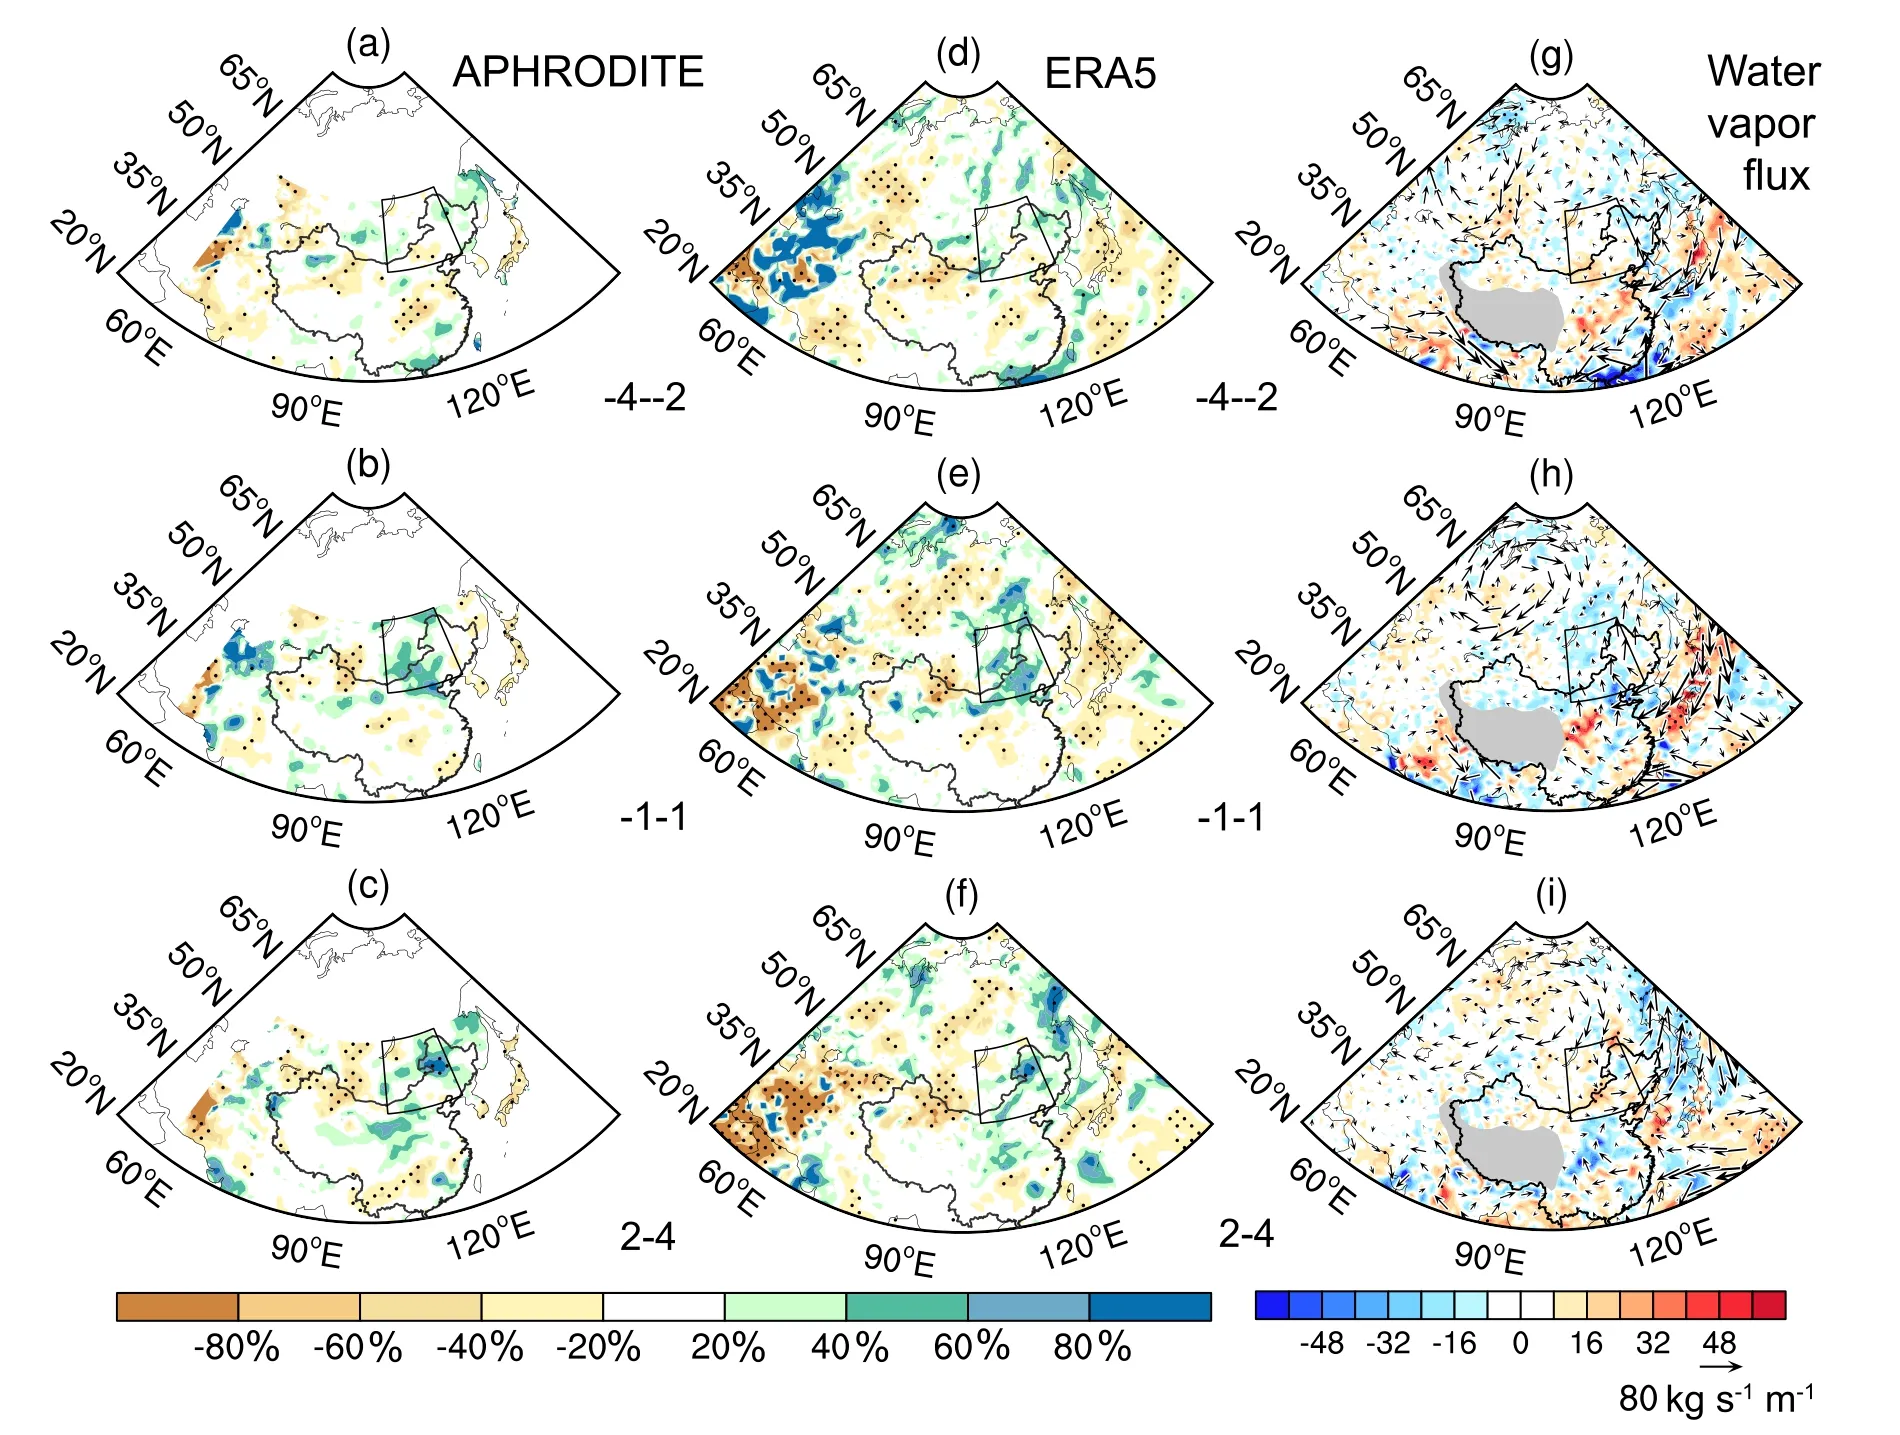
Fig. 6. Composite precipitation anomalies (units: %) from APHRODITE averaged over (a) days -4 to -2, (b) days-1 to 1, and (c) days 2 to 4 of AWB blocking events, in which the polygon designates the southeastern Lake Baikal area. (d-f) As in (a-c), but for ERA5. (g-i) As in (a-c) but for vertically integrated water vapor fluxes (arrows; units:10-6 m kg s-1 kg-1) and the corresponding divergence field (shading; units: kg s-1 kg-1). The stippling marks the regions with statistical significance above the 90% confidence level.
A parallel composite diagnostic analysis of CWB blocking events is provided in Figs. 7-9. As can be seen from Fig. 7, an evident cold trough deepens from the Kara Sea and leans anticlockwise toward Lake Baikal, while a warm ridge intensifies and displaces northwestward from the Yakutsk region to the Taymyr Peninsula. This pairing of an equatorward incursion of cold air and a poleward invasion of warm air exhibits an evident CWB feature. To the upstream,an evident warm ridge resides over the Scandinavian Peninsula, i.e., in front of the trough, prior to the peak of blockings that advect cold anomalies to deepen the trough. In comparison with AWB events, the reverse of temperature gradients and geopotential heights in CWB events exhibits larger-scale, meridional and more anisotropic features. Given the more anisotropic feature of CWB blocking circulation,the anomalies experience a stronger barotropic deformation that requires more time to be isotropic in comparison with those of AWB events (Bueh et al., 2018; Xie et al., 2019).The amplification of the cold trough and warm ridge can also be attributed to the Rossby wave packets with more evident incoming energy than that of AWB blocking events.These differences could result in a longer duration of CWB blocking events compared with AWB blocking events.
3.5. CWB blocking impact on Asian weather
In concert with the difference in Z300 circulation between AWB and CWB blocking events, the cold T2m anomaly of CWB blocking events is more extensive and with stronger amplitudes due to the more extended and deepened trough (Figs. 8 and 9). An extensive cold T2m anomaly is accumulated over the western Siberian plain and then advected southeastward to the region from Lake Baikal to northwestern China. Meanwhile, a warm T2m anomaly lies in the Yakutsk region prior to the peak of blocking events, and is then enhanced by southeasterly anomalies. However, the warm anomaly weakens drastically during the decaying period of blocking events.
Compared to AWB blocking events, CWB blocking events feature a sandwich-like pattern with increased precipitation in central Siberia and decreased precipitation in northeastern Asian and northern China (Figs. 9a-f). In contrast to AWB blocking events, the southeastern Lake Baikal area is dominated by decreased rainfall, except in the decaying period of CWB blocking events (Figs. 9a-f). The above-normal precipitation is intensified over central Siberia and displaced to the east of Lake Baikal, which corresponds to the incursion of the cold air anomaly (Figs. 8 and 9a, b, d and e).Meanwhile, the noted subnormal precipitation is intensified over northeastern Asia, while the other one is amplified and extended from northern China to Mongolia. In the decaying period of blocking events, the sandwich-like pattern is substantially weakened, with moderate above-normal precipitation to the east of Lake Baikal, in front of the cold air anomaly (Figs. 8c, 9c and f). Compared with AWB blocking events, pronounced water vapor fluxes directing from the Arctic and the Sea of the Okhotsk converge over central Siberia (Figs. 9g and h). In the decaying period of blocking events, the cold cyclonic anomaly over Lake Baikal favors the northward water fluxes converging over Lake Baikal(Figs. 7o, 8c and 9i).
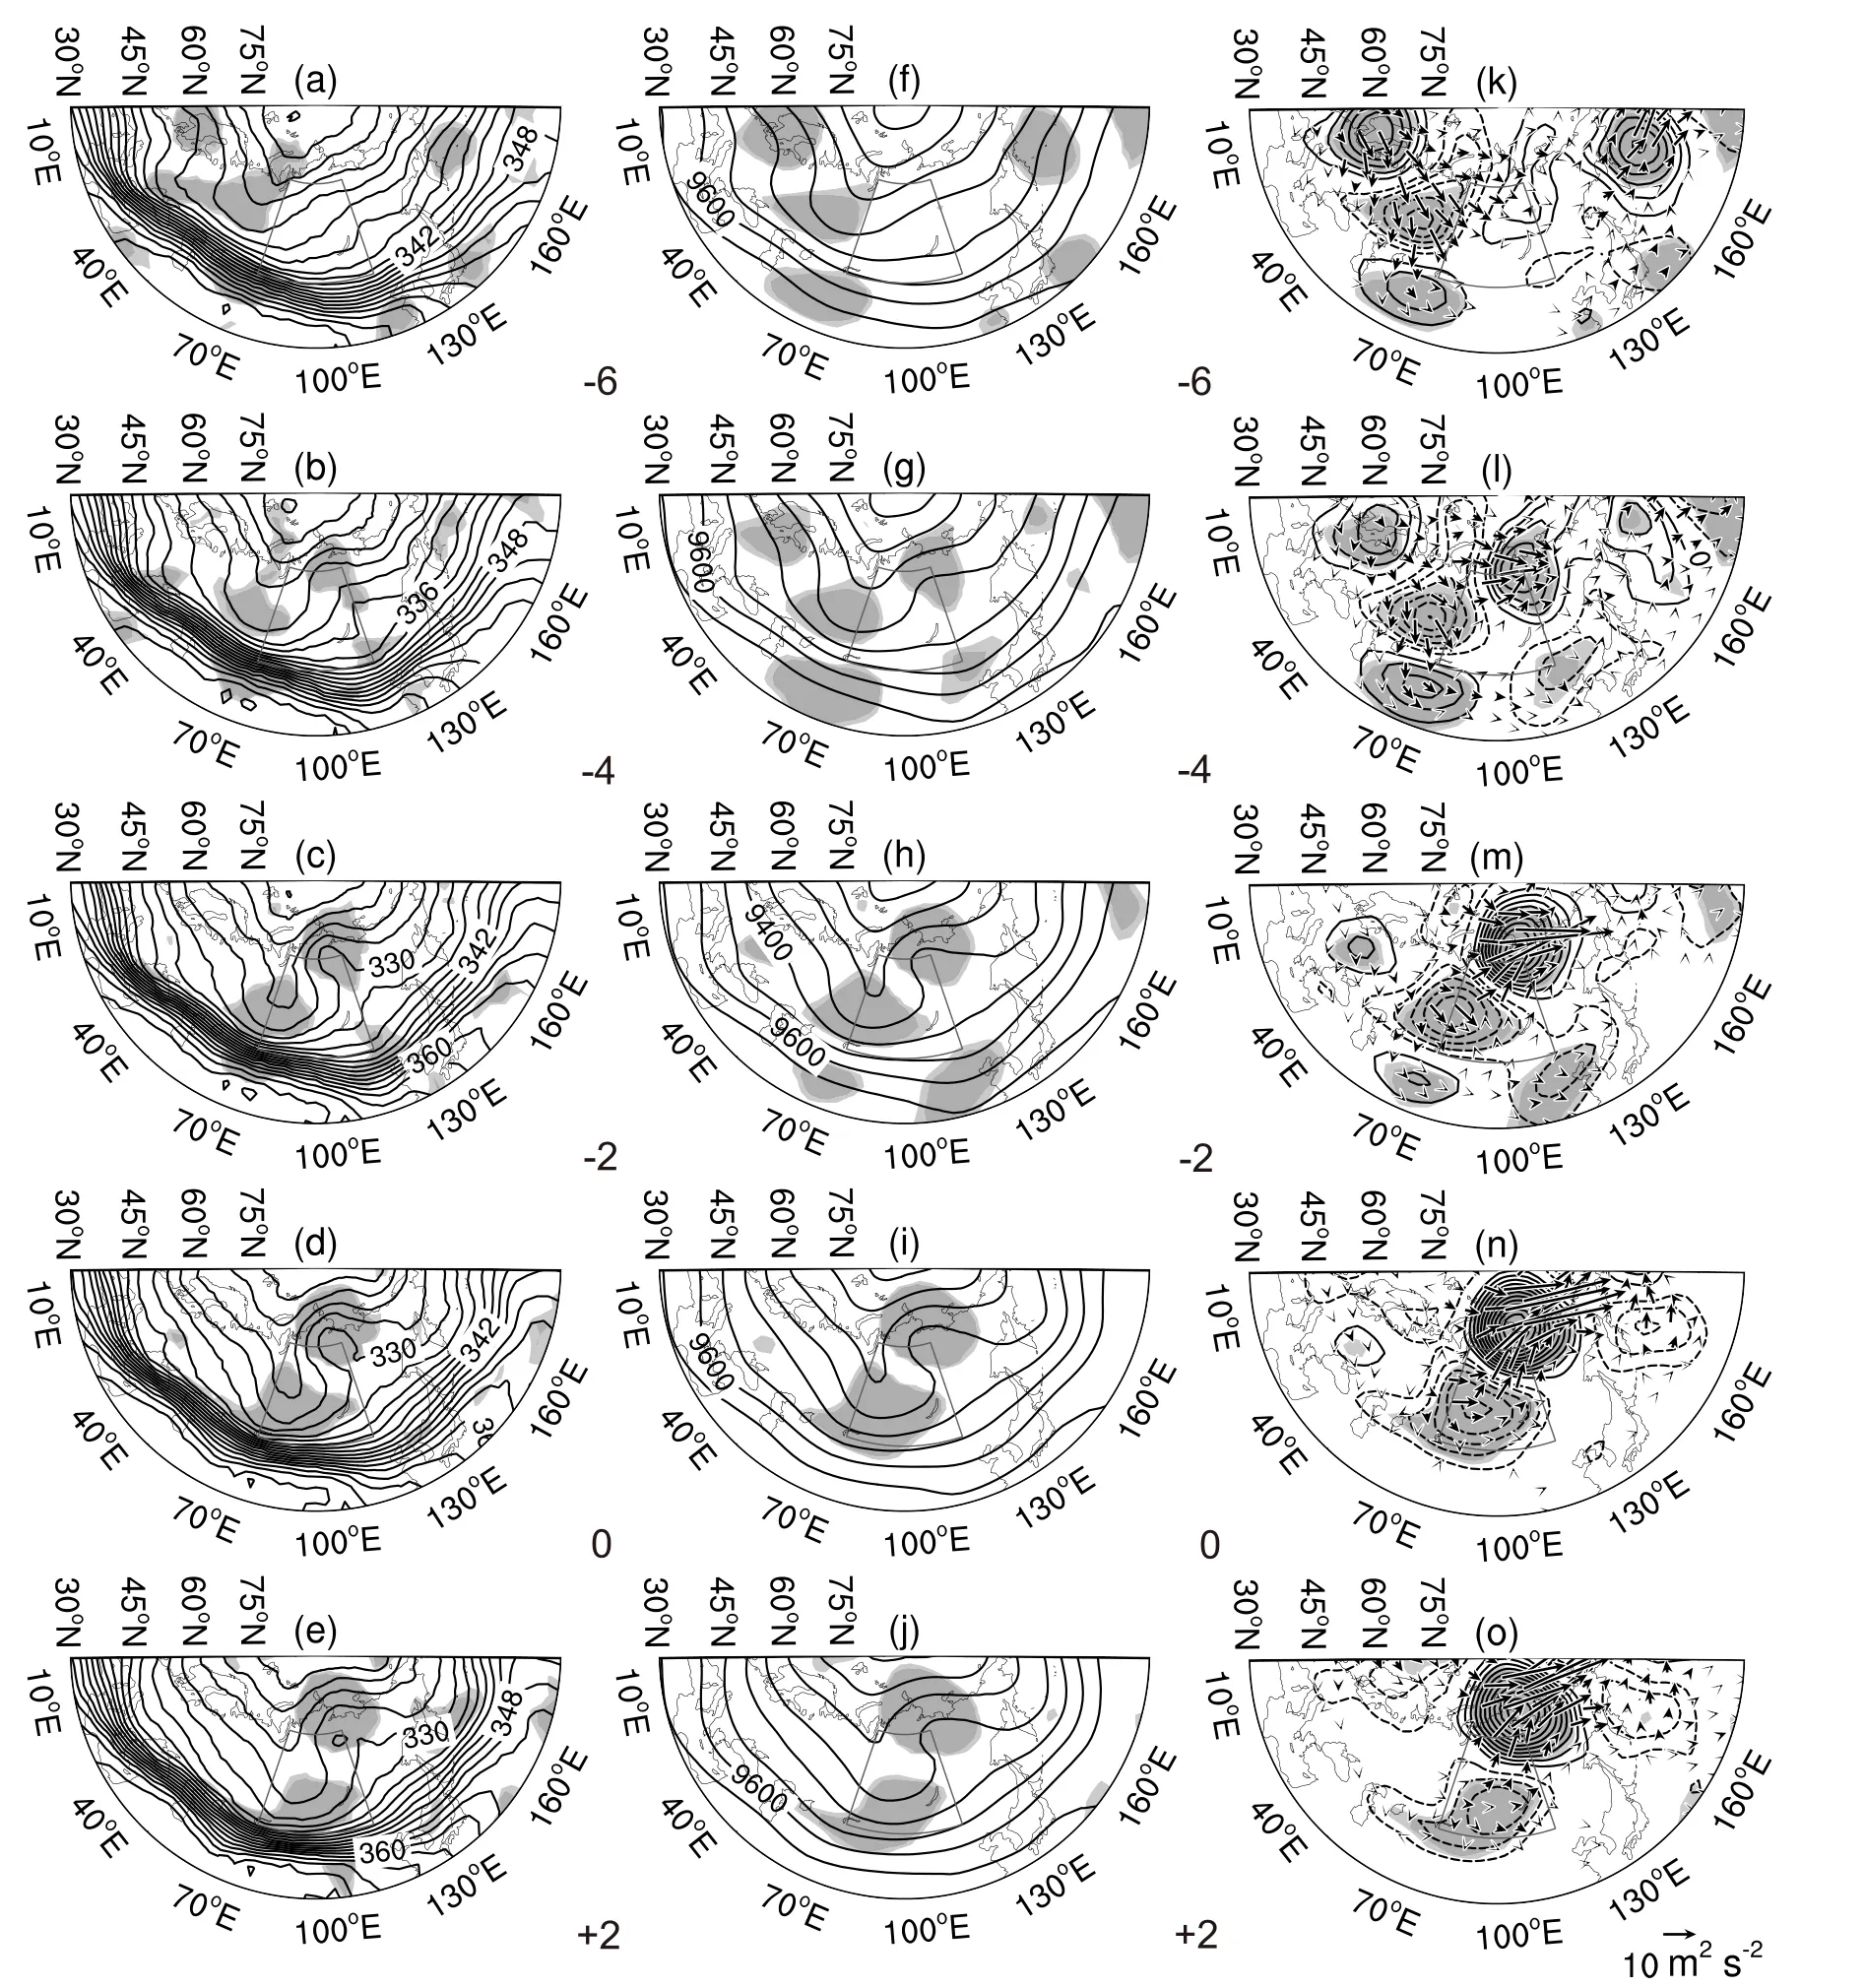
Fig. 7. As in Fig. 4, but for CWB blocking events.
4. Influence on climatological precipitation
Both the climate and synoptic analysis show that blocking events over central Siberia relate closely to precipitation over southeastern Lake Baikal. To investigate the contribution of RWB blocking events to the downward precipitation trend in the southeastern Lake Baikal area, we incorporate blocking events with two and three days. The annual precipitation over southeastern Lake Baikal in July and August is 154.1 mm, in which the annual precipitation associated with AWB and CWB blockings are about 18.3 mm (11.9%)and 27.1 mm (17.6%), respectively. The smaller contribution from AWB blockings is due to the lower AWB blocking occurrence in comparison with CWB blockings. Figure 10 shows the trends and time series of the occurrence frequency of RWB blockings. The AWB blocking occurrence exhibits a significant downward trend. Although a weak decreasing trend is also discernible in the CWB blocking occurrence, it is not significant. The result suggests that the decreasing trend of precipitation over southeastern Lake Baikal can be attributed to the decline in blocking occurrence over central Siberia, particularly AWB blockings.
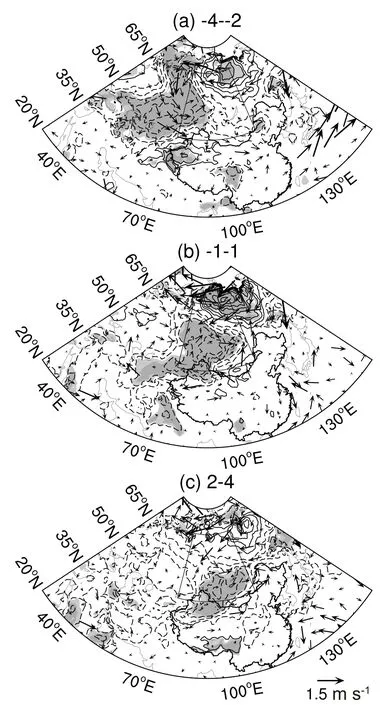
Fig. 8. As in Fig. 5, but for CWB blocking events.
5. Conclusion and discussion
Motivated by the downward precipitation trend in the southeastern Lake Baikal region, this study investigates the formation and maintenance of AWB and CWB blocking events over central Siberia (45°-70°N, 75°-115°E) and their contribution to the decreasing trend of precipitation during the period from 1 July to 31 August over the years 1979-2018. The precipitation experiences a significant decreasing trend over southeastern Lake Baikal and it is closely related to the blocking occurrence over central Siberia. AWB blocking events tend to occur in the center of central Siberia, while CWB blocking events are evenly distributed over central Siberia. AWB and CWB blocking events,on average, persist for 5.5 and 7 days, respectively.
The evolutionary processes for AWB and CWB blocking events are characterized by a cold trough deepening from the sub-Arctic region with different wave train anomalies and energy dispersion. AWB blocking events are preceded by zonal wave train anomalies from the Scandinavian Peninsula to central Siberia. With the incoming Rossby wave packets, a warm ridge amplifies over the region from the Ural Mountains to the Kara Sea and tilts northeastward,while a cold trough deepens and intrudes southward to central Siberia, exhibiting an AWB signature. The northeastsouthwest-oriented ridge over central Siberia favors an invasion of cold surface air temperature from central Siberia via Lake Baikal to Northeast China. In response, increased precipitation is observed over southeastern Lake Baikal in the peak and decaying periods of blocking events, where water vapor fluxes originating from the Arctic and the Sea of Japan and the Yellow Sea converge.
Although CWB blocking events are also associated with a cold trough deepening and intruding southeastward from the Kara Sea to Lake Baikal, the cold trough tilts anticlockwise and a warm ridge amplifies and extends northwestward from the Yakutsk region to the Taymyr Peninsula. An evident warm ridge over the Scandinavian Peninsula conveys cold anomalies to deepen the trough. In comparison with AWB blocking events, the CWB blocking pattern features larger-scale, meridional and more anisotropic anomalies, and thereby greater persistence. In addition, the magnitude of incoming Rossby wave energy is more evident than with AWB blocking events. The corresponding cold surface air temperature anomaly is more extensive and intensive over Siberia. In contrast with AWB blocking events, increased precipitation is distributed over central Siberia,while decreased precipitation dominates the southeastern Lake Baikal area prior to and during the blocking peaks. Moderate above-normal precipitation is seen to the east of Lake Baikal where the cold cyclonic anomaly favors the northward propagation of water vapor fluxes.
Masato et al. (2012, 2013) and Shi et al. (2016) systematically investigated RWB features of blockings in winter and summer, respectively. They noted that different blocking patterns are characterized by distinct Rossby wave energy propagations and exert diverse weather impacts. Noting these differences, this paper reveals that CWB blocking events features larger, meridional and more anisotropic anomalies with more incoming Rossby wave packets that result in more persistent blocking events. Moreover, a novel contribution of this paper is that decreased blocking occurrence, particularly AWB blocking occurrence, over central Siberia contributes to the decreased precipitation over the southeastern Lake Baikal area. Our future research will try to explore these linkages, including the warming trend, in greater detail.
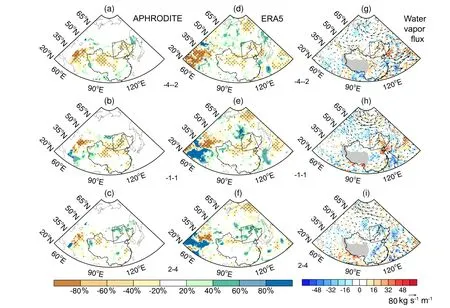
Fig. 9. As in Fig. 6, but for CWB blocking events.

Fig. 10. Time series of (a) AWB and (b) CWB blocking occurrence over central Siberia. The red lines represent the linear regression, and the blue line is the Theil-Sen estimate of the linear trend.
Acknowledgements.The authors are grateful to the two anonymous reviewers for their constructive and helpful suggestions and comments. This work is jointly supported by the National Science and Technology Support Program of China (Grant No.2015BAC03B03) and the National Natural Science Foundation of China (Grant Nos. 41861144014, 41630424 and 41875078). We convey our gratitude to the writers of NCARG Command Language(UCAR/NCAR/CISL/TDD, 2019), which was used to plot the figures. The ERA5 reanalysis data are available at https://cds.climate.copernicus.eu/cdsapp#!/home, and the APHRODITE precipitation data are available at http://aphrodite.st.hirosaki-u.ac.jp/products.html.
杂志排行
Advances in Atmospheric Sciences的其它文章
- Constraining the Emergent Constraints
- Simulations of Microphysics and Precipitation in a Stratiform Cloud Case over Northern China:Comparison of Two Microphysics Schemes
- Improvement of X-Band Polarization Radar Melting Layer Recognition by the Bayesian Method and ITS Impact on Hydrometeor Classification
- Non-Gaussian Lagrangian Stochastic Model for Wind Field Simulation in the Surface Layer
- A Hybrid Statistical-Dynamical Downscaling of Air Temperature over Scandinavia Using the WRF Model
- Modeling Arctic Boundary Layer Cloud Streets at Grey-zone Resolutions
