Histone deacetylase inhibitor pre-treatment enhances the efficacy of DNA-interacting chemotherapeutic drugs in gastric cancer
2020-03-13RamchandraVigayAmnekarShafqatAliKhanMudasirRashidBharatKhadeRahulThoratPoonamGeraShaileshShrikhandeDuaneSmootHassanAshktorabSanjayGupta
Ramchandra Vigay Amnekar, Shafqat Ali Khan, Mudasir Rashid, Bharat Khade, Rahul Thorat, Poonam Gera,Shailesh V Shrikhande, Duane T Smoot, Hassan Ashktorab, Sanjay Gupta
Abstract BACKGROUND The prognosis of gastric cancer continues to remain poor, and epigenetic drugs like histone deacetylase inhibitors (HDACi) have been envisaged as potential therapeutic agents. Nevertheless, clinical trials are facing issues with toxicity and efficacy against solid tumors, which may be partly due to the lack of patient stratification for effective treatments.AIM To study the need of patient stratification before HDACi treatment, and the efficacy of pre-treatment of HDACi as a chemotherapeutic drug sensitizer.METHODS The expression activity of class 1 HDACs and histone acetylation was examined in human gastric cancer cells and tissues. The potential combinatorial regime of HDACi and chemotherapy drugs was defined on the basis of observed drug binding assays, chromatin remodeling and cell death.RESULTS In the present study, the data suggest that the differential increase in HDAC activity and the expression of class 1 HDACs are associated with hypoacetylation of histone proteins in tumors compared to normal adjacent mucosa tissue samples of gastric cancer. The data highlights for the first time that pretreatment of HDACi results in an increased amount of DNA-bound drugs associated with enhanced histone acetylation, chromatin relaxation and cell cycle arrest. Fraction-affected plots and combination index-based analysis show that pre-HDACi chemo drug combinatorial regimes, including valproic acid with cisplatin or oxaliplatin and trichostatin A with epirubicin, exhibit synergism with maximum cytotoxic potential due to higher cell death at low combined doses in gastric cancer cell lines.CONCLUSION Expression or activity of class 1 HDACs among gastric cancer patients present an effective approach for patient stratification. Furthermore, HDACi therapy in pretreatment regimes is more effective with chemotherapy drugs, and may aid in predicting individual patient prognosis.
Key words: Chemotherapy; Combinatorial index; Gastric cancer; Histone acetylation;Histone deacetylase inhibitor; Patient stratification
INTRODUCTION
Gastric cancer (GC) is the 3rdleading cause of cancer deaths, 5thin terms of incidence in the world, and the most lethal cancer in Asia[1]. In India, it is one of the most aggressive cancers, ranking 5thin terms of incidence and mortality. The management of GC is multimodal, including surgical R0 resection, radiotherapy and chemotherapy. Based on multiple clinical trials, commonly used drug combinations for neoadjuvant and adjuvant chemotherapy (NACT and ACT) in GC involves drugs such as cisplatin, oxaliplatin and epirubicin, which exert their cytotoxic effects by binding to DNA[2,3]. Earlier reports have shown that inhibitors of chromatin remodelers, such as valproic acid and butyric acid, increase the efficacy of chemotherapeutic drugs[4-6].
Post-translational modifications of histone proteins are one of the major epigenetic mechanisms regulating chromatin conformations[7]. Acetylation of histones has been the most studied, and has been shown to positively correlate with chromatin relaxation. The dynamic equilibrium between histone acetyltransferases (HATs) and histone deacetylases (HDACs) dictates the acetylation levels and transcriptional status of chromatin[8]. Alterations in the levels of several histone acetylation marks such as H3K12ac, H3K18ac, H3K9ac and H4K16ac have been reported in multiple cancers,such as liver, kidney, prostate, breast and stomach[9]. Moreover, aberrant expression of HATs like CBP and p300, and HDACs like HDAC1 and HDAC2, has been observed in several malignancies[9]. These findings have led to the exponential growth in research on HAT inhibitors (HATi) and HDAC inhibitors (HDACi), and their anticancer properties. HATi, like E-7438 and EPZ-5676, are in phase II and phase I clinical trials, respectively; also, sodium butyrate is in phase II, and panobinostat and valproic acid (VPA) are in phase III clinical trials. Additionally, HDACi, like vorinostat(SAHA) and romidepsin, is now FDA approved for cancer treatment[10]. Importantly,studies have shown that HDACi can modulate cellular responses through different mechanisms, such as re-expression of tumor suppressors, transporters of chemotherapeutic drugs[11], enzymes associated with drug metabolism[12], and enhancing the levels of open chromatin[13]. HDACis have shown to have potential therapeutic benefits, predominantly in advanced hematologic malignancies, more so as combinatorial chemotherapy than as single agents; however, clinical responses are disappointing in solid tumors[14,15]. Marchio et al[16]'s study suggested the use of HDACi(SAHA) as a chemo-sensitizer that increases the efficiency of epirubicin in breast cancer. To overcome the limitation of HDACi in solid tumors, the identification of synergistic combinations of selective HDACi with other chemotherapeutic drugs,along with patient stratification based on HDAC levels, is a must and would help to both minimize toxicity and predict the response to treatment.
In the present study, we show a strong association between global histone hypoacetylation with increased HDAC activity in human GC tissue samples and cell lines.Differential activity and expression levels of class 1 HDACs in patient samples and TCGA data highlight the importance of patient stratification for treatment with HDACi. Interestingly, the pre-treatment regime of HDACi followed by chemotherapeutic drugs exerts synergistic effects in GC cells and pre-clinical studies.
MATERIALS AND METHODS
Patient and tissue samples
Paired frozen tissue samples from normal adjacent gastric mucosa (negative resection margin) and tumors were collected from GC patients through the tumor tissue repository of ACTREC and the Tata Memorial Hospital, Mumbai, India. The protocol was reviewed and approved by the institutional review board and ethics committee.Written informed consent was undertaken from all patients. Based on histopathological analysis by a blinded pathologist, the tumor content was found to be > 60% in all tumor samples.
Cell lines and culture conditions
The AGS GC cell line (CRL 1739) was procured from ATCC, and the HFE145 cell line was provided by DTS and AH. The cell lines were cultured in RPMI1640 (Invitrogen)media with 10% fetal bovine serum and maintained at 37 °C with 5% CO2and 100 U/mL penicillin, 100 mg/mL streptomycin (Himedia).
Histone deacetylase inhibitors and chemotherapeutic drugs
HDACi, sodium valproate (VPA; Sigma, P4543), trichostatin A (TSA; Sigma, T8552)and suberoylanilide hydroxamic acid (SAHA; Sigma, SML0061) were dissolved in ethanol to prepare stock solutions. The chemotherapeutic drugs cisplatin(Calbiochem, 232120), oxaliplatin (Sigma, O9512) and epirubicin (Calbiochem, 324905)were dissolved in DMSO to prepare stock solutions. As per the experimental requirements, cells were treated with different concentrations of HDACi and chemotherapeutic drugs.
Cell viability assay
Cell viability was quantified by MTT assay (Sigma, M2128) as per the manufacturer's protocol. AGS cells (about 1000) were used for the assay, the absorbance was measured at 570 nm, and cell viability was expressed as the percentage of absorbance obtained compared to control cultures.
Analysis of histone post-translational modifications
Histones were extracted, resolved on an 18% SDS-PAGE gel and transferred to a PVDF membrane[17]. Western blotting with the respective antibodies was carried out as per the manufacturer's protocol (H3, Millipore #05-499; H4, Millipore #07-108;H3K9ac, Millipore #06-599; H3K18ac, Millipore #07-354; H3K27ac, Abcam #4729;H3K16ac, Millipore #07-329; γH2AX, Millipore #05-636; H3ac, Millipore #06-599;H4ac, Millipore #06-866). The signal was visualized using the ECL plus chemiluminescence kit (Millipore #WBKLS0500).
Histone acetyl-transferase and histone deacetylase assays
Nucleo-cytosolic fractions (NCF) from human GC tissues and cell lines were prepared as per the manufacturer's instructions (Biovision, K332-100 and K331-100). Protein lysates, cell lines (50 μg) and tissues (100 μg) were used for calorimetric-based assays.The absorbance was measured at A440 and A405 for HAT and HDAC, respectively,and the average absorbance was plotted.
Drug-DNA interaction assay
AGS cells treated with chemotherapeutic drugs with or without different combinations of HDAC inhibitors were washed in chilled PBS and lysed in nuclei isolation buffer (10 mmol/L HEPES pH 7.9, 1.5 mmol/L MgCl2, 10 mmol/L KCl, 0.5 mmol/L DTT, 0.1% v/v NP-40, 2 mmol/L EDTA, 1 mmol/L EGTA, 0.15 mmol/L spermine, 0.5 mmol/L spermidine, 1 mmol/L sodium orthovanadate, 10 mmol/L sodium fluoride, 10 mmol/L β-Glycerophosphate, 0.2 mmol/L PMSF). The lysate was centrifuged at 5000 rpm for 10 min at 4 °C. The nuclear pellet obtained was lysed in 200 μL 5 mol/L urea-2 mol/L NaCl solution to estimate the DNA concentration at 260 nm. DNA concentration was adjusted to 1 μg/mL, and an equal volume was taken to measure the concentration of DNA-bound cisplatin, oxaliplatin and epirubicin at 220,205 and 254 nm, respectively, as per European Pharmacopoiea 5.5[18]. The absorbance was considered to be directly proportional to the amount of DNA bound to drug. The mean absorbance of three independent experiments was plotted for the chemotherapeutic drugs.
Fraction-affected curve analysis
Fraction-affected (FA) curves, a method for growth inhibition analysis, was carried out with cell survival percentage values obtained through three independent MTT assays. Fraction-affected values representing the percentages of cell death were calculated using the following formula:
FA value = 1—(% cell survival/100). FA values ranged from 0.01 to 0.99);CompuSyn software was used to further assist in these calculations, which is based on the Chao Tally's algorithm[19]. FA values and respective doses of the drugs were used to generate FA curves.
Median effect plot analysis
The median effect plot shows the combination index (CI) on the Y-axis and FA values on the X-axis. For a particular FA value, CI values range from 0 to 1; CI < 0.8, CI = 0.8-1.2, and CI > 1.2 represents the synergistic, additive or antagonistic nature of drug combinations, respectively. FA values and total doses of drug combinations(chemotherapeutic drugs and HDACi) were used to generate median effect plots with the help of CompuSyn software[19].
Chromatin organization assay
Purified nuclei from control and VPA-treated AGS cells were subjected to micrococcal nuclease (MNase) digestion to analyze chromatin organization as per the published protocol[20].
Expression of HDACs in GC cell lines
RNA was extracted by TRIzol method (Invitrogen, 5596026), and cDNA was synthesized as per the manufacture's protocol (Thermo scientific, K1632).Quantitative PCR using SYBER green (Agilent Tech, 600882) was employed, and the primers used are listed in Table 1. Data analysis was performed using ΔΔCt-based calculations, and fold changes were plotted for the different HDAC genes. The data were statistically analyzed by performing student t-tests.
Cell cycle analysis
Different phases of the cell cycle were determined by flow cytometry as previously described in[20]. The data were analyzed using ModFit LN 2.0 software.
In vivo therapeutic potential of drug treatments in a tumor model
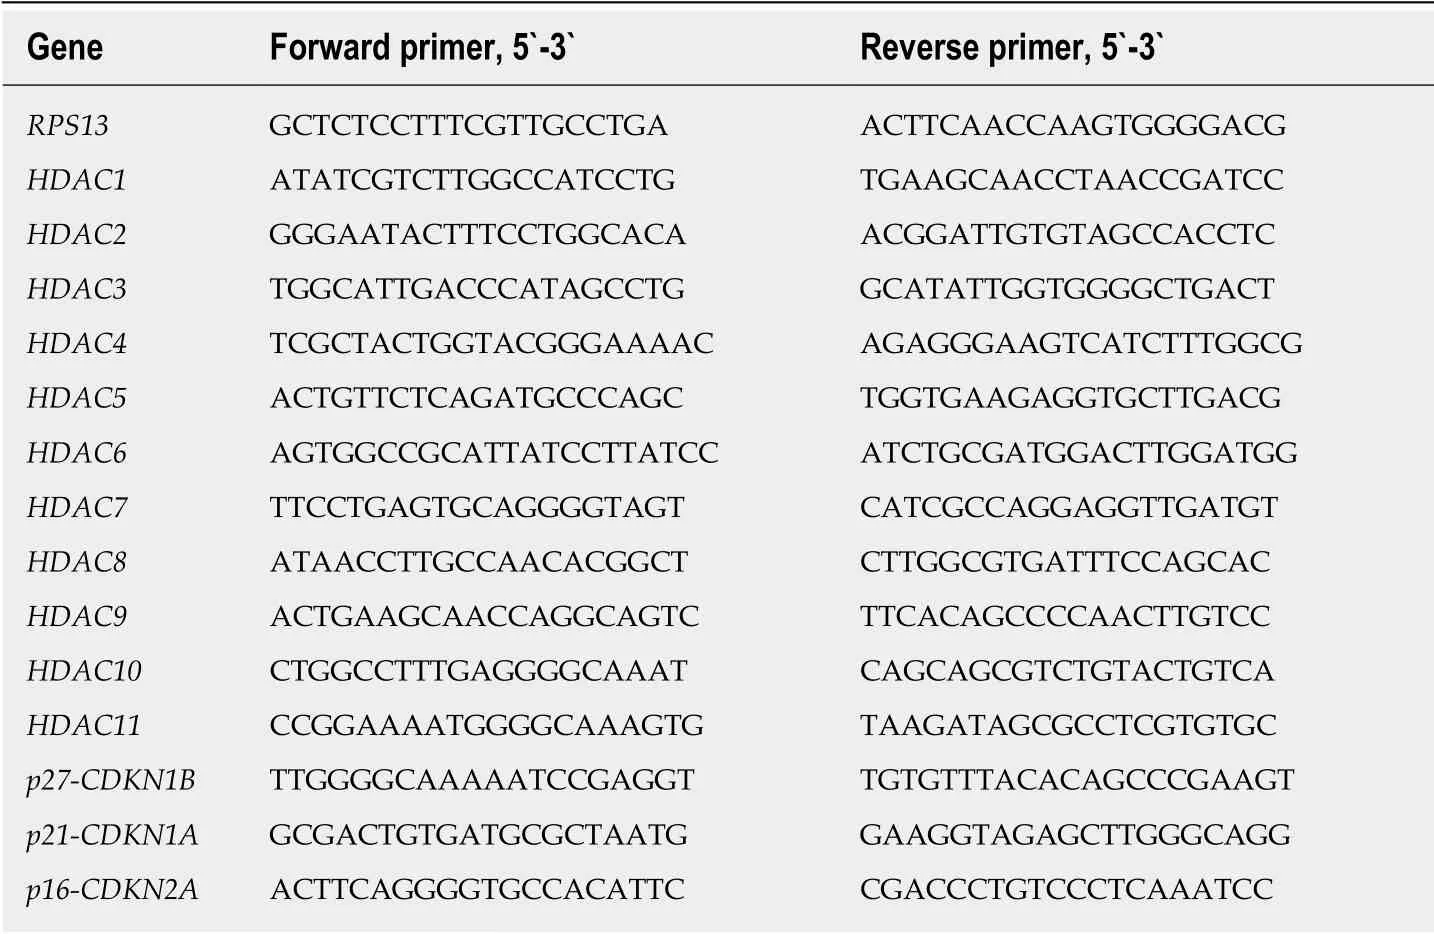
Table 1 List of primers used for carrying out real-time PCR on different genes
To study the in vivo therapeutic potential of a pre-treatment regime of VPA and cisplatin in an AGS cell-based xenograft model was developed after approval from the institutional animal ethics committee. AGS cells (approximately 5 × 10⁶) were subcutaneously injected with matrigel (50 μL) in NOD-SCID mice (4-6 wk). After one round of serial transplantation, the mice bearing tumors of approximately 6-10 mm maximum length were randomly divided into four groups: (1) Control; (2) VPA (300 mg/kg/d); (3) Cisplatin (2 mg/kg/d); and (4) Combinatorial pre-treatment group(VPA followed by cisplatin, with doses as mentioned above). Drugs or saline (control group) were administered intraperitoneally twice a week at an interval of 2 d for 6 wk. For the combinatorial regime, cisplatin was administered following 24 h of VPA treatment.
Tumor size and weight was monitored once a week by measuring two perpendicular tumor diameters with a caliper, and volume was calculated as V = π /6 × length × width2. The outcome of the different treatment regimens was statistically validated by performing unpaired t-tests. The animals were sacrificed, tissue was fixed in formalin, and 4-6 μm sections were processed with hematoxylin and eosin staining for histopathological analysis.
In silico analysis of TCGA data for class1 HDACs in GC patients
Normalized human gastric adenocarcinoma (n = 415) data (Z-score, cutoff > 1.5) of HDAC1, HDAC2, HDAC3 were downloaded from the cBioPortal website(http://www.cbioportal.org/)[21,22]. The samples were categorized into high and low expression groups according to the Z-score, and then tabulated.
RESULTS
Hypo-acetylation associates with high histone deacetylase activity in GC patient samples
Histones were prepared from paired tumor and negative resection margin (RM)tissues, and subjected to immunoblot analysis to assess the level of acetylation using anti-acetyl lysine antibodies [Figure 1A(a)]. Immunoblot analysis showed low levels of histone H3 and H4 acetylation in the tumor tissues compared to RM tissues. This observed loss in acetylation levels of histone H3 and H4 could be the result of low histone acetyl-transferase (HAT) or high histone deacetylase (HDAC) activity in tumor tissues. Therefore, NCF was used to assess HAT and HDAC activity using calorimetric assays. Tumor and RM tissues showed differential levels of HAT and HDAC activity; however, all the tumor tissues showed high HDAC activity compared to their paired RM tissues, but HAT activity did not show any consistent pattern (Supplementary Figure 1). Further, statistical analysis showed a significantly higher level of HDAC activity in tumor compared to negative RM (P < 0.001) [Figure 1A(b)];however, no significant difference was found in HAT activity. Taken together, our data suggested an inverse correlation between HDAC activity and histone acetylation in GC.
The major reasons for HDACi failure in solid tumors may be attributed to expression or activity heterogeneity in class 1 HDACs of patients. To understand the need of patient stratification for HDACi therapy, we analyzed HDAC activity and found that it significantly differs among GC patients (Figure 1B). TCGA was analyzed for the expression of class 1 HDAC viz HDAC1, HDAC2 and HDAC3 in gastric adenocarcinoma patients (n = 415) versus control (n = 35), and categorized into high and low expression groups according to the Z-score. HDAC1, HDAC2 and HDAC3 were upregulated in only approximately 24% of gastric adenocarcinoma patients(Figure 1C). Further, in coherence with activity, expression levels also showed differentially increased levels of HDAC 1 and 3 compared to normal gastric tissue(Figure 1D). Altogether, these data provide evidence for patient stratification, and for tailoring the dose of HDACi for (re)sensitizing tumors to the anti-proliferative effects of chemotherapeutic drugs at reduced doses with minimal side effects.
Pre-treatment with HDACi enhances binding of chemotherapeutic drugs to chromatin
It has been hypothesized that HDACi mediates chromatin relaxation, which may enhance the amount of chemotherapeutic drugs bound to DNA. To understand this,histone acetylation and class 1 HDAC levels were determined in AGS and HFE145 cell lines. A decrease in site-specific histone acetylation at H3K9ac, H3K18ac, H3K27ac was observed [Figure 2A(a)], along with increased HDAC activity [Figure 2A(b)] and levels of class 1 HDACs 1, 2 and other HDACs 8, 10, 11 [Figure 2A(c)] in transformed AGS cells. The AGS cell line reflects the human gastric tumor state, and was therefore used for further studies. Dose response curves for chemotherapy drugs and HDACi showed IC50s of 12 μmol/L, 10 μmol/L and 0.2 μmol/L for cisplatin, oxaliplatin and epirubicin, respectively (Supplementary Figure 2A), whereas for HDACi, the IC50 concentrations of VPA, TSA and SAHA were found to be 4 mmol/L, 2 μmol/L and 0.01 μmol/L, respectively (Supplementary Figure 2B). Further, we confirmed HDACi activity by treating AGS cells with IC50 doses for 24 h, and assessing HDAC activity and histone acetylation levels. A decrease in HDAC activity (Supplementary Figure 2C) with hyperacetylation of histones H3 and H4 (Supplementary Figure 2D) were observed upon HDACi treatment. Taken together, our data confirm that the HDACi used in our study is functionally active, and alters both HDAC activity and histone acetylation.
AGS cells treated with HDACi and chemotherapeutic drugs at IC50 values in three different combinations (Figure 2B): (1) Pre- (24 h HDACi treatment followed by 24 h chemotherapeutic drug treatment); (2) Concurrent (24 h HDACi and chemotherapeutic drug together); and (3) Post- (24 h chemotherapeutic drug treatment followed by 24 h HDACi treatment) showed that the quantity of DNA-bound chemotherapeutic drugs significantly increased with pre- followed by concurrent regimes. However, post-treatment did not show any significant increase compared to control for all three HDACis (Figure 2C).
HDACi-dependent sensitization of GC cells decreases the dose of chemotherapeutic drugs to attain maximum efficacy
The effect of regime-specific combinatorial treatment of HDACi and chemotherapeutic drugs on cell death was studied using FA plot analysis (Figure 3)[23].MTT assays were performed using a fixed constant ratio of chemotherapeutic drugs,and in three different combination regimes: Concurrent, pre- and post- (Supplementary Table 1). The data showed that pre-treatment with the three HDACis led to more cell death compared to concurrent or post-treatment in combination with cisplatin(Figure 3A), oxaliplatin (Figure 3B) and epirubicin (Figure 3C). Further, the combined doses of chemotherapeutic drugs and HDACi required to achieve FA values of 0.5,0.75 and 0.95 was analyzed (Table 2). The pre-treatment regime of VPA with cisplatin required lesser combined doses to achieve FA 0.5, 0.75 and 0.95 compared to both concurrent and post-treatment regimes. However, pre-treatment of TSA or SAHA with cisplatin could only attain FA values of 0.5 and 0.75 at a lower combined dose than concurrent or post-treatment combinations. In the case of oxaliplatin, pretreatment with only VPA attained FA values of 0.5, 0.75 and 0.95; whereas, TSA and SAHA achieved only FA values of 0.5 at lower combined doses than the concurrent or post-treatment regimes. In the case of epirubicin, pre-treatment with TSA was found to be most effective, achieving FA values of 0.5 and 0.75 at lesser doses, followed by SAHA. Overall, cell death by cisplatin and oxaliplatin is effectively enhanced with VPA, and epirubicin with TSA, in the pre-treatment combination regimes.
Synergistic interactions of combinatorial HDACi and chemotherapeutic drug
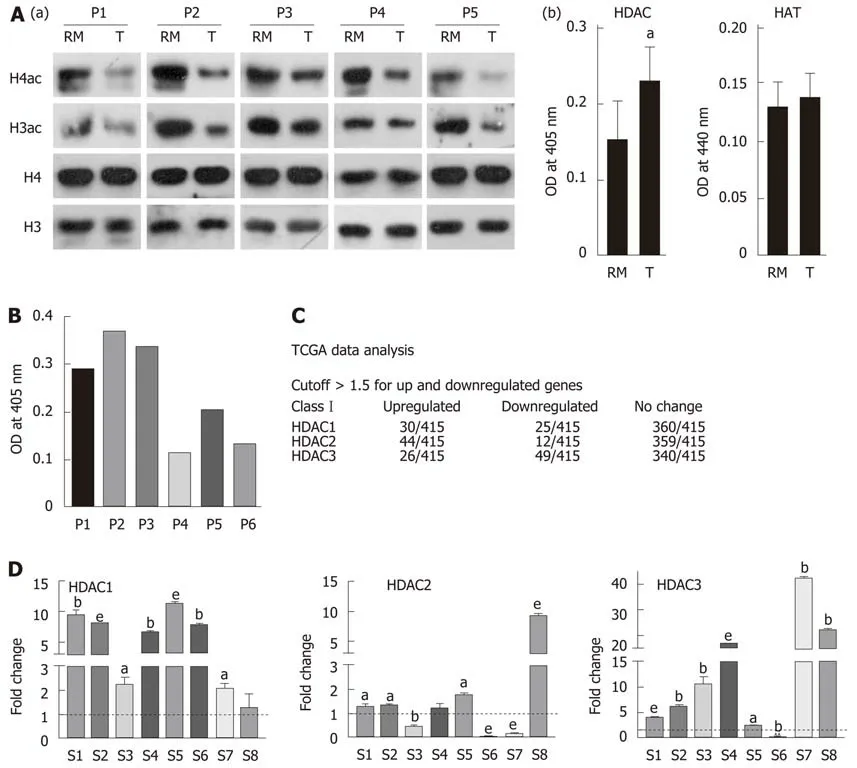
Figure 1 Hypo-acetylation in gastric cancer patient samples is associated with low histone deacetylase activity and transcripts. A: (a) Immunoblot analysis for the comparison of pan-acetyl levels of histone H3 and H4 between paired (n = 5) negative resection margins (RMs) and tumor (T) tissues, and (b) Nucleo-cytosolic fractions were used to compare histone deacetylase (HDAC) and histone acetyltransferase (HAT) levels in paired negative resection margins and tumor tissues using calorimetric assays; B: Differential HDAC activity amongst patients was studied calorimetrically; C: Analysis of The Cancer Genome Atlas data for class 1 HDAC transcript levels in gastric adenocarcinoma patients; D: Expression of Class I HDAC viz HDAC1, HDAC2 and HDAC3 in gastric cancer tumors compared to normal tissue (aP < 0.05; bP < 0.009; eP < 0.0009). GC: Gastric cancer; HDAC: Histone deacetylase; HAT: Histone acetyltransferase; HDAC1: Histone deacetylase 1;HDAC2: Histone deacetylase 2; HDAC3: Histone deacetylase 3; RM: Resection margin; T: Tumor tissues.
treatments depend on regime
In order to assess which combination regimes of chemotherapeutic drugs and HDACi have a synergistic effect, median effect plot was generated using the combined doses of drugs and FA values. The data were quantitatively analyzed using CI at FA levels of 0.5, 0.75 and 0.95 (Figure 4 and Table 2). At an FA value of 0.5, concurrent and precombination regimes of VPA with cisplatin or oxaliplatin, pre-combination of TSA or SAHA with cisplatin, and pre-combination of TSA and epirubicin showed synergistic effects, whereas all other combination regimes showed antagonistic effects. In continuation, at an FA value of 0.75, pre-treatment and concurrent combination regimes of VPA or TSA with cisplatin or oxaliplatin showed synergistic effects;however, all other combinations showed additive or antagonistic effects. Further, at an FA level of 0.95, only pre-combination of VPA with cisplatin or oxaliplatin showed synergistic effects; however, all other combinations showed antagonistic effects. In conclusion, post-treatment with VPA, TSA or SAHA did not have any synergistic effect when combined with cisplatin, oxaliplatin or epirubicin. VPA was found to have a more synergistic effect in the pre-treatment combination regime with cisplatin and oxaliplatin.
VPA followed by cisplatin leads to induction of histone acetylation and chromatin re-organization, favoring higher drug binding that leads to cell death
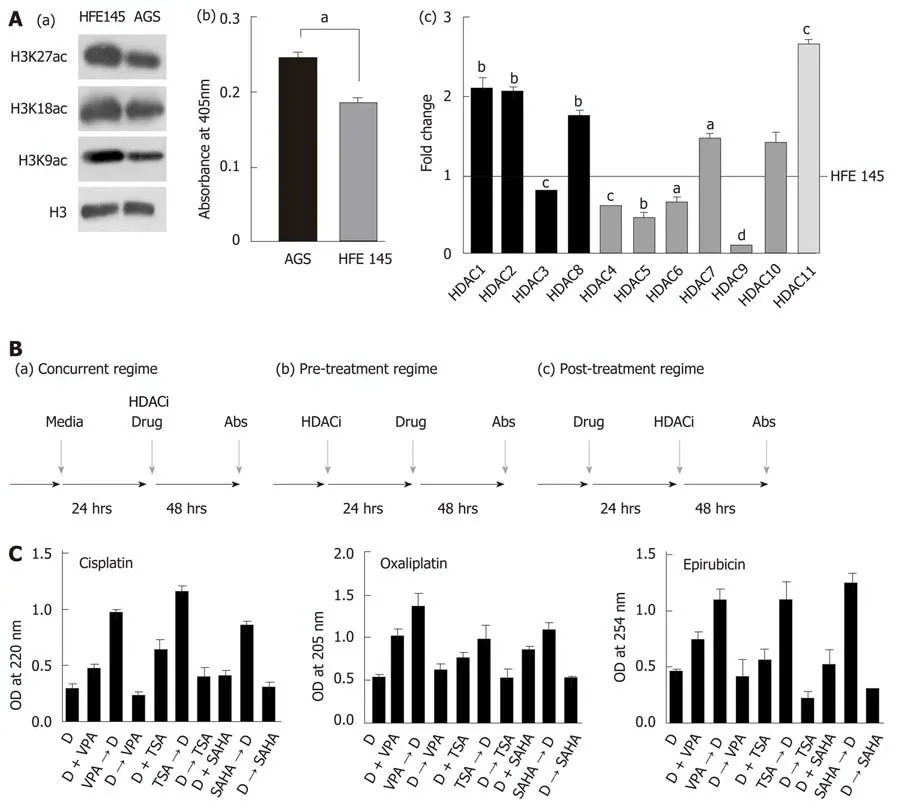
Figure 2 Pre-treatment regime with histone deacetylase inhibitor maximally enhances binding of chemotherapeutic drugs to chromatin. A: (a) Immunoblot analysis for the comparison of site-specific histone acetylation levels between gastric cancer (GC) cell lines, transformed AGS and untransformed HFE145; (b)Nucleo-cytosolic fractions were used to compare HDAC levels in GC cell lines using calorimetric assays; and (c) Real time PCR data of Class I to Class IV HDAC levels in the AGS cell line compared to HFE145 (aP < 0.05; bP < 0.009, cP < 0.0009, dP < 0.0001); B: Schematic representation of three different combination regimes:(a) concurrent [histone deacetylase inhibitor (HDACi) + Drug], (b) pre- (HDACi Drug) and (c) post- (Drug HDACi); C: AGS cells were treated with chemotherapeutic drugs and HDACi at their inhibitory concentration (IC)50 concentration for 24 h in three different combinations as mentioned above. Experiment was performed in triplicate, absorbance was taken, normalized with blank, and mean absorbance was incorporated into a bar graph. HDACi: Histone deacetylase inhibitor; HDAC:Histone deacetylase; Drug: Chemotherapy drugs; VPA: Valproic acid; SAHA: Suberoylanilide hydroxamic acid; TSA: Trichostatin A; IC: Inhibitory concentration.
The synergistic effect of the pre-treatment combination regime on DNA damage,histone acetylation and cell cycle was investigated following treatment of AGS cells with IC25 doses of VPA and cisplatin either alone or in combination. MNase assays after VPA treatment suggested an increased intensity of mono- and di-nucleosomes,with a decrease in high molecular weight DNA, indicating chromatin relaxation in VPA-treated cells compared to control (Figure 5A). In coherence, levels of H3Kac and H4K16ac increase after VPA treatment (Figure 5B). H4K16ac is reported to prevent higher order chromatin organization, and therefore its increase indicated open chromatin[24]. The increased acetylation and relaxation of chromatin further correlated with an increased level of γH2AX after combinatorial treatment compared to VPA and cisplatin alone (Figure 5B). Interestingly, H4K16ac decreased after cisplatin treatment alone, indicating the compaction of chromatin. This was likely an outcome of G2/M arrest post-cisplatin treatment, which may lead to poor drug binding to chromatin. VPA treatment, on the other hand, arrests the cells in G1 phase, leading to an open chromatin conformation to enhance drug binding (Figure 5C).
Gatekeeper tumor suppressor genes are known to be repressed in GC by an HDAC-mediated mechanism[25,26]. Levels of tumor suppressors were assessed after IC25 and IC50 treatment of VPA for 24 h. A two-fold increase in p16, p21 and p27 was observed, suggesting the involvement of tumor suppressor-mediated cell cycle arrest,and the observed effects of cell death (Figure 5D). Taken together, results indicate that the pre-treatment regime of VPA opens chromatin, increases the expression of tumor suppressor genes, and enhances cisplatin binding to chromatin, ultimately leading to more cell death.

Table 2 Regime-specific synergistic, additive or antagonistic effects of chemotherapeutic drugs and histone deacetylase inhibitors
Monitoring of tumor growth and drug efficacy in GC xenografts
The pre-treatment regime of HDACi, VPA alone or combined with cisplatin was further explored in vivo with a xenograft tumor model using AGS cells (Figure 6A and B). After 3 wk of treatment, a change in tumor volume was observed in VPA,cisplatin, and VPA followed by cisplatin-treated groups. In vivo, cisplatin and VPA alone showed a similar decrease in tumor volume, however a 3X decrease in tumor volume was observed in the combinatorial treatment group at the end of 5 wk (Figure 6C). Thus, the pre-treatment regime showed a synergistic anticancer effect in the xenograft tumor model. Drug toxicity, as assessed by a decrease in weight, was minimal, with a 15% weight loss in the combination group, indicating better drug tolerance (Figure 6D). Histopathological examination of different tumor tissues showed decreased levels of viable cells (20%-55%) in the case of the combinatorial treatment group compared to the control group (70%-90%). Interestingly, infiltration of inflammatory cells was also observed in the combination group. Also, a greater number of mitotic cells was observed in cisplatin alone and the combinatorial group.Moreover, pleomorphic, hyperchromatic nuclei were observed in the combinatorialtreated group compared to control, suggesting chromatin-associated alterations after drug treatments (Figure 6E). The preclinical study warrants use of the pre-treatment regime in clinical trials for better HDACi therapy success in solid tumors.
DISCUSSION
Histone acetylation has a significant effect in modulating chromatin architecture and transcription[8]. Thus, acetylation marks and their modifiers have been studied in cancer for their diagnostic, prognostic and therapeutic potential[9]. The clinical application of HDACi has been disappointing in solid tumors, and the major factor for failure in diverse clinical trials is the concurrent treatment regime, limited combination chemotherapeutic studies, and no patient stratification.
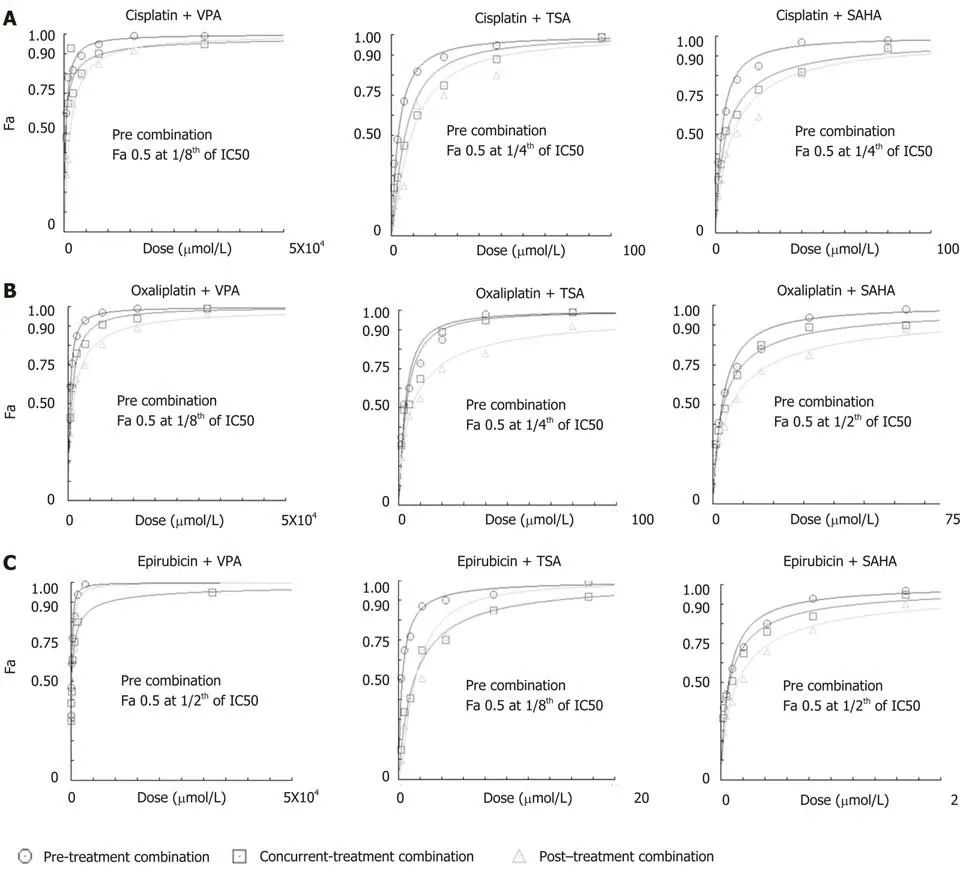
Figure 3 Histone deacetylase inhibitor-dependent sensitization of gastric cancer cells decreases the dose of chemotherapeutic drugs to attain maximum efficacy. AGS cells were treated with chemotherapeutic drugs (cisplatin, oxaliplatin and epirubicin) and histone deacetylase (HDAC) inhibitors [valproic acid (VPA),trichostatin A (TSA) and suberoylanilide hydroxamic acid (SAHA)] for 24 h each in three different combinations: (i) concurrent (HDACi + Drug), (ii) pre- (HDACi Drug)and (iii) post- (Drug HDACi) at the combined dose (as mentioned in Supplementary Table 1), and : 3-(4,5-Dimethylthiazol-2-yl)-2,5-diphenyltetrazolium bromide (MTT)assays were performed. Fraction-affected dose response curve of A: Cisplatin; B: Oxaliplatin; and C: Epirubicin in different combinations with VPA, TSA or SAHA.TSA: Trichostatin A; VPA: Valproic acid; SAHA: Suberoylanilide hydroxamic acid.
Our data suggest that sensitizing GC cells or in vivo xenografts containing increased levels of Class 1 HDACs with pre-HDACi treatment results in histone hyperacetylation and relaxed chromatin organization. Increased accessibility of chromatin to DNA-interacting drugs induces DNA damage and cell death. Increases in cell death upon combination of two or more drugs do not form the basis of pre-clinical or clinical studies until the combination shows synergistic effects. All pre-treatment combinations of HDACi and chemotherapeutic drugs showed higher percentages of cell death at low combined doses; however, only VPA with oxaliplatin or cisplatin was found to be best, due to their synergistic effects across FA values from 0.5 to 0.95.Thus, in pre-clinical and clinical settings, the pre-treatment approach with HDACi would allow for a low dosage of chemotherapeutic drugs with similar dose-related cell toxicities. Earlier, Mutze et al[27]showed the importance of HDACi-SAHA pretreatment to sensitize GC cell lines. The synergistic effect was further recapitulated in a pre-clinical in vivo model, wherein a decrease in tumor volume was observed in the pre-treatment group with low toxicity compared to the cisplatin only and VPA groups. Body weight in the VPA-treated group was not altered compared to the VPA/cisplatin-treated group. This suggests that VPA alone as a sensitizer has no appreciable side effects in the pre-clinical study. Earlier studies have shown that thioredoxin (Trx) levels play an important role in determining HDACi-induced cell death in cancer cells[28]. Normal cells have relatively higher levels of Trx, and therefore could account, in part, for the low toxicity observed in the pre-clinical protocol.Moreover, the cells are arrested in the G1 phase as opposed to the G2/M phase in the case of cisplatin treatment; the G1 phase with more open chromatin thus favors enhanced cisplatin binding and more cell death as suggested by increased γH2AX levels. A recent phase II study in GC with vorinostat as a first-line therapy with capecitabine and cisplatin did not meet its expected outcome[29]. In this study,vorinostat was administered concurrent with chemotherapeutic drugs, suggesting vorinostat had insufficient time to enforce a chromatin modulatory effect, leading to weak drug binding. The prerequisite for changing chromatin organization by HDACi in the case of multiple solid tumors is strengthened by phase I clinical trials with VPA and the topoisomerase II inhibitor epirubicin[30]. In this study, a 48 h pre-exposure of VPA was found to be essential to obtain synergistic outcomes with epirubicin. The pre-treatment combinatorial chemotherapy approach could achieve a positive outcome with acceptable toxicities in heavily treated and previously anthracyclineresistant tumors.

Figure 4 Median effect plot analysis for drug combinations (chemotherapeutic drugs and histone deacetylase inhibitors) as synergistic, additive or antagonistic. AGS cells were treated with chemotherapeutic drugs (cisplatin, oxaliplatin and epirubicin) and histone deacetylase inhibitors (HDACi) [valproic acid(VPA), trichostatin A (TSA) and suberoylanilide hydroxamic acid (SAHA)] for 24 h each in three different combinations - concurrent (HDACi + Drug), pre- (HDACi Drug) and post- (Drug HDACi) at the combined dose (as mentioned in Supplementary Table 1), and : 3-(4,5-Dimethylthiazol-2-yl)-2,5-diphenyltetrazolium bromide assays were performed. Median effect plot shows the combination index (CI) on the Y-axis and fraction-affected values on the X-axis; A: Cisplatin; B: Oxaliplatin; and C: Epirubicin in different combinations with VPA (left panel), TSA (middle panel) and SAHA (right panel). For a particular fraction affected value, the combination index values range from 0 to 1; CI < 0.8, CI = 0.8-1.2, and CI > 1.2 represents the synergistic, additive or antagonistic nature of drug combinations, respectively. GC: Gastric cancer; HDACi: Histone deacetylase inhibitor; HDAC: Histone deacetylase; Drug: Chemotherapy drugs; VPA: Valproic acid; SAHA: Suberanilohydroxamic acid; TSA:Trichostatin A; MTT: 3-(4,5-Dimethylthiazol-2-yl)-2,5-diphenyltetrazolium bromide; CI: Combination index.
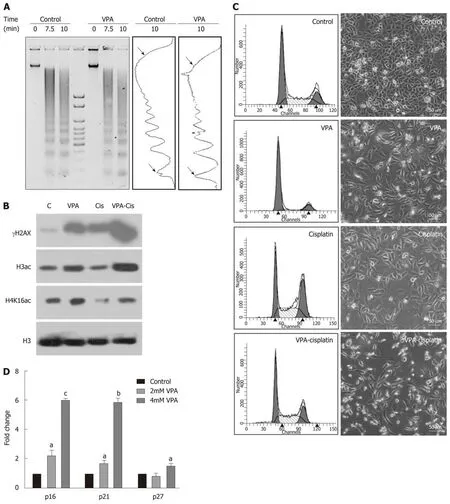
Figure 5 Pretreatment regime is associated with chromatin relaxation, enhanced DNA damage and re-expression of tumor suppressors. A: Chromatin organization in the AGS cell line by micrococcal nuclease (MNase) assays with time-dependent kinetics was studied following 24 h treatment with valproic acid (VPA)(2 mmol/L). AGS cells were treated with an inhibitory concentration (IC)25 concentration of cisplatin and VPA alone or in combination for 24 h, and the following parameters were analyzed: B: Histone post-translational modifications; C: Cell cycle profile and morphology; and D: Effect of VPA on re-expression of tumor suppressors was studied by treating AGS cells with the IC25 and IC50 concentrations of VPA for 24 h, followed by real time PCR for the p16, p21 and p27 genes (aP< 0.02; bP < 0.0009; cP < 0.0001). MNase: Micrococcal nuclease; HDACi: Histone deacetylase inhibitor; PTMs: Post-translational modifications; VPA: Valproic acid;IC: Inhibitory concentration; PCR: Polymerase chain reaction.
Decades of research involving HDACi and chemotherapeutic drugs have failed to take into account the HDAC levels or activity status of patients, resulting in inappropriate HDACi dose administration. The Neck-V-CHANCE trial will be the first clinical trial to test the efficacy of HDACi pre-treatment. In this ongoing head and neck cancer trial, valproic acid will be administered 2 wk prior to the administration of cisplatin and cetuximab. However, this trial also does not stratify patients based on HDAC levels[31]. Our HDAC activity correlative data linking HDAC expression with histone acetylation, and the presence of heterogeneous HDAC activity and transcript levels in patients, provides sufficient evidence for categorizing the patients for HDACi therapy. Weichert et al[32]showed that approximately 71% (209/293) of GC patients are positive for the expression of either all three or one of the three class 1 HDAC isoforms. Also, Mutze et al[27]highlights that high expression of HDAC1/2 in GC does not relate to response and overall survival. The latest publication by Jiang et al[33]showed an association between high HDAC1 (60% patients) with larger tumor size, tumor grade, lymph node metastasis and lymphovascular invasion, making it an independent prognostic factor for GC. Our in silico TCGA data analysis suggests that 24% of GC patients have higher expression levels of class 1 HDACs. This explains the need for prior assessment of class 1 HDAC levels HDACi therapy patient stratification. This will also assist in defining the dose of HDACi in pre-treatment regimes with DNA-interacting chemotherapeutic drugs for better therapeutic potential.
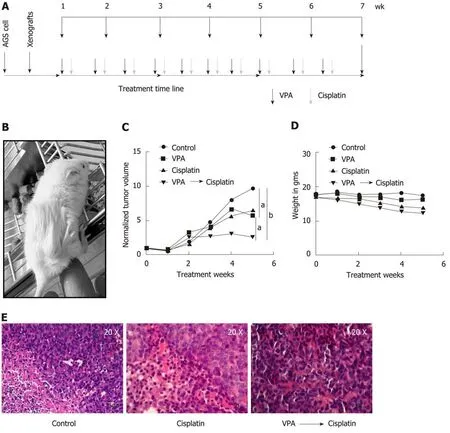
Figure 6 Valproic sensitizes AGS cell xenografts to cisplatin in an in vivo mice model. A: Schematic diagram depicting timeline of in vivo drug administration.AGS cells were injected into NOD-SCID mice. After tumors reached approximately 100 mm3; B: Mice were divided into four groups (n = 3), (1) control, (2) valproic acid(300 mg/kg/d), (3) cisplatin (2 mg/kg/d), and (4) combinatorial treatment of valproic acid followed by cisplatin at the same dose mentioned above; C: Average tumor volumes of groups normalized to the initial tumor volumes (before treatment) are plotted over a period of 5 wk of drug treatment. The outcome of the different treatment regimens was statistically validated by performing unpaired t-tests (aP < 0.05; bP < 0.005); D: Mean weight of animals in a group measured over the treatment period to assess toxicity; E: Histopathology of tumor sections by hematoxylin and eosin staining of different groups following 5 wk of treatment. VPA:Valproic acid.
In conclusion, our results establish a strong rationale for exploring pre-treatment regimes in stratified patients groups with HDACi in clinical trials. The proposed mechanism is through the attainment of open chromatin architecture, and the accumulation of activating histone marks for enhanced binding of DNA-interacting chemotherapeutic drugs (graphical abstract, Figure 7). This worthwhile strategy may become more successful in overcoming the limitations of epi-drugs in solid tumor treatment, and may increase therapeutic outcomes with minimal chemotherapeutic toxicity in the clinic.

Figure 7 Graphical abstract: Model depicting stratification of patients with high histone deacetylase activity/levels of histone deacetylase inhibitor therapy. A prior treatment of histone deacetylase inhibitors would relax the condensed chromatin of a stratified patient group, making it more accessible and increasing its interaction with chemotherapeutic drugs compared to only first-line chemo treatment. This would enhance the number of cells killed at lower drug concentrations with a decrease in side-effects and toxicity. HDAC: Histone deacetylase; HAT: Histone acetyl transferase.
ARTICLE HIGHLIGHTS
Research background
Alterations of the epigenome play an important role during the process of gastric carcinogenesis.Therefore, drugs like histone deacetylase inhibitors (HDACi) are being explored for their antitumor activity.
Research motivation
Identify alterations in the epigenetic milieu of gastric cancer, and check whether the concomitant usage of HDACi with chemotherapeutic drugs increases the drug's efficacy.
Research objectives
This study aimed to reveal the most optimal combination of chemotherapeutic drugs, as well as HDACi type, dose and regime (pre, post and concurrent). The biochemical mechanism of action was investigated, and the combination was tested in an in vivo system.
Research methods
This study utilized paired gastric cancer human samples, along with the gastric adenocarcinoma cell line AGS and immortalized normal counterpart HFE145. The efficacy of several chemotherapeutic agents and HDACi was tested in the AGS cell line, and the final combination was tested in an animal model of gastric cancer.
Research results
Gastric cancer patients showed differential HDAC activity and levels. Furthermore, pretreatment of valproic acid followed by cisplatin favors an open chromatin conformation via increased histone acetylation. These changes increase the binding of cisplatin to DNA at lower concentrations. In vivo studies suggest a better response with pretreatment regimes that do not cause toxicity.
Research conclusions
This study described that decreased histone acetylation in human gastric cancer tumor samples may be attributed to differential/elevated histone deacetylase activity and expression.Additionally, pre-treatment with HDACi was the most optimal regime that maximally enhanced the cell killing potential of chemotherapeutic drugs. This was achieved by increased intercalation of the drug in chromatin post-HDACi treatment. The pre-treatment of HDACi valproic acid and cisplatin was able to decrease tumor volume in vivo compared to cisplatin alone.
Research perspectives
This pre-clinical study provides evidence that pre-treatment of HDACi followed by standard chemotherapeutic agents enhances the effectiveness of the drug. Hence, clinical testing of such combinations may be explored for better management of gastric cancer.
ACKNOWLEDGEMENTS
The authors are thankful to departments of Flow Cytometry and Mr. Mahesh Pawar,Laboratory Animal Facility, ACTREC, Ms. Kanchan Hariramani and Mr. Narendra Varma, trainees at Gupta laboratory for their assistance during experimental work.The authors are also thankful to members of Gupta laboratory for critical reading of the manuscript.
杂志排行

World Journal of Gastroenterology的其它文章
- Flushing as atypical initial presentation of functional gallbladder neuroendocrine carcinoma: A case report
- Expression of miR-1304 in patients with esophageal carcinoma and risk factors for recurrence
- Validation and evaluation of clinical prediction systems for first and repeated transarterial chemoembolization in unresectable hepatocellular carcinoma: A Chinese multicenter retrospective study
- Bacterial infection triggers and complicates acute-on-chronic liver failure in patients with hepatitis B virus-decompensated cirrhosis: A retrospective cohort study
- MiR-19a-3p regulates the Forkhead box F2-mediated Wnt/β-catenin signaling pathway and affects the biological functions of colorectal cancer cells
- Characterizing the composition of intestinal microflora by 16S rRNA gene sequencing