Relationship Between the Spatiotemporal Distribution of Dominant Small Pelagic Fishes and Environmental Factors in Mauritanian Waters
2020-03-10EBANGONGANDONarcisseSONGLimingCUIHongxingandXUShuangquan
EBANGO NGANDO Narcisse, SONG Liming, , CUI Hongxing,and XU Shuangquan
1) College of Marine Sciences, Shanghai Ocean University, Shanghai 201306, China
2) National Engineering Research Center for Oceanic Fisheries, Shanghai Ocean University, Shanghai 201306, China
3) The Key Laboratory of Sustainable Exploitation of Oceanic Fisheries Resources, Ministry of Education, Shanghai Ocean University, Shanghai 201306, China
4) Collaboration Innovation Center for National Distant-Water Fisheries, Shanghai 201306, China
Abstract The relationship between the spatiotemporal distribution of three dominant small pelagic fishes, including chub mackerel (Scomber japonicus), horse mackerel (Trachurus trecae) and round sardinella (Sardinella aurita), and the environmental factors in Mauritanian waters were analyzed by using 4 years of logbook data of commercial purse seine fisheries to improve the efficiency of fishery and management of sustainable exploitation. A Tweedie-generalized additive model (GAM) of 8-day average catches and the monthly geostatistical analysis of daily catches were used in this study to analyze the influence of environmental factors on catch per unit of effort (CPUEs) and to map the spatial distribution of three mixed dominant small pelagic fishes, respectively. A 10΄ × 10΄ grid was used, and environmental factors were processed from remote sensing, including 8-day average sea surface temperature(SST), the nearest distance between SST fronts and CPUE position (Df), chlorophyll-a (Chl-a) concentration, salinity, and eddy kinetic energy. Results showed that 1) the distribution of three dominant small pelagic fishes might be related to the intensity of upwelling in Mauritanian waters; 2) oceanic fronts might play a key role in the ecology of chub mackerel, horse mackerel, and round sardinella; 3) Chl-a concentration might be associated with the feeding grounds of chub mackerel; 4) the target species distribution appeared sensitive to gradient changes in the amount of salinity; 5) three zones (northern, central, and southern) with variable abundances were delineated; and 6) a high concentration of the center of gravity in the central zone might be related to the strong upwelling of nutrient-rich waters. This study can provide new insights to enhance the fishery efficiency and sustainable exploitation management of purse seiners in certain area off Mauritania.
Key words aggregation; environmental factors; small pelagic fish; light purse seiner; Mauritanian waters
1 Introduction
Since the 1960s, the pelagic stocks off West Africa have been exploited by distant water fishing fleets from Eastern Europe (Boely and Freon, 1979; COPACE, 1979; Fréon et al., 1982). Small pelagic fishes are important fishery resources off Northwest Africa and particularly off Mauritanian (ICES, 2012; FAO, 2017). The dominant species are sardine (Sardina pilchardus), sardinella (Sardinella aurita and S. maderensis), horse mackerel (Trachurus trecae and T. trachurus), chub mackerel (Scomber colias or S. japonicus), anchovy (Engraulis encrasicolus), and bonga (Ethmalosa fimbriata; FAO, 2017). The total catch of small pelagic fishes, particularly in Mauritanian waters,showed inter annual fluctuations from 1990 to 2016 and increased by 38% in 2016 in relation to 2015, with a catch of around 848000 tons (FAO, 2017). In Mauritanian waters, the dominant species in terms of the total catch in 2016 were round sardinella, horse mackerel, and chub mackerel. The spatial distribution of small pelagic fishes is divided into two areas, namely, the southern zone from Senegal exclusive economic zone (EEZ) at 16˚04΄N to 19˚10΄N,and the northern zone from 19˚10΄N to the south of Western Sahara at 20˚36΄N (Jesús, 2010; Pierre et al., 2010).
Small pelagic fishes live in the upper pelagic environment. The Joint Scientific Committee EU-Mauritania 2016 recommended the analysis of the relationship between environmental conditions, such as hydrological parameters, and the dynamics of the populations of exploited fish stocks, such as small pelagic fishes (Cervantes et al., 2017).The exploitation of these fishes can be evaluated using the high spatial and temporal resolutions of SST satellite images to determine the areas of intense fishing activities(Tseng et al., 2011). The analysis of the relationship between spatiotemporal fisheries data and satellite remote sensing data by using GIS has been widely applied to help understand the fundamental relationships between fisheries and their ocean environment. Multiple studies involving acoustic data or satellite data, such as sea surface temperature (SST) fronts (Wang et al., 2007; Reese et al., 2011;Xu et al., 2017), chlorophyll-a (Chl-a; Lanz et al., 2009),salinity (Paramo et al., 2003), and eddy kinetic energy(EKE; Meunier et al., 2012), have shown the importance of environmental factors to fish distributions and assessed the relationship between catches and these environmental factors. Reese et al. (2011) revealed that SST fronts influence the distributions of pelagic species and found that fishes are located significantly closer to fronts and vary with the progression of the upwelling season in the California Current upwelling system. Lanz et al. (2009) found that Chl-a and SST are significantly associated with the abundance of most small pelagic species. Valdes and Deniz(2015) presented a strong influence of hydrographic processes on pelagic fish stocks in the Canary Current and demonstrated that upwelling index and Chl-a are important features that may affect the distribution and abundance of small pelagic fishes in Mauritanian waters. Paramo et al. (2003) observed that the distribution of small pelagic fishes is significantly associated with temperature and salinity. They suggested that the dynamics of the upwelling area may influence the spatial distribution and abundance of small pelagic species.
Off Northwest Africa, particularly Mauritania, the target of studies is more limited to the internal spatial fine structure of upwelling (fronts, eddies, filaments) and its fluctuations on synoptic to interannual timescales (Van Camp et al., 1991; Kostianoy and Zatsepin, 1996; Nieto et al., 2012). Small pelagic fishes are associated with thermal fronts, warm waters (in summer), cold waters (in winter), warm water streamers, and eddies in Northwest Africa. These features can be observed through satellite remote sensing SST, ocean color, or altimetry data (Pierre et al., 2010; ICES, 2012). The waters off Mauritania are a highly productive ecosystem influenced mainly by the Canary Current from the north and Equatorial Counter Current or Guinea Current from the south (Helmke, 2003;Pierre et al., 2010; ICES, 2012), which produce an upwelling. The two currents and the upwelling transport water with different temperatures and salinities and high in nutrients, which produce plankton blooms that promote the productivity of Mauritanian waters (Pierre et al., 2010).In previous studies, environmental factors include SST,Chl-a, salinity, and upwelling index, with spatiotemporal resolution by month and 1˚ × 1˚ grid. Mahmoud et al. (2017)and Modou et al. (2017) described the environmental effects on the spatiotemporal patterns of the abundance and distribution of small pelagic fishes in Northwest Africa, including Mauritanian waters. Mahmoud et al. (2017)emphasized that SST, upwelling index, and Chl-a concentration are the main environmental parameters explaining the variability of sardinella and sardine off Mauritania.They also showed that the spatiotemporal variations in sardinella off Mauritanian waters are controlled by thermal gradients rather than productivity gradients, which are probably linked to species’ physiological constraints (i.e., thermal tolerance); however, variations in sardine are controlled by optimal upwelling and temperature. Modou et al.(2017) highlighted that the wide variations in sardinella biomass are caused by changes in environmental conditions.
A 25-year fishery agreement was signed between Mauritania and Hongdong International (Mauritania) Fishery Development Co., Ltd. (ATLAFCO, 2016) in 2011. In the present study, we used the fisheries data of Hongdong International (Mauritania) Fishery Development Co., Ltd.to investigate two main objectives: 1) to determine the influence of environmental factors on the catches of each of three dominant small pelagic fishes; 2) to map the monthly spatial distribution of three mixed dominant small pelagic fishes (chub mackerel, horse mackerel, and round sardinella). For the first aim, the relationships between each dominant small pelagic fishes’ CPUE, environmental factors, and spatiotemporal factors were analyzed through Tweedie-GAM because of its ability to handle with a high amount of zero data. The environmental factors included the nearest distance between SST fronts and CPUE position (Df), SST, Chl-a, salinity, and EKE, and the spatiotemporal resolution was 8 days and 10΄ × 10΄ grid. For the second aim, the spatiotemporal distribution and spatial patterns of these three mixed dominant small pelagic fishes were analyzed monthly through the geostatistical analysis of daily CPUE because of the amount of zero values of each of the target small pelagic fishes in the logbooks,their similar life history (especially migratory routes), and their similar habitats. According to the logbook data collection and the amount of zero data, the mixed daily catches of monthly distribution would show a better view of spatiotemporal distribution and spatial patterns than the daily catches of each species with 8-day distribution. This study would improve the understanding, efficiency of fishery,and sustainable utilization of small pelagic fishes in the study area of light purse seiners off Mauritania.
2 Materials and Methods
2.1 Study Area
The study area was in Mauritanian waters between 16˚20΄–20˚40΄N and 16˚20΄–17˚40΄W (Fig.1). The area was defined by the Mauritanian authorities as exploited by Chinese purse seiners using lights based on an annual quota (TAC) of 10000 tons per vessel and per year. The TAC was estimated by the FAO small pelagic fish stock assessment.
2.2 Fisheries Data
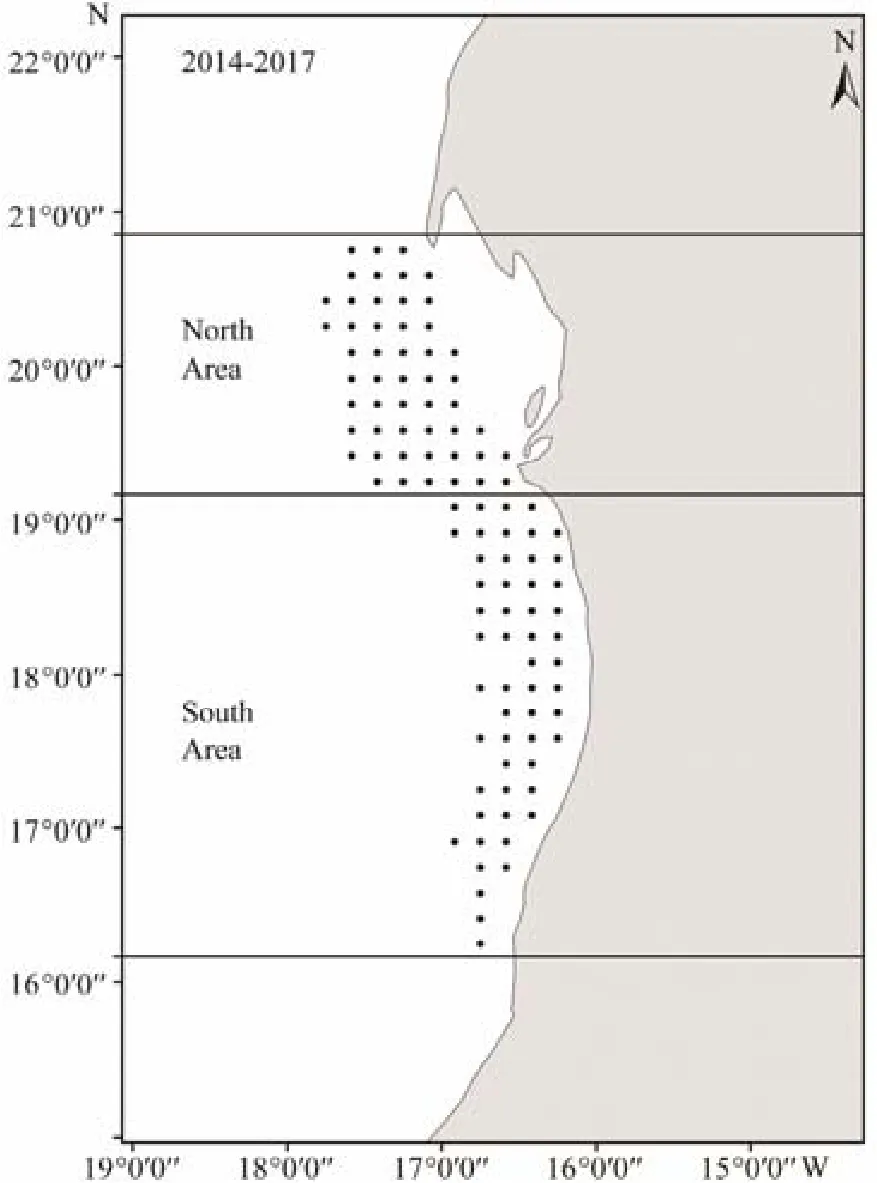
Fig.1 Distribution map of data collected in Mauritanian waters.
Logbook data were collected by two commercial light purse seiners with the same characteristics (length over all = 50 m, breadth = 8.60 m, and depth = 4 m), Fuyuanyu 097 and Fuyuanyu 098 of Hongdong International (Mauritania) Fishery Development Co., Ltd. Each vessel was equipped with a purse seine with floatline length of 809.84 m and leadline length of 761.44 m. The logbook fishery data of the two vessels were available from 2014 to 2017 on a 10΄ spatial grid. The fishery data comprised daily catches of small pelagic fishes (tons), daily fishing effort (number of hauls), and daily fishing locations (latitude, longitude).To map the monthly distributions of the CPUEs of small pelagic fishes, we used the mixed daily catches of three target species. The daily CPUE was expressed in the following formula:

where Ckijmyand Fkijmyare respectively the daily total catch (tons) and the fishing effort (hauls) of k species (k =1, 2, 3 for chub mackerel, horse mackerel, and round sardinella, respectively) within i fishing grid in day j, month m, and year y. To investigate the spatial patterns of small pelagic CPUE, we calculated the center of gravity (CG)of their abundances (Woillez et al., 2007) determined by the following formulas:
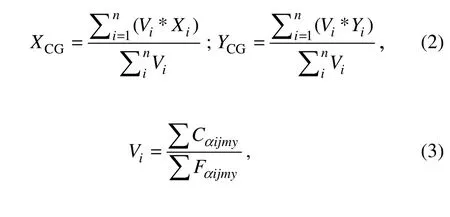
where (XCG, YCG) are the monthly coordinates of the CG of their abundances; and Xi, Yi, and Viare longitude, latitude, and daily CPUEs within i fishing grid, respectively.The daily CPUEs Viinclude Cαijmyand Fαijmy, which respectively correspond to the daily total catch (tons) and the fishing effort (hauls) of α vessel (α = 1, 2) within i fishing grid on day j, month m, and year y of the three mixed target species. We mapped the daily CPUE into the monthly spatial distribution by using data and geographic position (longitude and latitude). We created an individual point map in ArcGIS and georeferenced within a coordinate system containing projection information applied to all fishery data. The fishery data were gridded, and the spatial resolution of the grid was 10΄ × 10΄ (latitude/longitude grid by ESRI ArcGIS).
2.3 Remote Sensing Environmental Data, Image Processing, and GIS Software
Oceanographic data were downloaded from the Ocean-Color website and the Copernicus Marine Environmental Monitoring Service (CMEMS) website from 2014 to 2017(Table 1). We downloaded daily level 3 standard mapped images from the Moderate Resolution Imaging Spectroradiometer (MODIS), including SST and Chl-a, with a daily temporal resolution and spatial resolution of 4 km.The daily salinity, eastward velocity (u), and northward velocity (v) were obtained from Copernicus with a daily resolution of 5΄. To match the 10΄ spatiotemporal resolution of environmental data with logbook data, we used the resampling methods of SeaDAS, which include ‘Upsampling’ and ‘Downsampling’, to preprocess the environmental data and convert them into a 10΄ × 10΄ grid for each day. To avoid or minimize instances of missing environment data because of weather conditions (clouds or rain)or instrument malfunction and have a relatively high temporal resolution for observing data distribution and coverage, we ultimately downloaded 8-day environmental data(SST and Chl-a) and preprocessed in SeaDAS because of the high missing daily environmental data. From Marine Copernicus, daily salinity, u, and v were preprocessed in SeaDAS and used to construct the 8-day average composite data in ArcGIS (Lan et al., 2017). From logbooks,individual fishing positions were recorded during the study period for each target species, including zero catches. To reveal the conditions under which catches were made, we mapped the CPUE data onto remote sensing images at corresponding time scales. To detect the SST fronts, Chl-a,salinity, and EKE, we cropped the study area in the area of 10˚–30˚W, 10˚–30˚N (Fig.2). SST fronts were detected from the Cayula-Cornillon single-image algorithm (Cayula and Cornillon, 1992) that used Marine Geospatial Ecology Tools (MGET) based on the ArcGIS 10.3 platform (Roberts et al., 2010). The SST detection algorithm deals with edge detection and operates at three levels:picture, window, and local-pixel levels. Before applying the algorithm at the picture level, we preprocessed the image by using SeaDAS to crop the area and create the SST Raster image. After cropping, we conducted histogram analysis to detect the formal portion of the edge, i.e.,the presence of two distinct groups in terms of SST (indicating a bimodal distribution), and to identify or define the threshold to separate them. After confirming the presence of an edge in each individual window and locating the edge pixels in the window where the presence of a front was detected and confirmed, we processed the SST Raster image in ArcGIS 10.3 by applying ‘Cayula-Cornillon Fronts in ArcGIS Raster’ (adding the threshold value defined) to generate the front detection and applying‘Raster to Polyline in Conversion Tools’ to convert the detected fronts to polyline fronts. The calculated process from the ‘near’ function in ArcGIS was used to calculate the shortest distance as follows because MGET cannot quantify SST gradients across oceanic fronts:

where Df was the distance between the average CPUE position and the adjacent SST fronts (Fig.2). All the environmental variables were included as part of the environmental variable data set. The values of the environmental factors that corresponded to the location of fishery CPUE positions were extracted using the ArcGIS function ‘Extract Multi Values to Points’. For the EKE derived from geostrophic velocities, we used MGET to download/extract daily geostrophic current velocity images with u and v components from the CMEMS website. We used the equation below (Robinson et al., 2011) to calculate EKE with the Raster Calculator function in Spatial Analyst extension (ArcGIS 10.3):

where u and v are eastward and northward velocities (m s-1). We again used the Raster Calculator function in Spatial Analyst extension to average the 8-day EKE from the daily EKE.
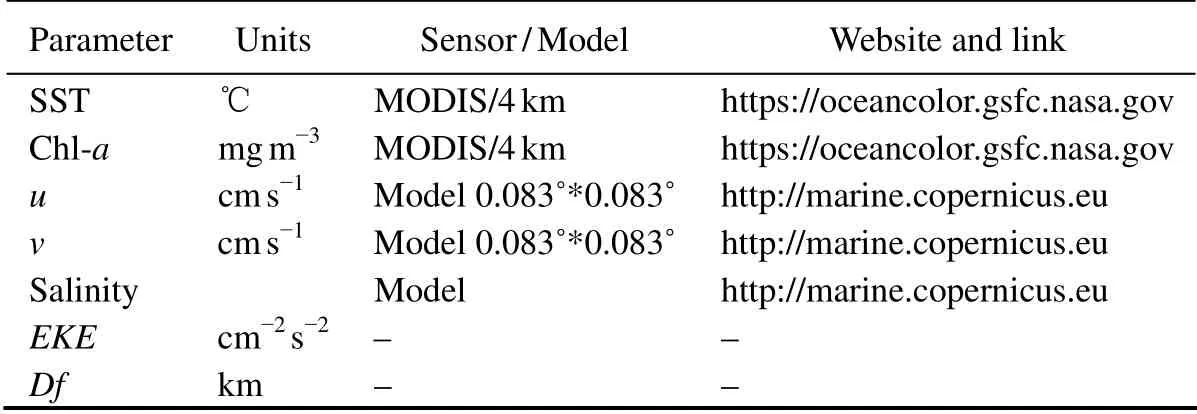
Table 1 Environmental factors and their units, sensor, and sources
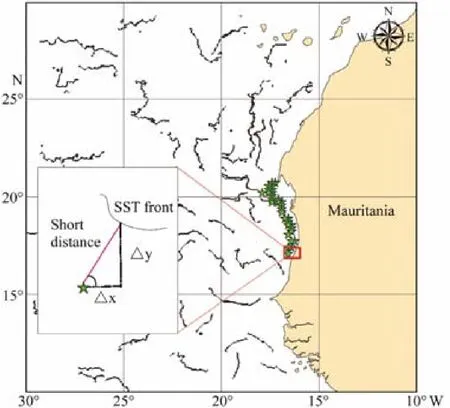
Fig.2 The cropped area, detected SST fronts and calculated shortest distance.
2.4 Statistical Modeling
To study the relationship between the fish distribution and environmental data, we computed 8-day average CPUEs against environmental factors (Lanz et al., 2009):


where Vαrepresents the 5 single environmental factors(Chl-a, SST, salinity, Df and EKE); Vβrepresents the 2 spatial positions (longitude and latitude); (Vα, Vα+1) represents the 10 environmental factors interactions; (Vβ, Vβ+1)represents the single spatial position interaction; and (Vα,Vβ+1) represents the 10 interactions between environmental factors and spatial positionis the expected value of the modeled abundance, and s(Y) is a spline smoothing function of the covariate Y. For target small pelagic species, we used the CPUEs, which include a number of zero values. Tweedie class distribution is a special class of probability distribution in the exponential distribution family. For the case of our study, we are mainly ~interested in the range of 1< p < 2 because the Tweedie model is expressed as the compound Poisson distribution,which is appropriate for CPUE analysis with a large amount of zero catch data. The Tweedie distribution is superior to other methods, such as ad hoc method, catch model with a Poisson or negative-binomial error structure, and Deltatype two-step method (Shono, 2008; San et al., 2013). The power parameter p can be defined as an arbitrary real number in the range of 1< p < 2. The determination of the index parameter p of Tweedie class is based on maximum likelihood estimates and should be the optimal p-value(Shono, 2008).
The environmental factors Df, SST, Chl-a, EKE, and salinity were used as covariates in spatial modeling. GAM is a flexible mathematical model class that allows incorporating smooth functions to model the nonlinear effect of continuous explanatory variables. The Tweedie-GAM was fitted in R statistical program (R Development Core Team, 2010) by using the ‘mgcv package’ (Wood, 2006),Tweedie packages, and AICcmodavg packages (Dunn, 2009;Marc, 2013). Deviance explained (DE) and adjusted R2were used to evaluate the model performance. The effect of each covariate included in GAM was plotted to visually inspect the functional form and assessin relation to geospatial covariates (Dormann et al., 2007).We used suitable quasi-AIC (Q-AIC) as a model selection criterion (Burnham and Anderson, 1998; Shono, 2008).The model variable selection was based on the significance of the model factor (P < 0.05). The modeling approach was based on Q-AIC as the chosen building sets of candidate models by using a backward stepwise procedure to select significant P values for each variable.According to the significance of each variable (P < 0.05),the smallest Q-AIC is the best GAM model after the insignificant variables were removed. Diagnostic plots (histogram of residuals and residuals vs. linear predictor) were used to evaluate model fitness. A distribution hypothesis test was carried out on the standardized residual value of the CPUE based on the Tweedie class distribution. GAM is a commonly used CPUE standardization method. The normal CPUE and standardized CPUE by Tweedie-GAM were compared on an 8-day average. The standardized CPUE was calculated with R software by using the ‘predict.gam’ function in R, with type = ‘matrix’ (R Core Team,2016) through the Tweedie-GAM model as used in several standardizations of CPUE (Humberto et al., 2011; Coelho et al., 2013; Basson and Farley, 2014).
3 Results
3.1 Relationship Between Environmental Factors and CPUE
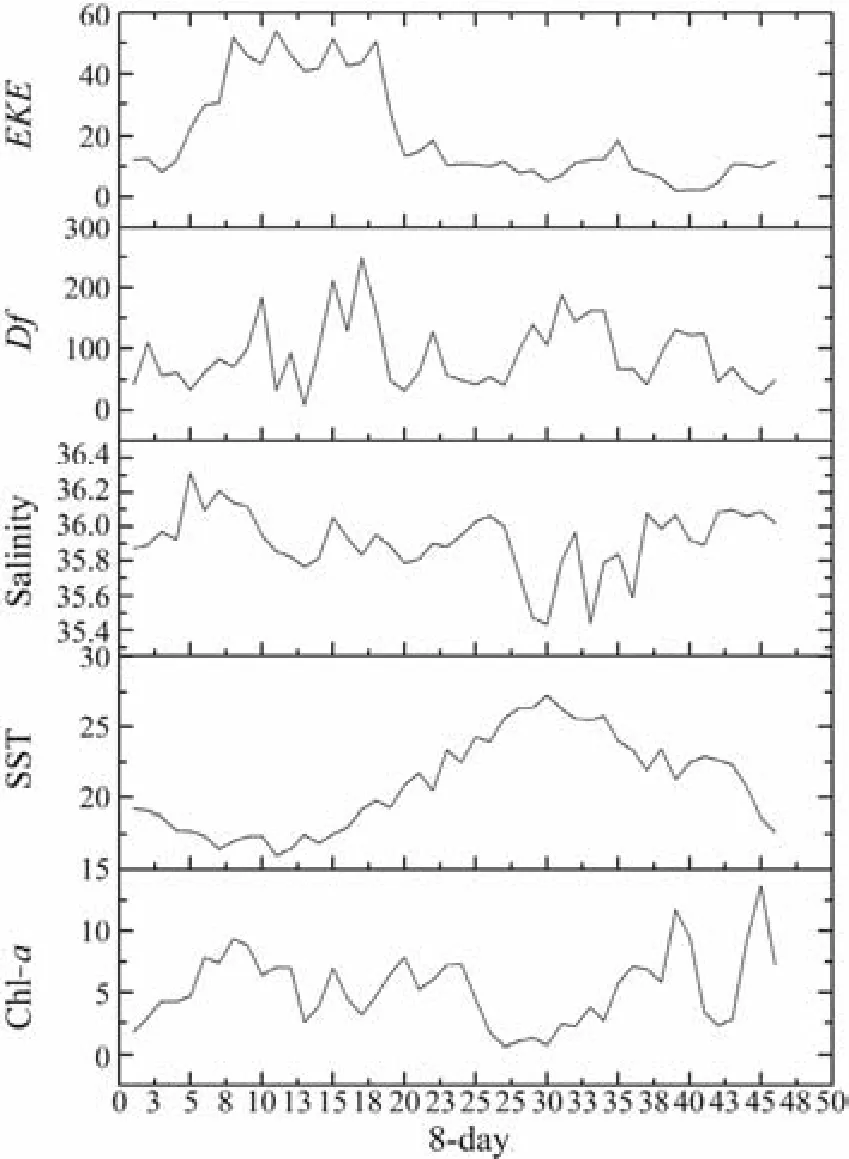
Fig.3 8-day variation of the environmental factors during 2014–2017.
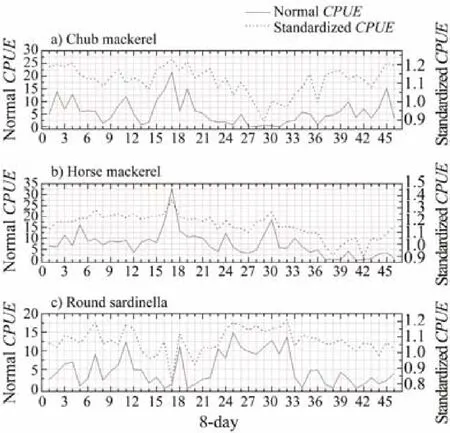
Fig.4 8-day variations of the CPUEs and standardized CPUE during 2014–2017.
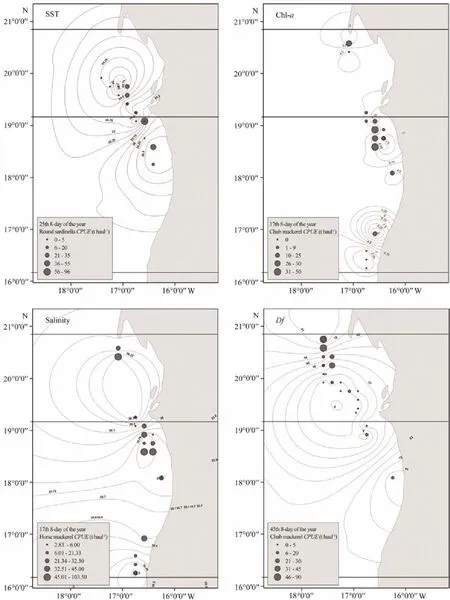
Fig.5 CPUE distribution maps and environmental factors (SST, Chl-a, Salinity and Df) during 2014–2017.
A total of 790 individual fishing positions were used for each target species, including zero-catch data, which covered most of the allowed fishing zone. The 8-day variations in environmental factors and CPUEs in 2014–2017 are presented in Figs.3 and 4, respectively. To provide better insights into the spatiotemporal distribution of target small pelagic fishes, we selected a few months with high CPUEs and then plotted integrated environmental probability maps combined with environmental factors in 8-day resolution in 2014–2017 (Fig.5).of the three target species were significantly correlated with SST,salinity, and Df (Table 2). Only chub mackerel was significantly correlated with Chl-a. The results also showed t that theof the three target species were not correlated with EKE. Adding the interactions into the building sets of candidate models and using the backward stepwise procedure to test the candidate models, we found that all the variables and interactions selected were statistically significant (Table 3). The selected best GAM models showed the DEs of 56.6%, 52.1%, and 56.5%, and adjusted R2of 0.547, 0.488, and 0.502 for chub mackerel,horse mackerel, and round sardinella, respectively (Table 3). All the variables selected in the best models were statistically significant. For all species and models, the diagnostic plots of residuals showed that model assumptions were not violated (Figs.6A, B, C). In the residual QQ picture of the GAM model (Figs.7A, B, C), the standardized residual values were concentrated on and they are close to the diagonal line, with some small deviations from the larger values to the left and right. These deviations are likely because the predicted value corresponding to the zerovalue derived from the model became positive and the discrete data marked random departures from the line(NOAA, 2001; Wood, 2017). Overall, the distribution assumptions of the GAM model were found to be appropriate. CPUE standardization showed that the normal CPUE of each species did not significantly differ from the standardized CPUE (Fig.4).
Table 2 Summary of the individual contribution of selected variables to the UEsbased on Tweedie-GAM

Table 2 Summary of the individual contribution of selected variables to the UEsbased on Tweedie-GAM
Notes: Significance level: ***P < 0.001; 0.001 < **P < 0.01; 0.01≤*P < 0.05.

Table 3 Backward stepwise selected Tweedie-GAM with p-value, Q-AIC and deviance explained
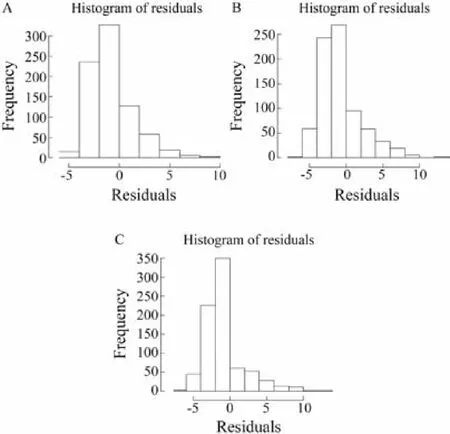
Fig.6 Histogram of standard residual in the Tweedie model for (A) chub mackerel, (B) horse mackerel and (C) round sardinella.
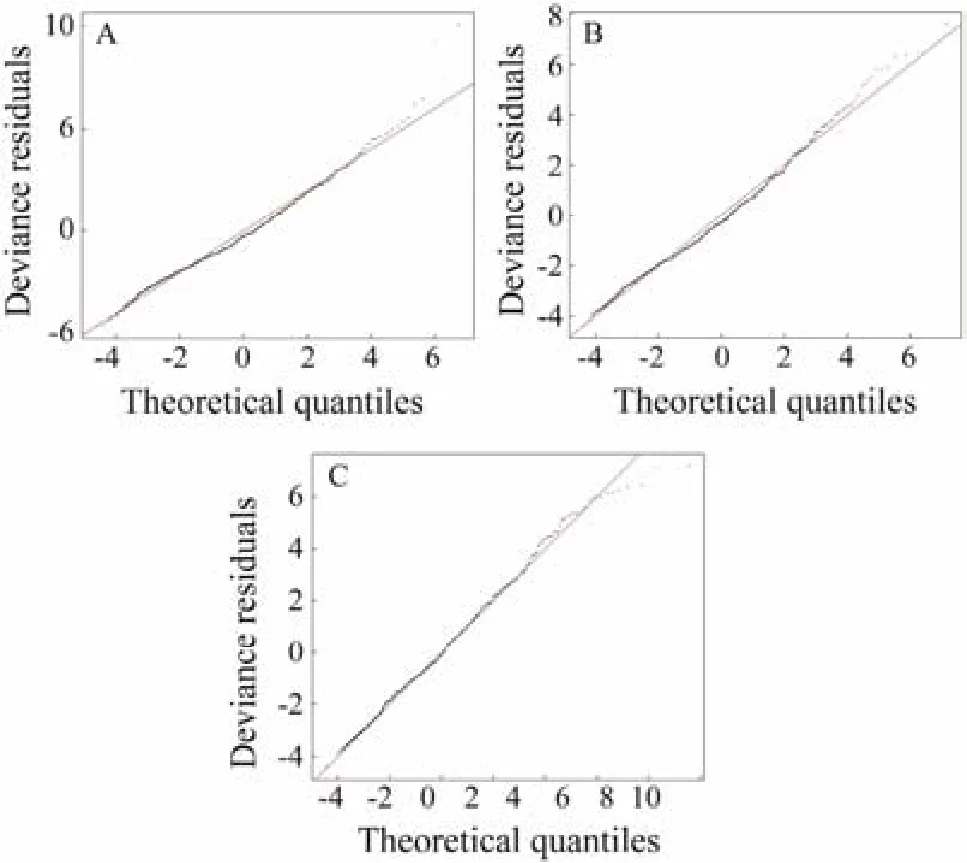
Fig.7 Quantile-quantile (QQ) plots of the deviance residuals in Tweedie model: A, chub mackerel; B, horse mackerel; and C, round sardinella.
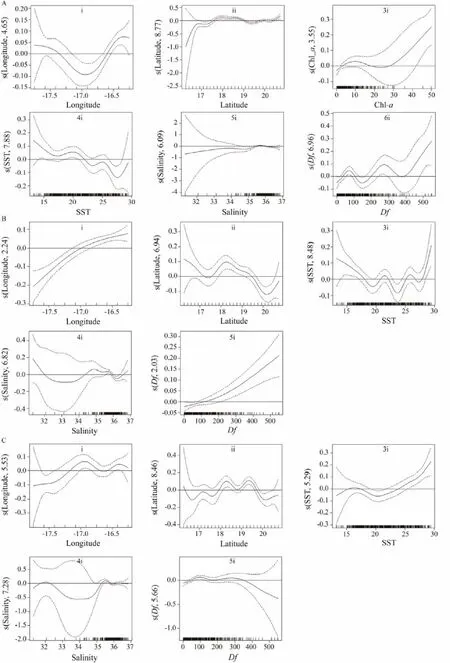
Fig.8 Estimated variable effects derived from the best GAM models analysis on target small pelagic fish CPUEs: (A)chub mackerel, (B) horse mackerel, and (C) round sardinella.
The best fitting GAM models of the effect of the environmental factors on YCPUEs are presented with 95%confidence intervals (Figs.8A, B, C). For chub mackerel,longitude had a generally negative effect onCPUE from 17˚00΄W to 17˚40΄W and a positive effect from 16˚20′W to 17˚00΄W, with a high probability of finding chub mackerel in the area of 16˚20΄–16˚36΄W and 17˚20΄–17˚40΄W,corresponding to the south sector close to the coast and north sector close to the Arguin Bank (Fig.8A, i). The latitude generally had a positive effect onPUE between 16˚20΄–18˚00΄N and between 19˚30΄–20˚40΄N, and a negative effect on 18˚00΄–19˚30΄N, with a high probability of finding chub mackerel in the area of 17˚50΄–19˚00΄N and 20˚00΄–20˚40΄N. These latitudes correspond to the three distinct sectors (southern, central, and northern; Fig.8A, ii). In terms of environmental factors, Chl-a presented a generally positive effect onUE from less than 10 mg m-3to greater than 24 mg m-3, and a negative effect with Chl-a at 10–24 mg m-3. The results showed a high probability of finding chub mackerel in the area with Chl-a between 5–19 mg m-3and also greater than 28 mg m-3(Fig.8A, 3i). The SST had a negative effect on chub mackerelCPUE at 13.67–17.5℃, 20–23℃, and 25–28℃ and a positive effect at 17.5–20℃, 23–25℃, and 28–29.09℃, and showed a high probability of finding chub mackerel in the area with SST at 13.67–22℃ (Fig.8A, 4i).The salinity had a slightly positive effect on chub mackerelPUE from the lowest salinity to around 35.7 and a negative effect between 35.7 and 36.83, with a high probability of finding chub mackerel in the areas with salinity between 35.and 36 (Fig.8A, 5i). The Df showed a positive effect onat 0–60 and 140–260 km and a negative correlation at 60–140 and 260–390 km. The results showed a high probability of finding chub mackerel in the area with Df at 30–110 and 200–360 km (Fig.8A, 6i).For horse mackerel, longitude had a generally positive effect onUE 16˚20΄–17˚40΄W, with a high probability of finding horse mackerel in the area of 16˚20΄–16˚55΄W,corresponding to the south sector close to the coast and central sector close to the Cap Timiris (Fig.8B, i). The latitude generally had a positive effect onEbetween 17˚30΄ and 18˚20΄N and between 20˚10΄ and 20˚40΄N, and a negative effect at 16˚20΄–17˚30΄N and 18˚20΄–20˚10΄N, with a high probability of finding horse mackerel in the areas of 16˚20΄–17˚10΄N and 17˚30΄–19˚30΄N (Fig.8B, ii). These latitudes corresponded to the two sectors (southern and central). In terms of environmental factors, the SST had a generally negative effect on horse mackerelPUE from 13.67 to 19℃, 21.5 to 24℃and 26 to 27.5℃, and a positive effect from 19 to 21.5℃,24 to 26℃ and 27.5 to 29.09℃, with a high probability of finding horse mackerel in the area from SST less than 17.5℃, 21 to 22℃, 25 to 26.5℃ and to greater than 28℃(Fig.8B, 3i). Salinity had a generally negative effect on horse mackerelPUE from less than 33.4 and 34.8 to 36.2 and a positive effect from 33.4 to 34.8 and to greater than 36.2. The results showed a high probability of finding horse mackerel in the area with the salinity between 34.2 and 35.9 (Fig.8B, 4i). The Df showed a positive effect onCPUE between 0 and 549 km. The results revealed a high probability of finding chub mackerel in the area with Df greater than 110 km (Fig.8B, 5i).For round sardinella, longitude had a generally positive effect onCPUEfrom 16˚25΄ to 16˚40΄W and from 17˚00΄ to 17˚40΄W, and a negative effect from 16˚20΄ to 16˚25΄W and from 16˚40΄ to 17˚00΄W, with a high probability of finding round sardinella in the area at 16˚20΄–16˚35΄W and 16˚45΄–17˚10΄W (Fig.8C, i). These longitudes correspond to the three sectors (northern, central, and southern).The latitude generally had a positive effect onCPUE between 16˚35΄ and 17˚10΄N, between 17˚35΄ and 18˚15΄N, between 18˚45΄ and 19˚15΄N, and between 20˚10΄ and 20˚40΄N,and a negative effect at 16˚20΄–16˚35΄N, 17˚10΄–17˚35΄N,18˚15΄–18˚45΄N, and 19˚15΄–20˚10΄N, with a high probability of finding round sardinella in the area at 17˚50΄–19˚50΄N, corresponding to the central sector (Fig.8C, ii).In terms of environmental factors, the SST presented a generally negative effect onCPUE from 16 to 21℃ and a positive effect from 13.67 to 16℃ and from 21 to 29.09℃,with a high probability of finding round sardinella in the area with SST between 15–17℃ and 24–29.09℃ (Fig.8C,3i). The salinity had a negative effect on round sardinellafrom 32.2 to 34 and from 35.4 to 35.9, and a positive effect at less than 32.2, from 34 to 35.4, and from 35.9 to 36.2. The results showed a high probability of finding round sardinella in the area with the salinity between 35.1 and 35.8 (Fig.8C, 4i). The Df showed a positive effect onbetween 0 and 100 km and between 180 and 300 km, and a negative correlation between 100 and 180 km and between 300 and 549 km. The results showed a high probability of finding round sardinella in the area with Df at 50–140 and 190–350 km (Fig.8C, 5i).
3.2 Spatial and Temporal Distributions of CPUE
Daily CPUEs in 2014–2017 reached a maximum monthly average CPUE of 31.83 t haul-1and a minimum monthly average CPUE of 11.14 t haul-1. These values were used to examine the seasonal migration pattern of small pelagic fishes (Fig.9). In accordance with Jesús (2010) and Pierre et al. (2010), the comparison of monthly fishing ground distribution from 2014 to 2017 is shown in Table 4. The monthly average CPUEs of Mauritanian small pelagic fishes and their monthly average fishing efforts from 2014 to 2017 are shown in Fig.10. The major fishing season was from January to March (winter), with the highest monthly average CPUE (31.83 t haul-1) in March, the month with the highest activity during the fishing season. The lowest monthly average CPUE was in December, which was beyond the dominant fishing season. An increase in monthly average CPUE was found in June and September,with CPUEs of 27.63 and 21.36 t haul-1, respectively. The monthly average fishing effort was the lowest in October,followed by the value in February. Fishing effort from November to December was higher in captures than that in the other months (Fig.10). The monthly CG distribution in 2014–2017 (Table 5) shifted from the north to the south and then vice versa (Fig.11). Most of the centers of gravities are highly concentrated in the lower northern and upper southern sectors and in the tran- sition area between the two sectors. The CG was located twice at 16˚44΄W–18˚47΄N in June and August, respectively (Fig.11).
4 Discussion
4.1 Relationships Between Environmental Variables and Small Pelagic Fish Distribution
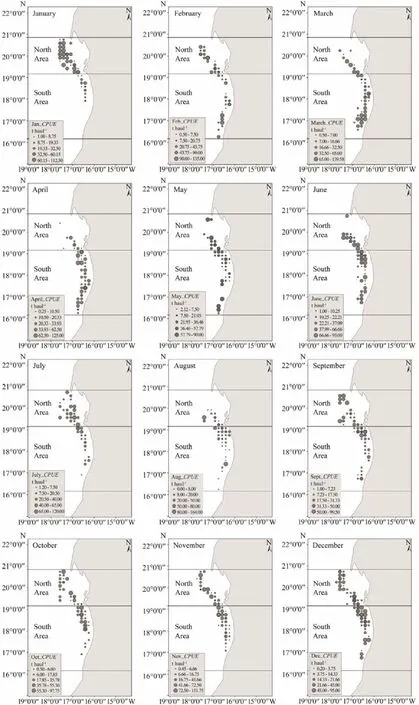
Fig.9 Monthly average CPUE spatiotemporal distribution in 10΄ × 10΄ grids from 2014 to 2017 (January to December).
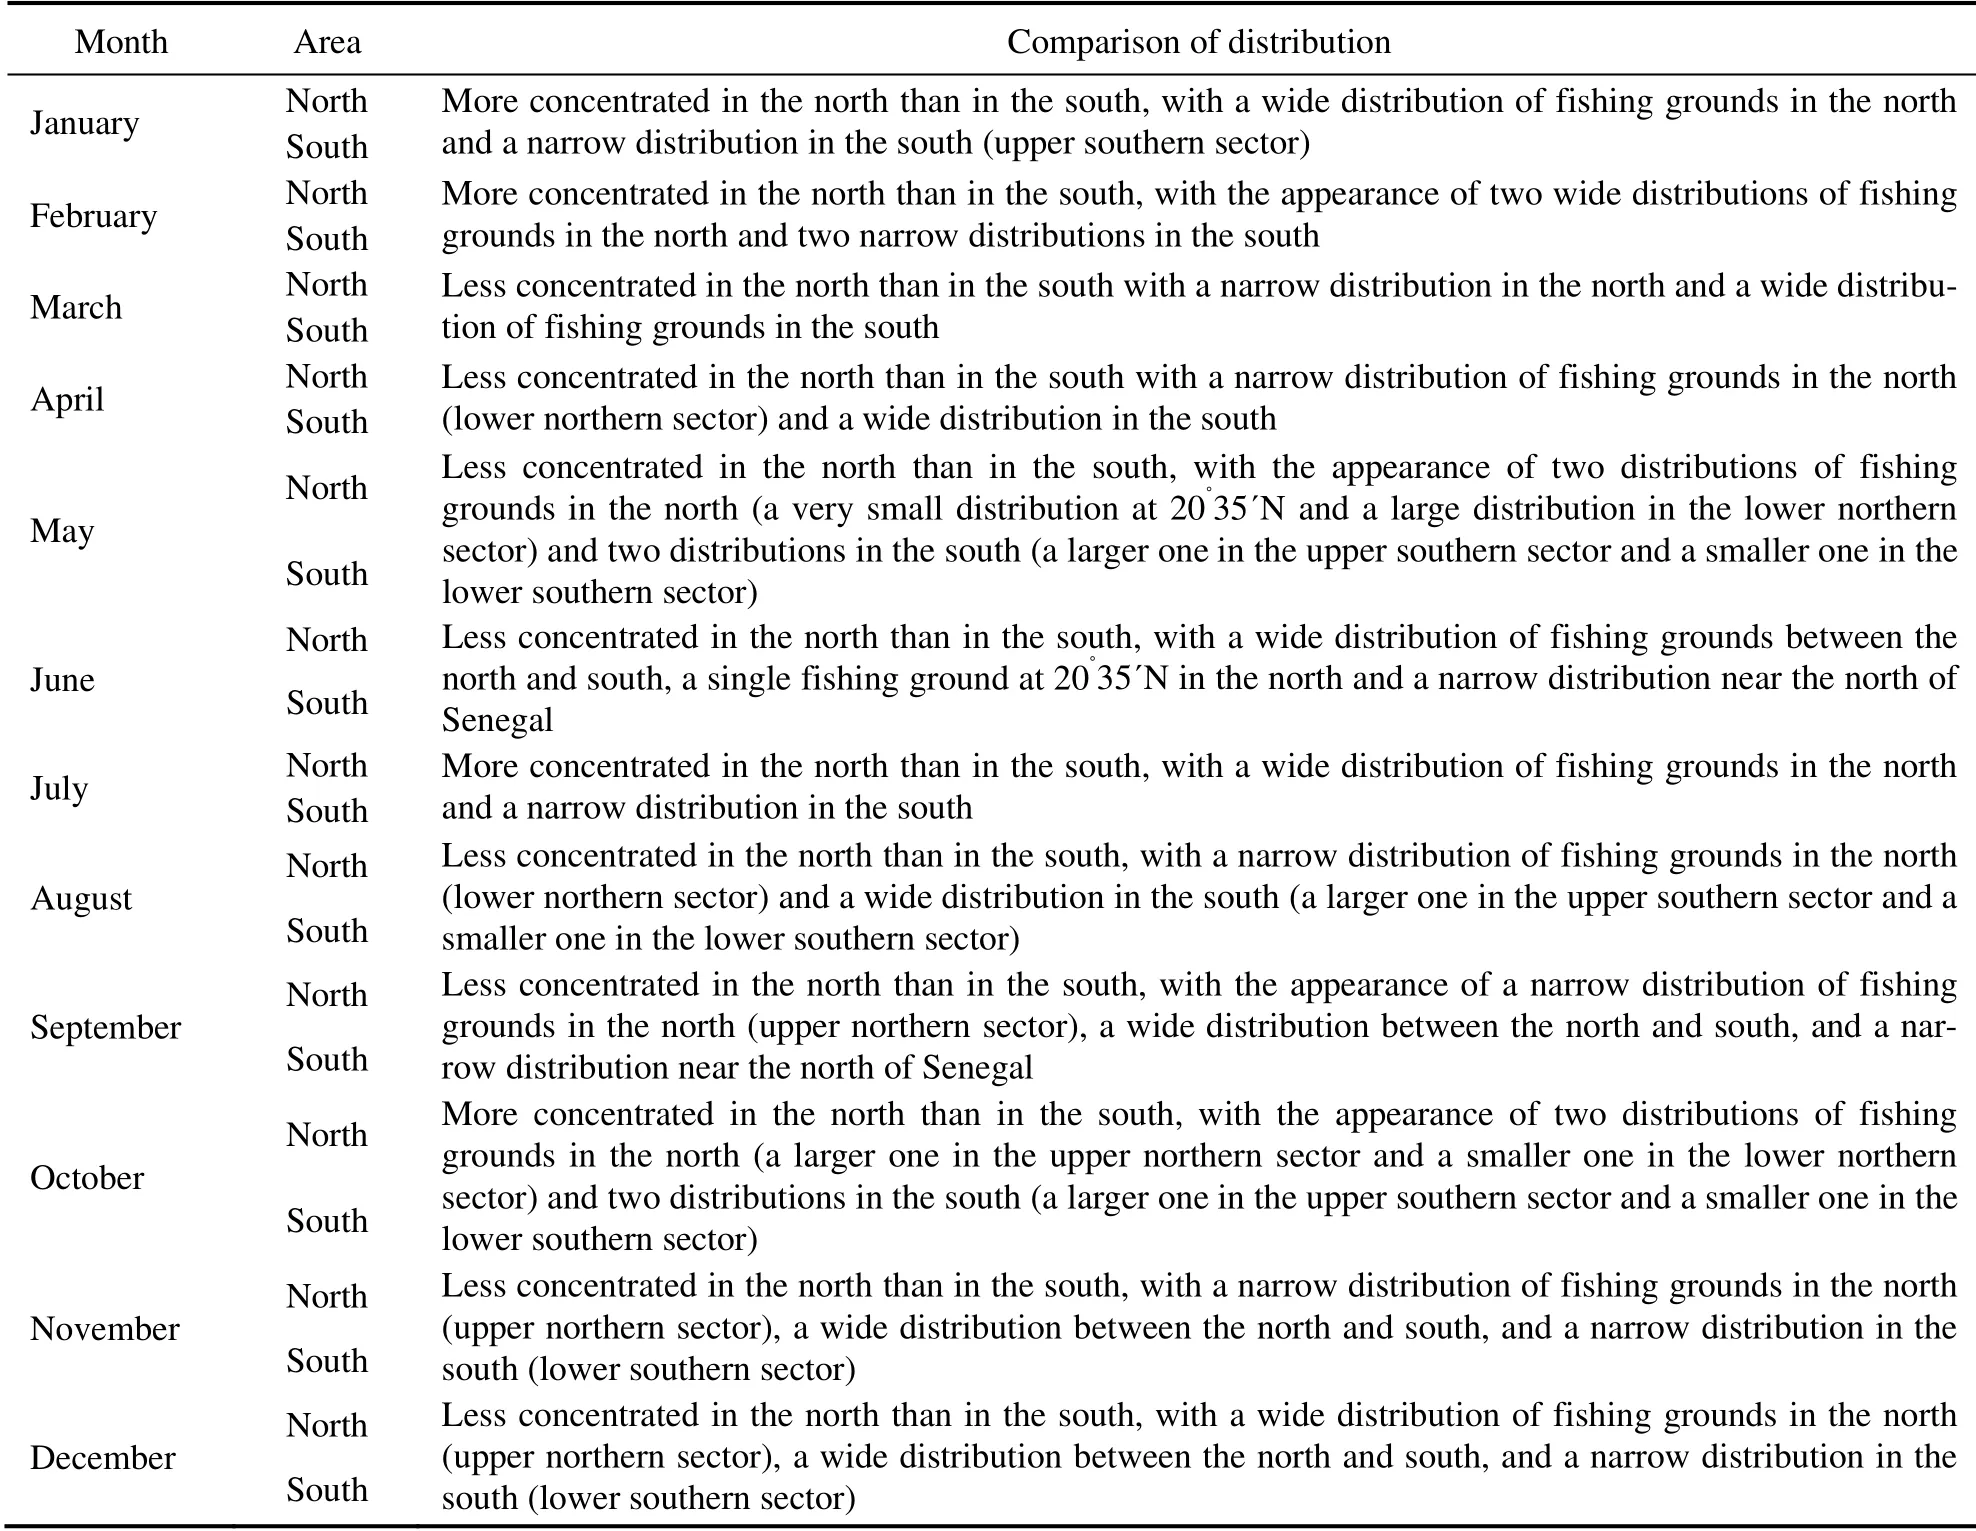
Table 4 Comparison of monthly fishing grounds distribution from 2014 to 2017
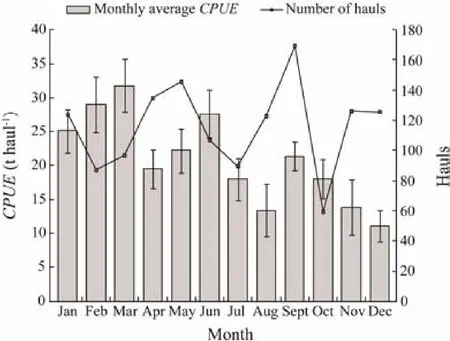
Fig.10 Monthly average CPUE and fishing effort distribution of small pelagic fishes from 2014 to 2017, estimated from Chinese purse seine fishery in Mauritanian waters.

Table 5 Central of gravity CPUE distribution from 2014 to 2017
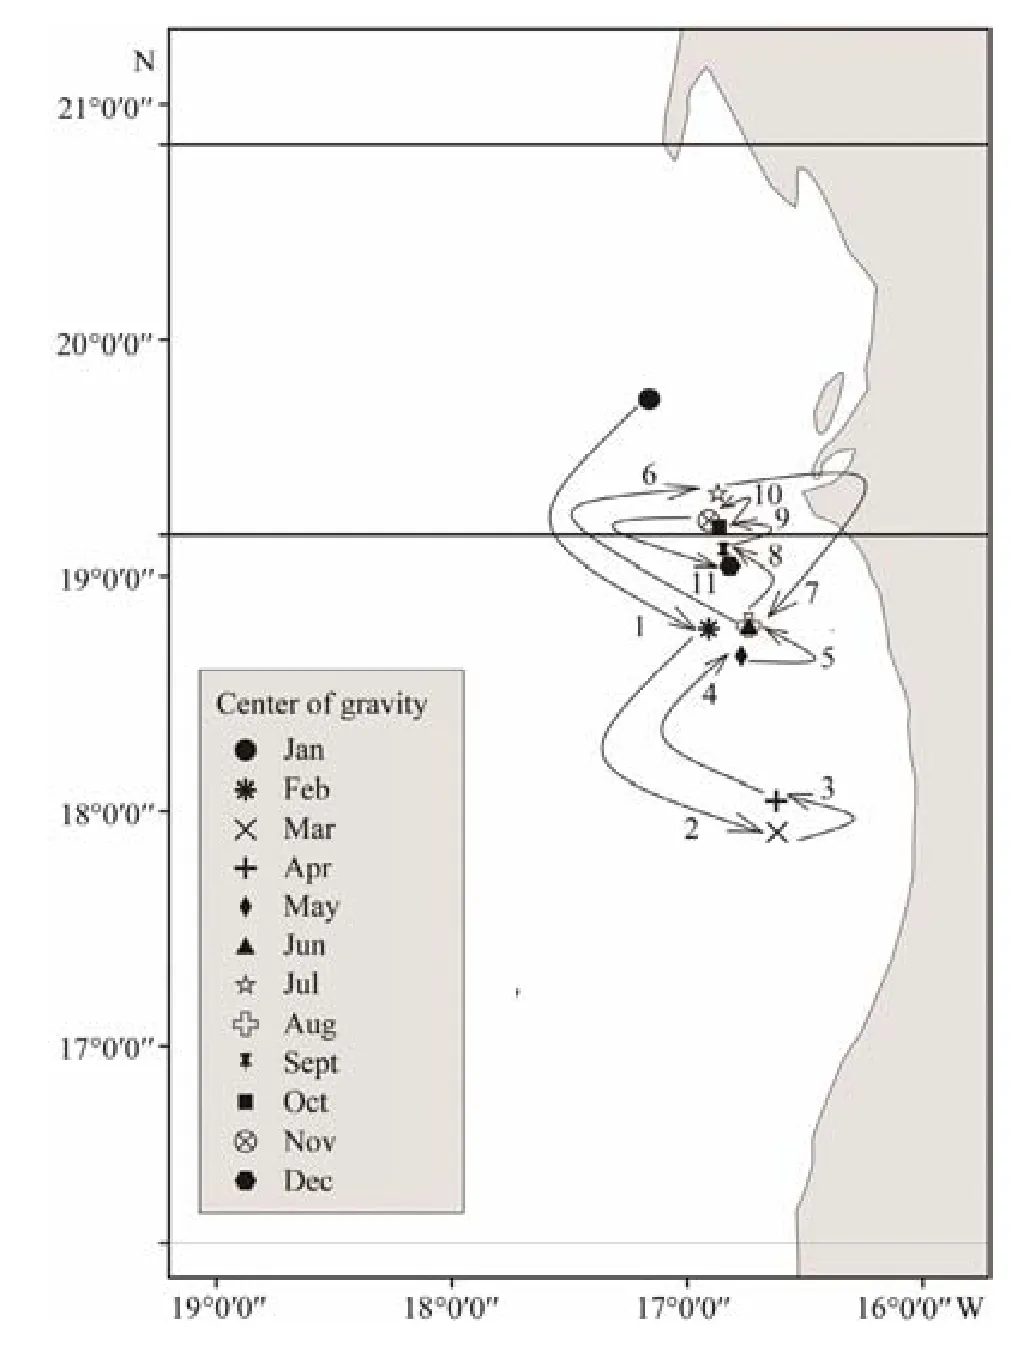
Fig.11 The monthly distribution of center of gravity.
We found that chub mackerel and horse mackerel preferred colder water than warmer water and were in proximity to the upwelling system. The round sardinella preferred warmer water but could adapt itself seasonally in colder water during the upwelling system. These results varied from the classification of these species by the Canary Current Large Marine Ecosystem (CCLME), which identified two thermal preferences for small pelagic species: preference of cold water (chub mackerel, Atlantic horse mackerel, and sardine) and preference of warm water (S. aurita, S. maderensis, T. tracae). Generally, the coldwater species tended to spread farther to the north than warm-water species. Seasonally, the two categories migrated northward when water temperatures rose and upwelling contracted to the north in summer. When water temperatures dropped and upwelling extended farther southward, the two categories shifted their distribution to the south in winter. The largest small pelagic fish stocks were found in the waters of northern Mauritanian and Western Sahara where upwelling was the strongest. Temperature is generally utilized as an indicator of ecological change and upwelling (Muhally et al., 2006). It is also one of the factors that significantly affect fish distribution through metabolism, gonad growth, and predation (Raab et al., 2013; Cheung et al., 2015; Lynch et al., 2017). Temperature can indirectly affect the level of reproduction,survival, and catches of fish (Rivai et al., 2018). The results of our study illustrated that SST was highly correlated with all three target small pelagic species. Chub mackerel and horse mackerel are correlated with SST with a high probability of finding both species in the area with a low temperature (13.49–22℃). In contrast to chub mackerel, horse mackerel tolerate a small range of high temperature (25–26.5℃ and greater than 28℃) and prefer warm water. Round sardinella preferred higher temperature, but the result also showed its tolerance to a small low temperature range (15–17℃). A similar explanation can be employed in terms of the spatial effect from the relationship between longitude, latitude, and three target speciesPUE. Longitude and latitude were correlated with the target species in the three zones and coast (all target species) close to the Arguin Bank (chub mackerel)and Timiris Cap (horse mackerel), while Arguin Bank and Timiris Cap are the two main nursery areas off Mauritania(Boely et al., 1982). The targeting of spawning areas of small pelagic species along the coast can also explain their high probability close to the coast, especially round sardinella, which spawns in areas where the continental shelf broadens or in coastal indentations (Roy et al., 1989;Mbaye et al., 2015). Latitudinally, the high probability of the three target species in the three distinct zones, two zones, or central zone can explain their latitudinal variation during the study period and provide evidence of their migration pattern. However, the impact of SST on target small pelagic fishes in the study area off Mauritania should be further studied to better understand the effect of area on target species.
The high probability of finding chub mackerel, horse mackerel, and round sardinella occurred near the SST fronts (30–110 km, greater than 110 km, and 50–140 km,respectively). The oceanic fronts can play a key role in the ecology of small pelagic fishes. Some studies have reported that fronts are linked to habitat productivity (Murase et al., 2009). In our study, a nonlinear relationship betweenPUEand Df was observed in chub mackerel,horse mackerel, and round sardinella because of prey availability. In particular, the high concentration of food particles for feeding organisms, such as phytoplankton and zooplankton, often accumulate in frontal zones (Bakun, 2006). In Mauritanian waters, small pelagic fishes feed on phytoplankton and zooplankton (Valdes and Deniz,2015), which aggregate at fronts. This phenomenon could also be explained by the strong association of small pelagic fishes with the low temperature in areas influenced by seasonal upwelling.
The lack of a significant correlation between EKE and all target speciesCPUEmight be explained by the limited fishing area of Chinese light purse seiners, which did not include the full range of EKE. Mauritanian waters are strongly influenced by trade winds and currents from the CCLME, which covers a vast region (9˚–35˚N) with marked geographical/topographical diversity. Oceanic mesoscale eddies are often present in the CCLME and almost continuously spun off by the islands of the Canary archipelago. The Canary eddy carries physical and biochemical properties from the cold-rich upwelling eastern boundary toward the interior ocean and extends the influence of the CCLME to the west. This phenomenon propagates and generates yearly long-lived anticyclones and leads to an increase in primary production (Sangrà et al., 2009).Thus, eddies are the main source of westward propagating EKE, which is as high as that transported southward by the Canary Current.
Small pelagic fish distribution is sensitive to changes in salinity (Sabatés et al., 2006). Salinity is correlated with all the target species with a high probability of finding the species in the area with salinities between 35.5 and 36,between 34.2 and 35.9, and between 35.4 and 35.8 for chub mackerel, horse mackerel, and round sardinella, respectively. This situation suggests that small pelagic fishes prefer high salinity below their maximum tolerance of 36.70 (Paramo et al., 2003). However, our study implied that salinity likely affects the target speciesCPUEdistribution because they are sensitive to gradient changes of salinity, although they can tolerate higher salinity. Our results also indicate that the probability of finding target species in the salinity between 35 and 36 is high, and this salinity might be due to climate change.
4.2 CPUE Distribution
This study revealed the variation in the spatial distribution of monthly average CPUEs of small pelagic fishes and showed a distinct seasonal migration pattern (Figs.9,10, 11). These observations could explain the probable seasonal migration pattern, i.e., the consistent group or cohort of small pelagic species that can be associated with and migrate to the fishing grounds. The distribution of dominant small pelagic fishes might be related to the intensity of upwelling in Mauritanian waters. Mapped CPUE distributions likely reflect the general fish distribution or changes in fish distribution in the study area. Maps may be reliable for the management of the presence/absence of small pelagic fishes (Fig.1) because seines are allowed to fish in Mauritania waters in the whole year without ceasing (ATLAFCO, 2016). The studied small pelagic fishes have undergone considerable variations in their distribution and abundance over time (Fig.9). The spatial distribution along the Mauritanian waters showed that the three mixed small pelagic fishes were distributed in three zones of Mauritanian waters (northern, central, and southern),but their abundance varied, generally decreasing from north to south (Table 4). This situation might be related to the intensity of upwelling, which is permanent and intense in the north and is strongly seasonal, while it is less intense in the south. It can also be explained by the habitat structure at Cape Timiris by the associated water masses of North and South Atlantic Central Waters (NACW and SACW), which are dominated by the higher nutrient level and are the most productive along the Northwest Africa Region (Aristegui et al., 2009). The central area of Mauritania is also an important fishing ground and has a high level of mesoscale oceanographic variability arising from its geographical heterogeneity; Thus eddies and fronts with a wide thermohaline range are induced, thereby serving as a feeding area for a large variety of pelagic species,including many megafauna species (Zeeberg et al., 2008).
In comparison with previous studies, our study found a similarity in the migration pattern from north to south in October–December (Boely, 1982) and November–December (Hofstede et al., 2007) and from south to north in April–August (Zeeberg et al., 2008) and June–July (Hofstede et al., 2007). Our results differed from three other studies (Boely,1982; Hofstede et al., 2007; Zeeberg et al.,2008) in terms of the migration pattern from north to south (December–January; Zeeberg et al., 2008) and from south to north (Boely, 1982). These differences occurred possibly because 1) the small pelagic fishes were broadly distributed along the Mauritanian waters, and our study area was limited to the purse seine fishery; 2) small pelagic fishes were found in mixed-species schools and migrated together; and 3) different small pelagic species had different seasonal migration patterns and feeding preferences during the year.
The highest concentration of the centers of gravity in the central area of Mauritanian waters might be related to the strong upwelling of nutrient-rich waters sustaining high primary productivity, eventually leading to the high abundance of small pelagic species in the area and to the front, which served as a feeding area for a large variety of pelagic species, including many megafauna species. Thus,the CG in March and April in the southern Mauritanian waters might be associated with upwelling that extended southward, and this phenomenon occurs only in winter–spring in the southern sector (Cropper et al., 2014). The CG in January (winter) in northern Mauritanian waters may be related to the strong permanent upwelling in the north during winter (Benazzouz et al., 2014; Cropper et al.,2014).
5 Conclusions
In this study, we investigated the relationship between three dominant small pelagic fishes and environmental factors and the spatiotemporal distribution of three mixed dominant pelagic fishes in Mauritanian waters. The small pelagic fishes with variable abundances generally decreased from north to south with a formation of three zones.This study suggested that 1) the distribution of the three dominant small pelagic fishes might be related to the intensity of upwelling in Mauritanian waters; 2) the oceanic fronts might play a key role in the ecology of chub mackerel, horse mackerel, and round sardinella; 3) Chl-a concentration might be associated with the feeding grounds of chub mackerel; 4) the target species distribution appeared sensitive to gradient changes in the amount of salinity; 5) three zones (northern, central, and southern) were found with variable abundances; and 6) the high concentration of CG in the central zone might be related to the strong upwelling of nutrient-rich waters. We recommended that Tweedie-GAM and geostatistical analysis could be broadly used to analyze the relationship between the spatiotemporal distribution of small pelagic fishes and the environmental factors, especially for a high amount of zero catch data, and to examine the spatiotemporal distribution and spatial patterns of small pelagic fishes.
Acknowledgements
This project is funded by the Ministry of Agriculture and Rural Affairs of the P. R. China under Project of Fishery Exploration in 2017 (No. D-8006-17-0138). We thank Mr. L. Y. Lin, Mr. Z. J. Zeng, and the crew of purse seiners (Fuyuanyu097 and Fuyuanyu098) of Hongdong International (Mauritanian) Fishery Development Co., Ltd.for their support. We also thank Dr. Mike Pol of the Massachusetts Division of Marine Fisheries, US for the revision of the English version.
杂志排行
Journal of Ocean University of China的其它文章
- Abyssal Circulation in the Philippine Sea
- Numerical Study of Storm Surge Inundation in the Southwestern Hangzhou Bay Region During Typhoon Chan-Hom in 2015
- Interannual Variability and Scenarios Projection of Sea Ice in Bohai Sea Part I: Variation Characteristics and Interannual Hindcast
- Probability Distribution of the Hull Motion and Mooring Line Tension of Two Floating Systems
- Suppression of Vortex-Induced Vibration by Fairings on Marine Risers
- The Characteristics of Storm Wave Behavior and Its Effect on Cage Culture Using the ADCIRC+SWAN Model in Houshui Bay, China
