Histopathological analysis of the correlation between uveal melanomas and retinal tissue
2020-02-08
1Beijing Tongren Eye Center, Beijing Tongren Hospital, Capital Medical University, Beijing Intraocular Tumor Diagnosis and Treatment Key Laboratory, Beijing 100730, China 2Beijing Institute of Ophthalmology, Beijing Tongren Eye Center, Beijing Tongren Hospital, Capital Medical University, Beijing Intraocular Tumor Diagnosis and Treatment Key Laboratory, Beijing Ophthalmology & Visual Sciences Key Laboratory, Beijing 100730, China 3Department of Ophthalmology, Medical Faculty Mannheim, Ruprecht-Karls-University of Heidelberg, Mannheim 69115, Germany
Abstract
•KEYWORDS:uveal neoplasma; pathology; melanoma
INTRODUCTION
Uveal melanoma is the common malignant melanomain adults, second only to cutaneous malignant melanoma. And a well-known phenomenon above uveal melanoma that retinal degeneration associated with retinal thinning is described in textbooks of ocular pathology and is documentedviamicrophotographs. But as oncologists, something details is still not clear, such as, if the retinal thinning is causing by physical extrusion or hypoxic-ischemic reaction by tumor factors? Previous clinical histopathological studies on uveal melanoma were mainly focused on the analysis of the histopathological features, such as tumor cell type, tumor location, tumor size and vessel characteristics, and the survival prognosis of the patients[1-2]. Investigations on the spatial relationship between uveal melanomas and the adjacent retina have been rare so far. We therefore conducted this study on the relationship between malignant uveal melanomas and spatially related tissue in the adjacent retina.
SUBJECTS AND METHODS
The study included eyes which were enucleated due to a malignant uveal melanoma in the hospital.The study was approved by the Medical Ethics Committee and was conducted according to the Declaration of Helsinki Principles. After enucleation, all globes were fixed in 10% formalin and embedded into paraffin. Slices each 5 μm thick were stained by hematoxylin-eosin. Exclusion criteria were pre-enucleation radiotherapy or transpupillary thermotherapy or tumor tissue sampling after enucleation. According to the updated Callender classification, we differentiated between the predominating tumor cell types of spindle type, mixed type, epitheloid type, and other predominating tumor cell types such as balloon cell type, and necrotic cell type[3]. The tumor size and shape were determined by the tumor peak height, the maximal tumor base diameter, and the ratio of tumor peak height divided by the maximal tumor base diameter(R-value) (Figure 1)[4-8]. Retinal thinning was defined by three criteria all of which had to be fulfilled: A marked decrease in retinal thickness as compared with the adjacent areas; retinal thickness in the tumor region not greater than 50% of the retina thickness at the other side of the globe at the same degree of excentricity; and a location more than 5 mm posterior to the ora serrata (Figure 2). Criteria for the definition of retinal invasion by the tumor were tumor cells visible between the outer nuclear retinal layer and the internal limiting membrane (Figure 3). The depth of the tumor invasion into the retinal tissue was assessed by the retinal layer showing tumor cells and located closest to the inner retinal surface[1]. A tumor associated microcytic degeneration of the retina was distinguished from a micro-cystoid retinal degeneration caused by the exudative retinal detachment (Figure 4)[9-10]. When comparing the tumor-associated micro-cystoid retinal degeneration with the retinal detachment-associated degeneration, a severely reduced cell density of the outer nuclear layer and inner nuclear layer of the retina and a severe vacuolar cystoid degeneration as sign for the tumor-associated micro-cystoid retinal degeneration was taken into account. For the diagnosis of a tumor-associated micro-cystoid retinal degeneration, the following criteria had to be fulfilled: location within the range of approximately 2 mm from the tumor, cell count of the outer nuclear layer in tumor invasion area was not greater than 1/2 of that in non-invasion area; Red-stained subretinal fluid was clearly visible around.

Figure 1R-value, the ratio of tumor peak height divided by the maximal tumor base diameter.
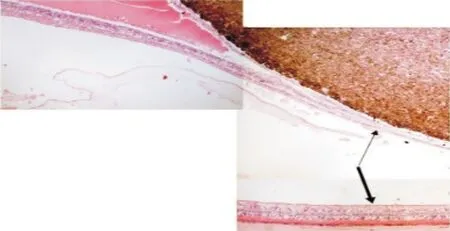
Figure 2 Retinal thinning (thin arrow) in the vicinity of a malignant uveal melanoma as compared to the contralateral retina (thick arrow) within the same eye.
The Motic Digital Medical Image Analysis System (Med 6.0; Company name: Motic China Group CO., LTD; Xiamen, China) software was used to measure the parameters described above. Two ophthalmic pathologists independently of each other carried out the assessments and re-reviewed those measurements which were not congruent. Statistical analysis was performed using a commercially available software package (SPSS for Windows, version 22.0, IBM-SPSS, Chicago, IL, USA).

Figure 3 Schematic of tumor cell invasion depthA: Tumor invasion to the outer nuclear layer; B: Tumor invasion to the inner nuclear layer; C: Tumor invasion to the ganglion cell layer; D: Tumor invasion to the internal limiting layer.

Figure 4 Retinal tissues of the same specimenA: Severe microcystic degeneration of retinal tissue occurred around the tumor tissue; B and C: Cell counts within a specific range were compared.
RESULTS
The study included 102 patients (102 eyes; 44 men) with uveal melanoma with a mean age of 45.6±12.4 (range: 15-78) years. Stratified by tumor cell type, 76 (75%) uveal melanomas belonged to the spindle cell type, 6 (6%) to the epitheloid cell type, 16 (16%) to the mixed cell type and 4 (4%) showed predominantly other cell types. In 3 (2.9%) cases the tumor was located in the ciliary body, 28 cases of ciliary body and choroid melanoma (27.5%), 71 cases of choroid melanoma (69.6%). In the result ofR-value, 46 (45.1%,R>0.5) cases were tall pointed shape uveal melanoma, and 8 (7.8%) of them wereR≥1.0; 56 (54.9%,R≤0.5) cases were flatter shaped, 10 (9.8%) of them wereR≤0.15.
A retinal thinning was detected in 43 (43%) eyes and retinal invasion by the tumor cells in 86 (84%) eyes (Table 1). In 20 (20%) globes, the retinal invasion reached the outer nuclear layer, in 12 (12%) eyes the inner nuclear layer, in 30 (30%) patients the retinal ganglion cell layer invasion, and in 24 (24%) eyes, the tumor cells reached the inner limiting membrane. 73 patients could be observed clear retinal detachment and the following cystoid degeneration, with 37 (51%) of them showing a tumor-associated micro-cystoid degeneration and 36 (49%) of them without that above (Table 2).The maximal tumor height ranged between 1.2 mm and 15.6 mm with a mean of 8.3±3.6 mm. The tumor base diameter ranged between 4.8 mm and 31.2 mm with a mean of 17.3±6.5 mm. The meanR-value was 0.53±0.32 (range: 0.07-1.80). Its distribution detected that smallR-values are more frequent than higherR-values (Figure 5).
There were many factor such as tumor size,R-value, invasion and tumor-associated micro-cystoid degeneration could influence the retinal thickness (Table 3), and the different between the groups ofR-values and invasion was more trend to be the important factor, and worth an in-depth analysis.
Comparing theR-values between the group of eyes with retinal thinning (n=43) and the group of eyes without retinal thinning (n=59) revealed that the meanR-value was significantly higher in the group with retinal thinning than in the group without retinal thinning (0.69±0.31vs0.42±0.27;P<0.01). Comparing the eyes with retinal invasion (n=86) with the eyes without retinal tumor invasion groups (n=16) showed that the meanR-value was slightly, however statistically not significantly (P=0.09) higher in the group with retinal tumor invasion (0.56±0.33vs0.41±0.25).
In the vicinity of the tumors,we often found secondary tissue changes in the retina including a severely reduced cell density in the inner nuclear layer and outer nuclear layer and a marked vacuolar cystoid degeneration. The extent of this retinal vacuolar cystoid degeneration exceeded by far a secondary retinal degeneration, and was known to occur in association with retinal detachment which includes cell shrinkage, reduced number of ganglion cells, cell loss in the inner nuclear layer and outer nuclear layer, and multi-layering of retinal pigment epitheloid cells (Figures 6-8)[9-10].
Since the tumor-associated micro-cystoid retinal degeneration could also cause by retinal tumor cell invasion, we performed a paired Chi-square-test and compared the prevalence of tumor-associated micro-cystoid degeneration and retinal tumor cell invasion. It did not show a statistically significant association (P=0.012) (Table 2). Assuming that the barrier function of the retina as a whole and the functions of the different retinal layers were impaired in association with the retinal thinning, making it more vulnerable to a tumor cell invasion. We carried out a correlation analysis between retinal thinning and retinal invasion and found a statistically significant association (χ2=6.85;P=0.01) (Table 1).
Table 1χ2test for comparison between retinal thinning and retinal invasion

ItemsCountRetinalinvasionPositivePercentage(%)NegativePercentage(%)Retinalthinning434140.222Non-thinning594544.11413.7Total1028684.31615.7
Table 2χ2test for comparison between tumor microcystic degeneration and retinal invasion
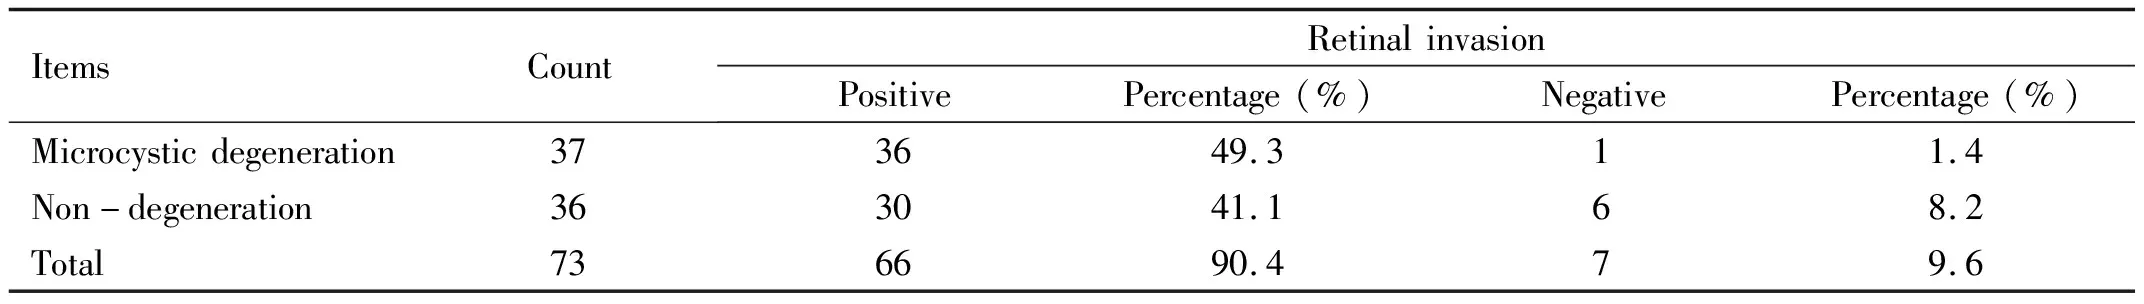
ItemsCountRetinalinvasionPositivePercentage(%)NegativePercentage(%)Microcysticdegeneration373649.311.4Non-degeneration363041.168.2Total736690.479.6
Table 3 Relationship between the ration of retinal thickness and 4 factors

ParametersGroup1RetinalthicknessratioGroup2RetinalthicknessratioTumorsizeMedium12/2744.44%large31/6845.59%Rvalues≤0.513/5623.21%>0.530/4665.22%InvasionNegative2/1612.50%Positive41/8647.67%TAMCDNegative15/3641.67%Positive18/3748.65%
TAMCD: Tumor-associated micro-cystoid degeneration.

Figure 5 Frequency distribution range of height-to-base ratio (R-value).
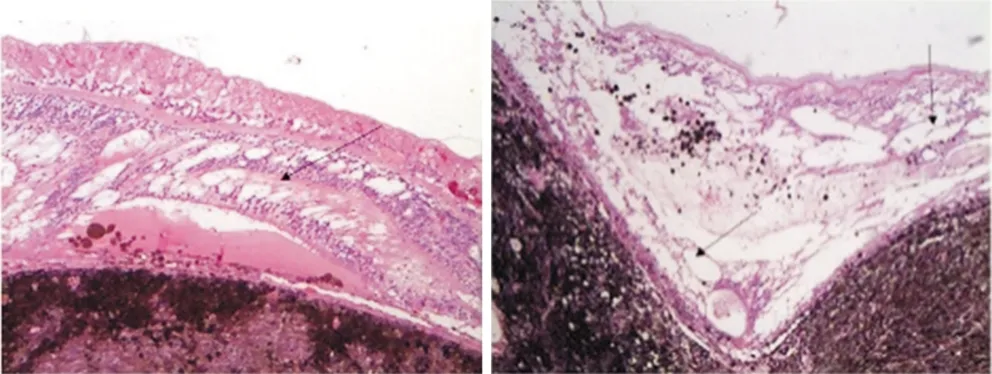
Figure 6 Severe vacuolar cystoid degeneration in the retina.
DISCUSSION

Figure 7 A large amount of tumor cells in the RPE layer showed diffuse invasion.
The meanR-value was significantly higher in the group of eyes with retinal thinning than the group without it (0.69±0.31vs0.42±0.27;P<0.01), and the meanR-value was slightly, however statistically not significantly (P=0.09), higher in the group of globes with retinal tumor invasion than group without that (0.56±0.33vs0.41±0.25). The results may suggest that a highR-value indicating a prominent tumor is associated with tissue thinning in the adjacent retina, and marginally significantly with intraretinal tumor cell invasion.

Figure 8 Severe retinal cystic degeneration, with unclear structure of retinal layers.
R-value of uveal melanomas may be of importance for the secondary involvement of the adjacent retina. However, the three-dimensional shape of uveal melanomas was hard to generalize, and in this paper, we use theR-value to analyze the shape of cross seciton.
Table 4 Height, base diameter andR-value measured in related literaturemm

AuthorsCountHeightMinMaxBasediameterMinMaxRThispaper1028.3±3.61.215.617.3±6.54.831.20.53±0.32ZhuRL[11]539.8±3.43.817.213.5±3.87.021.6-Shields[12]80335.5±4.5024.011.1±11.01.033.0-Richtig[13]935.71.714.910.44.118.9-ZhaoZJ[14]266.93.313.78.54.312.2-Sobottka[6]66------0.60±0.16WangQP[5]24------0.93±0.32
The issue of the shape of uveal melanomas’ cross section has already been addressed in previous studies (Table 4). As a round tumor, the ideally uniformedR-value which suitbale for surface tension, should be approximately 0.5.Invitroexperiments by Chengetal[15]showed that the shape of the tumor was affected by its surface pressure. Tumors grow into a spherical shape or an ellipsoid shape due to the different surface tension between them and the surrounding tissues. As shown in Table 4,R-values of uveal melanoma averaged between 0.5 to 0.93. In our study, theR-value in the retinal thinning group was 0.69±0.31, which mean that the tumor tended to be in a tall pointed slice shape, while theR-value in the non-thinning group was 0.42±0.27, that is, the tumor tended to have a flatter configuration. In the literature data, previous studies of retinal thinning involved axial length[16], retinal occlusion[17]and melanoma brachytherapy[18], or even choroid thickness on melanoma[19]and myopia[20]. One may speculate that factors affecting retinal thinning may be a mechanical compression of the tumor cells, and tissue ischemia and hypoxia caused by the tumor cell invasion. Katira and colleagues[21-22]found in the mechanical model of the cell that tumor tissue during proliferation could affect the surrounding tissue structure through mechanical pressure and biochemical neurotransmitter, and these two factors might influence each other. In our study, at-test comparing two independent samples ofR-values between the retinal thinning group and the non-thinning group was carried out, with statistically significant difference (P<0.01). Someone might think about a pressure atrophy of the retina with enlargement of the tumor as well as a vascular undersupply of the outer retina as well as that the tumor associated exudation might induce a break-down of the blood-retina-barrier leading to a retinal edema that will induce retinal degeneration and retinal thinning at the end. However, retinal thinning is not always associated by retinal micro-cystoid degeneration in our 102 cases. Therefore, the mechanical compression on the retina, especially the intense compression of a tall pointed tumor on the retinal vertex area, was considered to be the main reason for the retinal thinning; while the biological effects resulted from retinal invasion played a limited role in affecting the retinal thinning.
In this study, we found that the retinal micro-cystoid degeneration occurred in the various layers of retinal tissues, with its severity varying greatly. Since the severe micro-cystoid degeneration could not be simply explained with retinal detachment, it was speculated to be associated with the biochemical actions of tumor cells[21]. There had been little related information about researches on human retinal detachment due to restrictions on obtaining fresh materials. Among currently known animal models[23-25], micro-cystoid degeneration of retinal tissues and atrophy of photoreceptor cells might occur after retinal detachment in primates, with major manifestations including atrophy of photoreceptors, retinal structural disorder, edema, and vacuolar degeneration in the outer and inner nuclear layers and the ganglia. Experimental model of retinal detachment in rabbits by Wangetal[8]showed that RPE cells could be turned into a multi-layer structure or an increased cell volume, multi-nuclear and polymorphic. Baietal[26]reported that, out of 10 cases of pathological examinations, 6 cases were observed with retinal edema and areas of cystic degenerated.
Secondary exudative retinal detachment of in eyes with uveal melanomas is a common finding[27], as its incidence mentioned in the COMS report was 99%[1]. To exclude the influences of retinal detachment itself on the retinal tissues, we compared the retinal micro-cystoid degeneration between the invasion and the non-invasion areas of tumor tissues under the conditions of retinal detachment. Although the final statistical results could not prove a causal relationship, we still found such tendencies: the invasion of tumor cells could not lead to an increase in the rate of cystic degeneration of retinal tissues. But in our actual observation process, there were marked atrophy of photoreceptor and layers of cells with reduced densities of the retinal layers after the invasion, and a more severe degree of retinal cystic degeneration. Since the retinal cystic degeneration was too severe in this case (Figure 8), it was considerably difficult to develop indicators for further measurements.
Limitations of our study should be discussed. First as for any hospital-based study, the questionarises whether the study population is representative for the whole group of patients with the disease. Since our study was not focused on the prevalence of observations but on associations between parameters, the non-population-based patient recruitment in our study may not have markedly influenced the results and conclusions. Second, we did not carry out a genetic analysis of the tumors, so that we were not able to assess association between the genetic pattern of the tumors, their slice shape and size, and their tendency to invade the adjacent retina and induce secondary retinal change including retinal thinning.
In conclusion, a highR-value indicating a prominent tumor was associated with tissue thinning in the adjacent retina in our study population, and it was marginally significantly with intraretinal tumor cellinvasion. Shape of uveal melanomas cross section is of importance for the secondary involvement of the adjacent retina.