Numerical analysis of mechanical ventilation using high concentration medical gas mixtures in newborns
2020-01-07IraKatzAudeMiletMatthieuChalopinraldineFarjot
Ira Katz,Aude Milet,Matthieu Chalopin,Géraldine Farjot
Medical Research &Development,Healthcare World Business Line,Air Liquide Santé International,Paris Innovation Campus,Les Loges-en-Josas,France
Abstract
Key words:mechanical ventilation;neonate;argon;xenon;heliox;nitrous oxide;numerical model;pressure control mode
INTRODUCTION
Gases with proven or exploratory medical use in adults also have possible beneficial indications for children,including neonates.1-4When administered in relatively high concentrations the mechanical properties of the inhaled gas (dynamic viscosity and density) can become significantly different from air.5This physical fact has implications in mechanical ventilation where adequate respiration and injury to the lungs or respiratory muscles can worsen morbidity and mortality due to purely physical mechanisms.6The challenges of mechanical ventilation are heightened when treating newborns.7-12Lung injury in the neonatal lung is often provoked due to the immature morphology,inducing defective alveolar septation,impaired angiogenesis and pathologic extracellular matrix remodeling resulting in lung growth impairment.Furthermore,a recent Cochrane analysis noted that there is an urgent need for more information in full-term newborns to optimize oxygenation and ventilation during mechanical ventilation.13Thus,it is interesting to assess the effects of the medical gas mixture on the mechanical ventilation of newborns.
Numerical analysis usingin silicobiomechanical models that consider the fluid mechanics and neonate morphology can add insight to mechanical ventilation through the ability to perform perfectly controlled and parameterized experiments.Numerical modeling can especially be helpful to understand the mechanical ventilation of neonates becausein vivodata is difficult to obtain in this vulnerable population.14
Building on a previous paper reporting a numerical analysis of mechanical ventilation parameters with air in full-term newborns,15in this paper we use an engineering pressure loss model16-18to analyze the administration of medical gas mixtures.Only pressure control mode mechanical ventilation will be considered at it is most often used for neonates.9,13
Particular gases of interest in this context are helium,nitrous oxide,argon,and xenon,with medical air as a control case.Helium-oxygen mixtures (often referred to as heliox) are generally used to improve respiration,19not as pharmaceutical agent.For example,the addition of heliox to the standard practice of permissive hypercapnia in neonates facilitated improvement in gas exchange,which allowed a decrease in ventilator settings and oxygen exposure,both of which are known to contribute to lung injury in this population.2While one study found that nitrous oxide may be helpful for intubating preterm neonates,it was noted that a thorough evaluation of effectiveness and safety was needed.1A neonatal rat model study indicated that argon and xenon (but not helium) provide neuroprotection against moderate and severe hypoxia-ischemic brain injuries likelyviareduction of apoptosis.3Indeed,due to its neuroprotective properties,20,21xenon and argon have been considered as an additional treatment to cooling for neonatal encephalopathy.Broad et al.4showed the potential of this therapy by administering 45-50% inhaled argon from 2-26 hours using a mechanical ventilator in a neonatal piglet model.
Furthermore,cardiovascular safety of this argon therapy was assessed in newborn piglets in a study and found that argon ventilation did not result in a significant change of heart rate,blood pressure,cerebral oxygen saturation,electrocortical brain activity,or blood gas values.22However,this study did not directly address ventilation safety.The chemically inert anesthetic xenon may provide a safe alternative to meet the growing concern that there are developmental problems associated with anesthetic exposure of the infant brain.23Xenonbased anesthesia is not indicated for children;however,in a pilot trial,xenon-augmented sevoflurane anesthesia in schoolaged children was shown to be feasible,and associated with decreased ephedrine requirements.24Furthermore,there has been development of a recirculating xenon ventilator for newborn piglets to study neuroprotection25,26that was employed in xenon clinical studies.27,28
MATERIALS AND METHODS
Design
The numerical analysis is based on the system shown schematically in Figure1.As the inhalation cycle begins,the ventilator maintains a constant pressure (thus called Pressure Control Mode) at the Y-Piece after a prescribed rise time,thus driving gas flow into the external breathing circuit (here consisting of a filter and endotracheal tube) and into the lung starting at the trachea and terminating at the alveoli.As gas accumulates in the alveoli,the pressure there rises proportional to the lung compliance.The exhalation cycle begins when the ventilator opens the breathing circuit to the ambient through a valve that maintains constant positive pressure at the Y-Piece (positive end expiratory pressure,PEEP).The higher pressure in the lung now drives gas out of the lung,through the external breathing circuit,and the ventilator (including the PEEP valve) to the ambient.The numerical analysis consists of a calculation of the pressure changes occurring along the gas flow path during both inhalation and exhalation that is then used to calculate the flow rate.Representative pressure,flow rate,and volume cycles are shown in Figure2.
Engineering pressure loss model
An engineering pressure loss model is used to determine the pressure distribution along the gas flow path.This model as applied to respiratory mechanics is described in a previous paper.17This approach is formulated as a steady mechanical energy balance on flow and the pressure at any location,in this case the Y-Piece in the breathing circuit,compared to the alveolar pressure for both inhalation and exhalation.This equation can be calculated for any set of gas mixture property values and breathing circuit assumptions by employing an engineering approach;i.e.,a summation of all the pressure losses in all of the straight flow conduits (called “major”) and all the components that change the velocity distribution (local acceleration or deceleration of the gas,are called “minor”).Assuming that the lungs airways are stiff and neglecting the effect of elevation changes,we can relate the pressure difference as shown in Equation (1),wherePY-PIECEandVare the pressure and velocity at the YPiece,PALVthe pressure in the alveoli (the velocity in the alveoli is taken to be zero),ρis the gas density,andαis a coefficient related to kinetic energy that depends on the flow profile (for a blunt (turbulent) velocity profileα= 1,and for a parabolic (laminar) profileα= 2).The summation on the right-hand-side of Equation (1) represents the head loss of pressure,due to the resistance of the external elements and the pulmonary airways that is expanded in Equation (2).


Figure1:Schematic diagram of the flow path through the external breathing circuit and internal airways.

Figure2:Pressure control mode ventilation patterns for Y-Piece pressure(top),flow rate (middle) and volume (bottom) as would be seen on a ventilator control screen.

The first sum on the right hand of Equation (2) accounts for pressure losses in each lung generation (GEN).The major losses are due to straight flow in an airway generation of length L and diameter D and the minor losses due to geometrical variation (a bifurcation of the respiratory tract) and characterized by a coefficient KBIF.
To characterize the flow,we use the non-dimensional Reynolds number that compares the effect of inertial forces over viscous forces.

whereρis the density of the gas,μ its viscosity,vthe velocity anddthe diameter.In the lungs,the flow is considered to be turbulent whenRe> 2000 and under this value,the flow is considered laminar.
For a laminar fully developed flow:

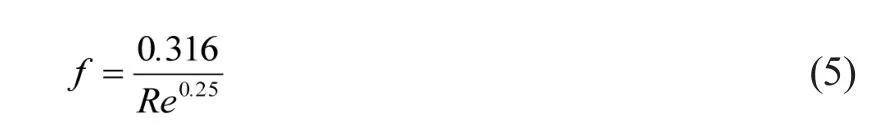
For a turbulent pipe flow,the Blasius correlation for smooth tubes is:
The minor loss coefficients,KBIF,representing the effects of airway bifurcations were previously calculated based on computational fluid dynamics simulations for inhalation and exhalation and as a function of the localRe.17Then the minor loss coefficient data were fit to curves to the formula:

The minor loss coefficients were recalculated on the bases of the flow rate and the gas mixture of the flow entering the bifurcation.Thus,the use of computational fluid dynamics simulations provided an estimate of the complex flow fields within the respiratory tract.
The external breathing circuit consists of two elements each with its own minor loss coefficient (KEXT):a filter and an endotracheal tube (ETT).For the ETT KEXTwas calculated based on the model given in Jarreau et al.29The filter was also accounted for in the tubing circuit and modelled with a minor loss coefficient in the form of Equation (6) and listed in Table1.16
Neonate morphology model
There is very little neonate morphological data (e.g.,airway dimensions) in the literature.For the analysis performed herein we adopted the morphology model previously used to study unsteady surfactant-laden liquid plug propagation in neonatal airways.30Based on the Weibel representation of the lung as a symmetric dichotomous tree,31the neonate model assumes that the trachea is the same dimensions as the 7thgeneration of the adult model and continues the adult sub-tree to its conclusion at generation 23 resulting in a neonate model from generations 0-16.The dimensions of the model are given in Table2.The constants A,B,C,D,E for Equation (6) are given in Table1 for generations 0 to 9;after generation 9 the minor losses are considered negligible.
Obstruction model
A recognized hazard of prolonged endotracheal intubation is progressive airway occlusion resulting from deposition of secretions on the inner surface of the ETT.32An obstruction model in the ETT was based on a numerical representation of the Rp50 resistor which is the smallest resistance value provided for use with an infant test lung (Michigan Instruments,Kentwood,MI,USA).33The Rp resistors are simple orifice plates,a metal disc with a concentric hole in it that creates a purely inertial loss,such that the loss is a parabolic function of the flow rate.
Gas mixture properties and pressure equations
Property values of the gas mixtures given in Table3 were calculated based on the methods described in the study by Katz et al.5
For each gas mixture with an ETT of 3 mm,both with and without the obstruction model,Equation (1) was evaluated from the Y-Piece to the alveoli over a range of inhalation and exhalation flow rates.These data were fit using Excel (Microsoft,Redmond,WA,USA) to the quadratic form similar to a Rohrer equation,34

Table1:Constants used in Equation (6) for determining bifurcation minor loss coefficients

Table2:Neonate morphology model dimensions

Table3:Gas mixture property values at 1 atm and 37°C

whereQis the inhalation or exhalation flow rate,andAGandBGare the fit constants specific to each gas on inhalation and exhalation,and with or without obstruction.
Numerical integration
The implementation in Excel of the pressure loss model as a ventilator is achieved by updating the pressure and flow over discrete time steps (2000 steps per ventilation cycle).In pressure control mode this is done by first updating the pressure target at the Y-Piece as would be controlled by the ventilator.Equation (7) is then solved for the updated flow rate based on the comparison of this fixed pressure to alveolar pressure from the previous time step.With a new value forQthe increased (or decreased in the case of exhalation) volume that accumulates in the lung is calculated,ΔVolume=QΔt,where Δtis the time step.Then the alveolar pressure can be updated based on this volume change and the compliance (C),ΔPALV=ΔVolume/C.
For exhalation,it is also necessary to calculate the pressure losses from the Y-piece of the breathing circuit through the ventilator,including the valve to produce PEEP.

For pressure in units of N/m2,Qin L/min,ρin kg/m3,μ in kg/(s·m)(×105),a= 0.25 andb= 1.
Numerical experiments
Numerical experiments comparing the five medical gas mixtures with and without the ETT obstruction were performed.First,using the engineering pressure loss model,the fit constants for Equation (7) were determined.These results were then incorporated into the numerical integration of mechanical ventilation during pressure control mode,the ventilator mode often recommended to be used for neonates.9The ventilation settings are for 30 breaths per minute,a pressure target of 15 cmH2O,the PEEP level is 5 cmH2O,and the inhalation:exhalation ratio is 1:1.The ETT diameter is 3 mm and the lung compliance is 3 mL/cmH2O.The out parameters of interest are illustrated in Figure2.They are peak inhalation flow rate,peak exhalation flow rate,tidal volume,and tidal volume retained.
RESULTS
Pressure drop
For each of the gas mixtures a Rohrer equation for pressure drop in the form of Equation (7) was calculated.These data for the unobstructed cases are shown in Figures 3 and 4.The fit coefficients in the form of Equation (7) for all of the cases are given in Table4.
Pressure control mode ventilation
Simulations of pressure control mode ventilation were performed for each gas mixture.Figure5 shows the flow rate curves for each of the five gas mixtures superimposed for comparison over one inhalation-exhalation cycle.The key features of the curves are 1) a nonlinear increase in flow rate during the rise time of pressure (here 0.25 second as shown in Figure2),2) a decrease in flow rate during the constant pressure period during inhalation due to the rising back pressure in the lung,3) the change in the ventilator to exhalation due to the opening of the exhaust PEEP valve (modeled as an instantaneous change to a negative exhalation flow),and 4) the nonlinear decrease in exhalation flow rate (decreasing due to the lower driving pressure in the lung as volume is decreased).
Figures 6 and 7 depict the effect of the obstruction on pressure control mode ventilation.First note,that the pressure is controlled by the ventilator in this mode and ideally (and as modelled numerically) is the same as for the non-obstruction case.However,this driving pressure is much less effective in creating gas flow with the added resistance of the obstruction;thus,the inhaled tidal volume decreases and incomplete exhalation results in retained volume.The output variables that are visually compared in Figures 5 and 7 for each test case are given quantitatively in Table5.
DISCUSSION

Figure3: Pressure drop for each gas mixture over the inhalation flow rate range from 0-10 L/min (A) and zoomed to the 0-1 L/min range (B).
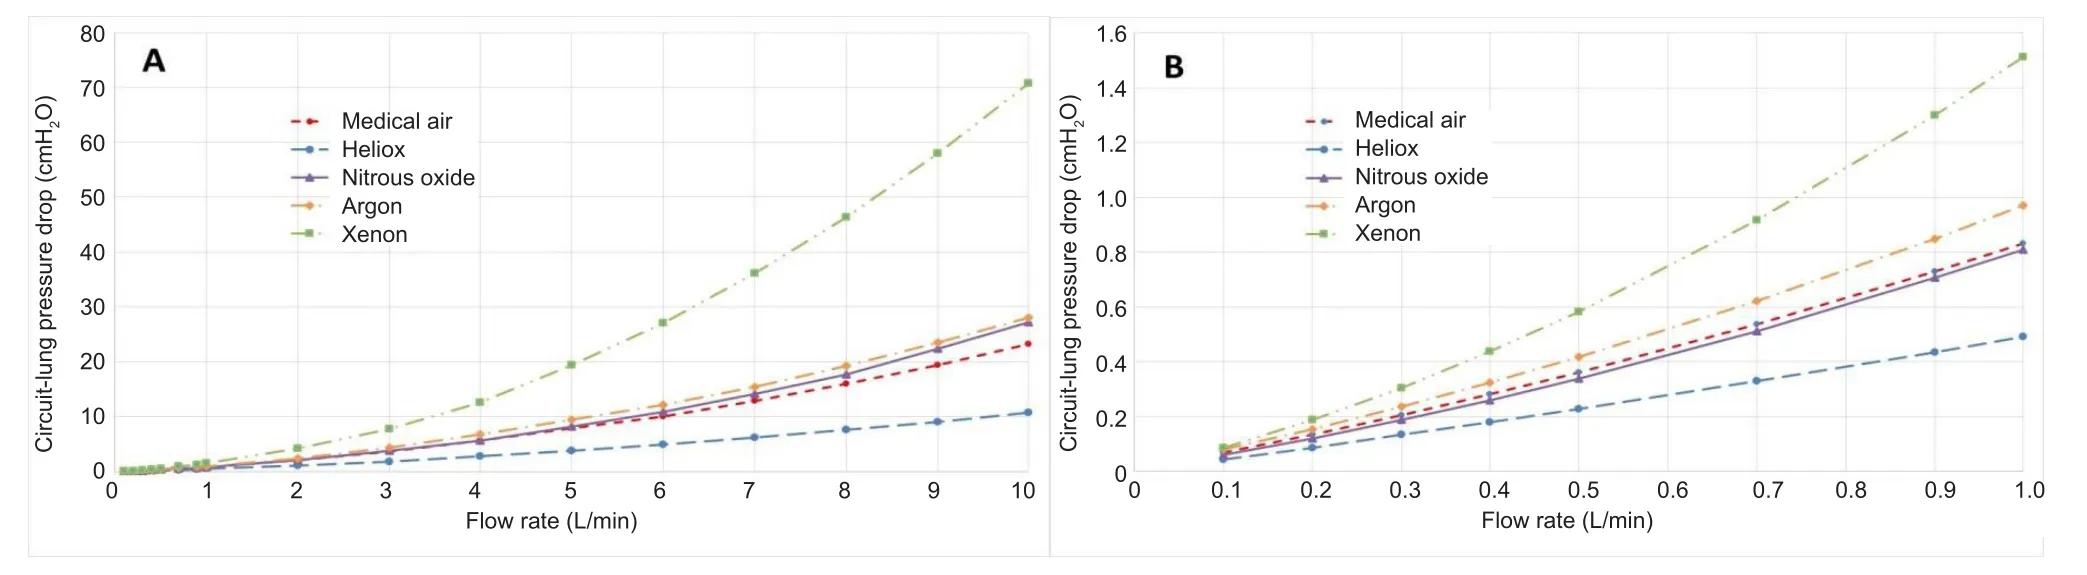
Figure4: Pressure drop for each gas mixture over the exhalation flow rate range from 0-10 L/min (A) and zoomed to the 0-1 L/min range (B).

Table4:Fit coefficients for Equation (7) for each gas mixture with and without obstruction,for inhalation and exhalation

Table5:Test case results in Figures 5 and 7
In this paper,a numerical engineering pressure loss model has been used with a neonate lung morphology model to analyze the use of high concentration medical gas mixtures during mechanical ventilation in newborns.A key concept to glean from this work is the relative effects of gas mixture properties viscosity and density on ventilator performance.For laminar flow major losses are linearly proportional to the flow rate and to the viscosity.For turbulent flow the relationships are mathematically more complex and include density.Minor losses are largely inertial in nature,proportional to the density and the square of the flow rate.These facts about gas properties in association with the ventilator parameters and lung and breathing circuit characteristics determine the performance of the mechanical ventilation.Two broad categories of safety concerns related to mechanical ventilation are considered,lung injury related to the flow rate and adequate respiration based on the inhaled tidal volume and retained volume.In a previous paper15parametric results considering several ventilation variables with air were presented such that only the effect of gas properties for a single control case are considered herein.

Figure5:Flow rate curves for each of the five gas mixtures superimposed for one inhalation-exhalation cycle.
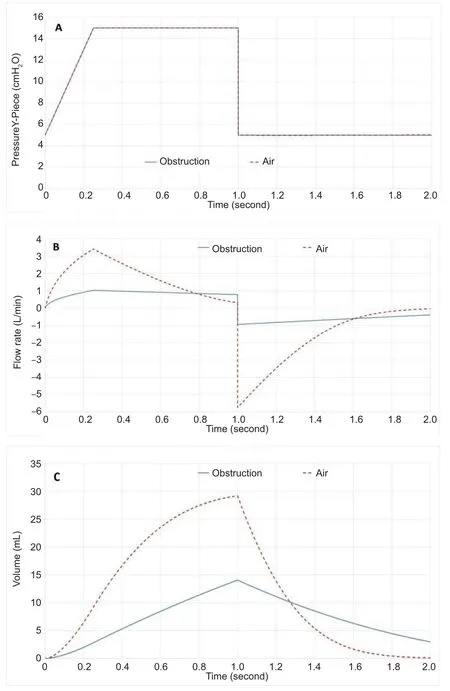
Figure6:Pressure control mode ventilation patterns for Y-Piece pressure(A),flow rate (B) and volume (C) for air and superimposed the curves in the presence of the obstruction with air.

Figure7:Flow rate curves for each of the five gas mixtures in the presence of the obstruction superimposed for one inhalation-exhalation cycle.
The use of pressure control mode normally avoids barotraumas by limiting the alveolar pressure.However,there is usually a higher peak inhalation flow rate compared to volume control mode that could pose problems because the strain rate due to high inspiratory flow has been shown to cause lung injury in an animal model35while a reduction of inspiratory flow has been shown to provide lung protection.36However,regarding adequate respiration,a key factor is to obtain adequate tidal volume that is more feasible due to the higher flow rates.The development of an obstruction in the ETT could pose a challenge to providing adequate tidal volume and respiration.Occlusion is a recognized hazard of prolonged endotracheal intubation resulting from deposition of secretions on the inner surface of the ETT.When volume-controlled ventilation is used,progressive ETT occlusion may be detected by monitoring the difference between peak and plateau airway pressures.In pressure control mode,however,inspiratory airway pressures are preset and thus cannot act as a warning indicator.Instead,changes in delivered tidal volumes may aid in the detection of ETT obstruction.37Furthermore,the high tidal volume retained would eventually result in a less compliant lung.Thus,ventilation safety is considered in terms of the variables peak flowrates,tidal volume,and volume retained.
The pressure loss-flow curves for inhalation and exhalation,shown in Figures 3 and 4,respectively,indicate the important role of density in determining airway resistance.Xenon has the highest and heliox the lowest pressure drop,with air,nitrous oxide,and argon between the two extremes in the order of density.Also,note the nonlinear nature of the curves over the 10 L/min range in the top plots.In the bottom plots at low flow rates with the low density inertial losses are almost negligible making the effect of viscosity more pronounced,especially for heliox that has a relatively large viscosity;thus its curve is virtually linear.Regarding the difference between Figures 3 and 4,that pressure losses are somewhat less for exhalation.This occurs within the model because the minor losses for the bifurcations are incorporated for inhalation,but losses for the converging streams during exhalation are considered negligible.Table4 that provides the Rohrer equation(7) fit coefficients that the inertial coefficient A is greater for inhalation than for exhalation except for heliox where they are approximately the same for the reason that inertial effects are small.
The flow curves for an inhalation-exhalation cycle in pressure control mode are shown in Figure5.The obvious effect of the gas mixture is to reduce the peak inhalation and exhalation flow rates as gas viscosity and density increase,though the relative effect of each property is complicated.Heliox has the highest peak flow rate due to the lowest airway resistance that allows for faster filling and emptying of the lung.Thus in practice,there is room to increase the respiratory rate to achieve more overall ventilation if necessary.The tabulated results (Table5) indicate that care should be taken when administering xenon in pressure control mode because the volume is 14% less than for air in the control case.
In Figure6 the increased airway resistance caused by an obstruction is clearly visible and the influence of the obstruction increases with increased density as shown in Figure7.This result follows the purely inertial form of the obstruction model.For example,in Table4 only the inertial,A,term for the fits increases with the obstruction.From Table5 it is clear that this level of obstruction would require corrective action,except perhaps when using heliox.Thus,this case illustrates the clear motivation for using heliox,its significant reduction in airway resistance,making mechanical ventilation possible with more margin for error or spontaneous breathing easier.
The use of heliox to reduce turbulent flow and,it follows,airway resistance,is well documented.38,39At the relatively low flow rates for newborns the presence of turbulence is less likely.The largest flow rates present in pressure control ventilation mode occurred at the start of expiration.As shown in Table6,for air and the other heavier gas mixtures Re is >2000 and therefore in the turbulent range.Nevertheless,for heliox,even with the fact that its peak flow rate is the greatest,Re = 1415 is in the laminar range.Thus,from this narrow standpoint,the motivation for using heliox on newborns is confirmed.

Table6:Peak expiratory Re
In terms of overall accuracy,published values of airway resistance range from 50-150 cmH2O/L per second for a normal 3 kg infant.7For the control case with air,the current results are 55 to 80 cmH2O/L per second for 0.3 to 5 L/min,respectively.
Results have been presented for pressure control mode because this ventilator mode is often recommended to be used for neonates.9Also,the use of pressure control alleviates a critical need for flow measurement,to obtain volume,for volume based ventilation.This could be important when using medical gas mixtures other than air because the flow measurement is often dependent on the gas properties.However,the use of pressure control mode for neonates,especially pre-terms is an active area of study.40,41
There are several limitations to this study.There exists very limited morphological data for neonate lungs in the literature.Thus,the morphology model is somewhat speculative.The lung morphology is considered to be perfectly rigid,an assumption that is shown to cause errors as lung compliance increases,so it is expected that peak inhalation flow rates calculated in this study are higher than would be seen on the ventilator.The exhalation pressure drop,rise time,and general ventilator performance will depend on the make and model.The criterion of Re > 2000 used for turbulent flow is problematic because it is known that turbulence created upstream of the trachea is convected into the lung at lower Reynolds numbers.42-44Indeed,there is no simple analytical expression available to assess the losses due to the convected turbulence.However,in engineering practice for pipe flow calculations with these kinds of assumptions are very common and the results are within well-accepted margins of error for design
In summary,This paper has presented a numerical study of mechanical ventilation in newborns with the goal of providing insight into the effects of gas properties.It is shown that density through inertial pressure losses has a greater influence on airway resistance than viscosity in spite of relatively low flow rates and small airway dimensions of newborns.The results indicate that the high density xenon mixture could be problematic during mechanical ventilation.On the other hand,low density heliox provides a wider margin of safety for mechanical ventilation than the other gas mixtures.The argon and nitrous oxide mixtures considered are only slightly different from air in terms of mechanical ventilation performance.
Author contributions
Study conception,model development,simulations performing,results analysis and manuscript drafting:IK;manuscript background and writing,and manuscript approval:AM,MC,and GF.All authors read and approved the final version of manuscript for publication.
Conflicts of interest
None declared.
Financial support
None.
Copyright license agreement
The Copyright License Agreement has been signed by the author before publication.
Data sharing statement
Datasets analyzed during the current study are available from the corresponding author on reasonable request.
Plagiarism check
Checked twice by iThenticate.
Peer review
Externally peer reviewed.
Open access statement
This is an open access journal,and articles are distributed under the terms of the Creative Commons Attribution-NonCommercial-ShareAlike 4.0 License,which allows others to remix,tweak,and build upon the work non-commercially,as long as appropriate credit is given and the new creations are licensed under the identical terms.
杂志排行

Medical Gas Research的其它文章
- Revisiting the expanded use of hyperbaric oxygen therapy for treatment of resistant migraines
- The role of oxygen in cluster headache
- The role of medical gas in stroke:an updated review
- Respiratory effects of occupational exposure to low concentration of hydrochloric acid among exposed workers:a case study in steel industry
- Nitric oxide detection methods in vitro and in vivo
- Recent developments in nitric oxide-releasing biomaterials for biomedical applications