Fatigue Strength Assessment of Welded Joints Using Strain Energy Density Method Based on NSIF
2019-12-30,--,
,--,
(School of Naval Architecture,State Key Laboratory of Structural Analysis for Industrial Equipment,Dalian University of Technology,Dalian 116024,China)
Abstract:A strain energy density method based on Notch Stress Intensity Factors (NSIF)to assess fatigue strength of welded joints is presented. This method simply treats welded joints as V-shaped notches. The stress field close to the notch tip is singular and related to the notch opening angle. The stress distribution of the notch tip can be described by the NSIF.The calculation of the NSIF needs refined mesh,and two calculated NSIFs of different notch opening angles cannot be compared with each other directly.Based on the NSIF,the strain energy density in a sector of critical radius R is studied.It is validated that the method presented in this paper is independent of mesh sizes and contains the effect of local welding parameters of the welded joints. The method can accurately describe the stress distribution in the highly stressed zones located at the weld toes,and can be used in engineering to assess the fatigue strength of welded joints.
Key word:welded joint;notch stress intensity factor;notch opening angle;strain energy density;fatigue strength
0 Introduction
Ships and marine structures are made up of welded structural members,and fatigue failure may occur under cyclic wave loading. Much research has been carried out to investigate the fatigue failure of welded joints.Welded joints have high stress concentration at weld toes because of their geometrical characteristics. Under cyclic loading, micro cracks may be initiated at the weld toe and propagate until the fracture of the structural member.
Many methods to predict the fatigue life of welded joints have been proposed. Nominal stress method was first used but has many limitations[1]. For complex welded joints, it is often difficult to determine the value of the nominal stress.Actually,the nominal stress is not a general fatigue control parameter.
Hot spot stress method has been widely used for fatigue life estimation in engineering[2-4].the advantage of which is that the hot spot stress can be obtained by finite element (FE) analysis.The initiation and propagation of cracks are directly related to the stress distribution around the weld toes. However, the hot spot stress method considers only the surface stress state and cannot describe the stress distribution in the vicinity of the weld toe,which is a main shortcoming of the hot spot stress method for fatigue strength assessment.
The local method[5]is new for the fatigue strength assessment of welded joints[6-9].The basic principle of the local method is that fatigue damage of the welded joint starts from the high stress area of the weld toe,and the welded joint has the same fatigue strength if the local parameters of the high stress area are the same. The local method is still in the stage of development,and many theoretical and experimental problems need to be solved.
A strain energy density method is presented to assess fatigue strength of welded joints based on the NSIF[10-14].In this method,the strain energy density in high stress area is used as a fatigue parameter. A relationship curve between the strain energy density and the fatigue life is established by a series of model tests, which can be commonly used for the fatigue life prediction of welded joints with different geometric forms and types of loading.
A strain energy density method avoids the limitation of the nominal stress method, and does not depend on the joint geometry and load types.The method also overcomes the sensibility[15]of the NSIF to local geometric parameters of the weld toe,and can be applied to the practical engineering structures. In addition, the strain energy density method considers the stress distribution of high stress area at the weld toe, which is more accurate than the hot spot stress method. Therefore, the strain energy density method has been regarded as a more accurate method for the fatigue life assessment of welded joints.
1 Notch stress intensity factor
1.1 Singularity exponent of stress
Williams made a detailed analysis of stress and strain field at sharp open notches[16].It was pointed out that in a sharp open notch as shown in Fig.1,the stress field close to the tip is singular.The singularity exponent of stress is only related to the opening angle 2α.The exponent values of the stress distributions are defined by the following equations:
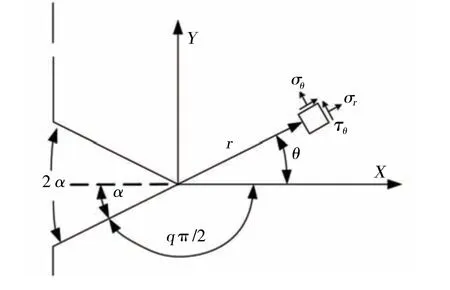
Fig.1 Coordinate system of V-shaped notches and stress components
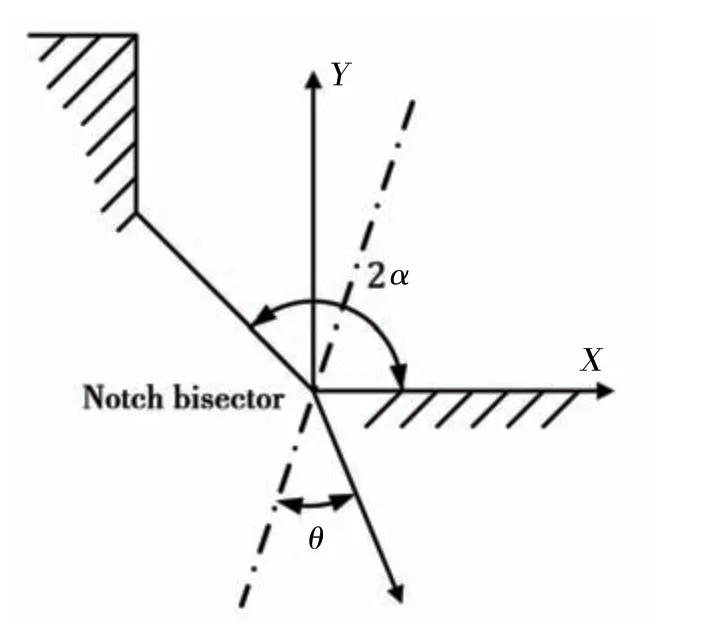
Fig.2 Notch bisector
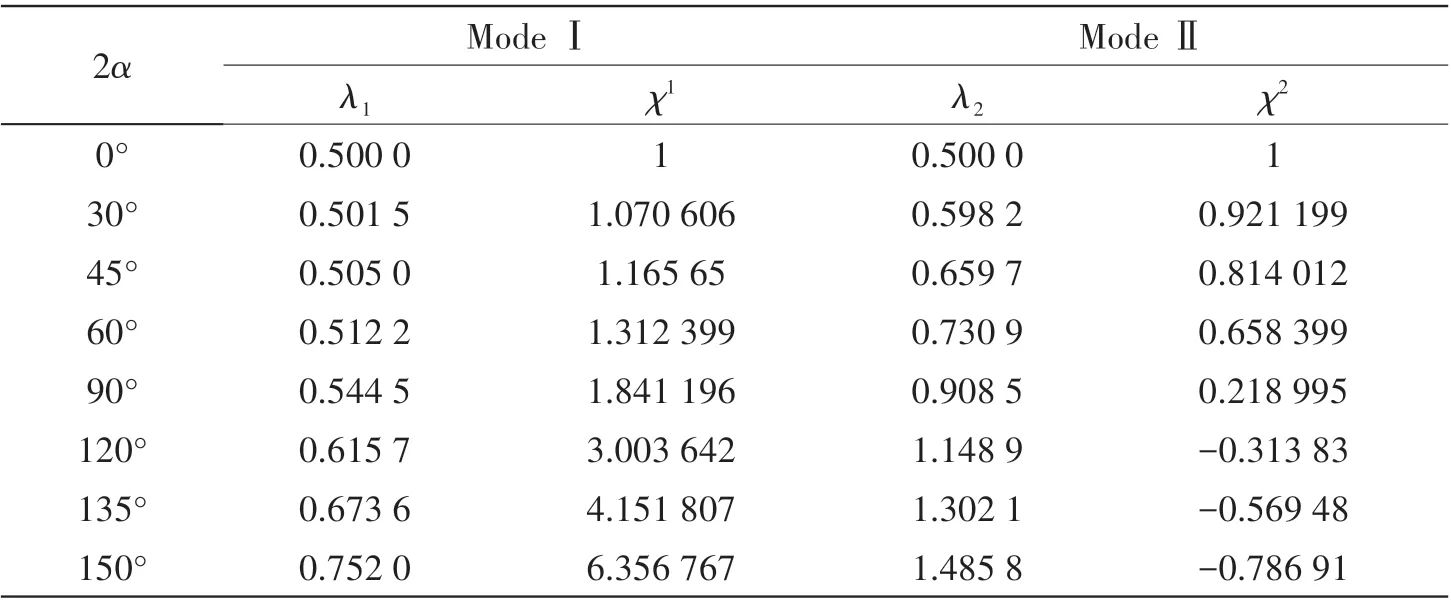
Tab.1 Stress singularity exponents of different notch opening angles

This paper uses Matlab programming to select the arbitrary opening angle 2α and get the singularity exponent of stress. The opening angle varies from 0° to 150°. Eight typical opening angles are chosen to calculate the stress singularity exponents.The results are shown in Tab.1.
1.2 Stress distribution near the notch tip
The local coordinate system of the notch tip is built as shown in Fig.1. The stress components near the notch crack tip of Type I can be given according to the Williams’formulation:

The stress components near the notch crack tip of Type Ⅱcan be given as:

whereχiis determined by the following expression:

1.3 Definition of the NSIF
To give the physical meaning ofa1anda2in Williams’formulation, Gross and Mendelson[17]recommended to extend the traditional definition of the stress intensity factor to open notches.
First, it assumes that the stress distribution contributes most for crack propagation in the direction of notch bisector. The symmetric and skew-symmetric components of stress field are uncoupled along this direction,so the shear stress componentτrθonly depends on the asymmetric loading condition, while theσrandσθonly depend on the symmetric loading condition.Based on the relationship between the stress intensity factor and the stress field components,NSIFs are defined as follows:

whereK1is the NSIF of the opening type andK2is the NSIF of the sliding type. It is important to note that the NSIF is in agreement with the stress intensity factor which is obtained from linear elastic fracture mechanics when 2α= 0°.
The relationship between the constants (a1anda2)and the NSIFs (K1andK2) can be obtained by substituting Eq.(6) and Eq.(7) into Eq.(3) and Eq.(4). The Williams’formulation for describing the stress distribution near the notch tip can be expressed as a function of the NSIF.
For crack of the opening type,

It can be seen from Fig.3 that along the notch bisector the circumferential stress,the radial stress and the shear stress have linear relationships with logarithm of distance from the notch tip. Hence, the NSIFs of the opening type and the sliding type can be calculated by the following equations:

whereriis the distance between nodeiand the notch tip,σθ,iis the circumferential stress of nodei,andτrθ,iis the shear stress of nodei.
The relationship curves between the distance of the notch tip and the NSIFs of the opening typeK1and the sliding typeK2are shown in Fig.4.
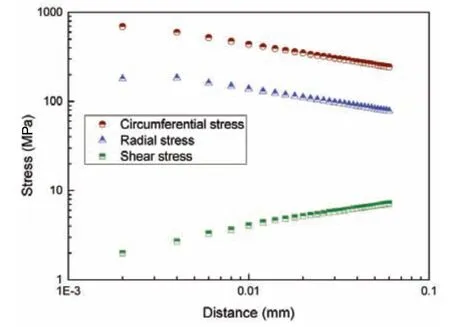
Fig.3 Stress distribution close to the notch tip
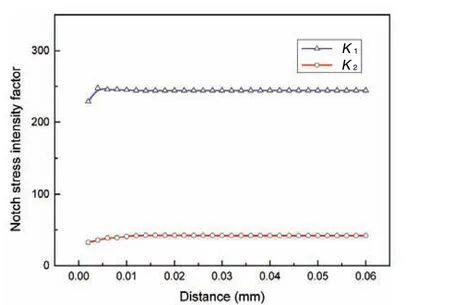
Fig.4 Distribution of the NSIFs K1and K2
As shown in Fig.4, the calculated results of Eqs.(10) and (11) are constant in a local area near the notch tip, and these constants can be treated as the NSIFs of the model. The accuracy of the NSIF is poor, similar to that of the traditional stress intensity factor, when the node is close to the notch tip due to singularity of stress in the FE analysis. The influence of the nominal stress is dominant when the node is far from the notch tip, and the NSIF is unable to describe the distribution of stress field.Therefore,the area ranging from 10-3r/tto 10-1r/tis selected to evaluate the NSIFs in this paper.
1.4 Verification of accuracy
The NSIFs are calculated based on the information of nodes along the notch bisector.Hence the NSIF can exactly describe the stress distribution along the notch bisector. However,it needs to be verified whether the NSIF calculated from FE analysis can describe the stress distribution which is not along the notch bisector.
The feasibility of the NSIF is verified by analyzing the radial stress on the side of the main plate of a cross welded joint as shown in Fig.5. The radial stress on the free edge is superposition of the stress fields of the opening type and the sliding type,which is the same with those in any direction except along the notch bisector. The opening angle of the notch 2αis 135°, and the angleθon the free edge of the main plate is 112.5° (θ= 0° on the notch bisector). The parameters corresponding to the opening angel of the notch areλ1= 0.624,χ1= 4.1518,λ2=1.302, andχ2= -0.5695. By superposition of Eq.(8) and Eq.(9), the radial stress on the free edge of the main plate can be expressed as follows:

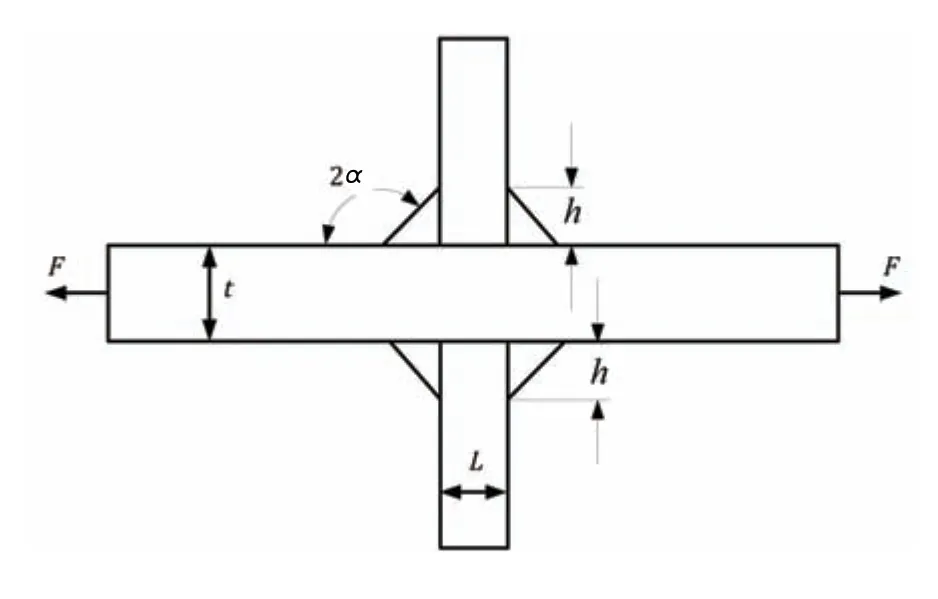
Fig.5 Geometry of a cross welded joint
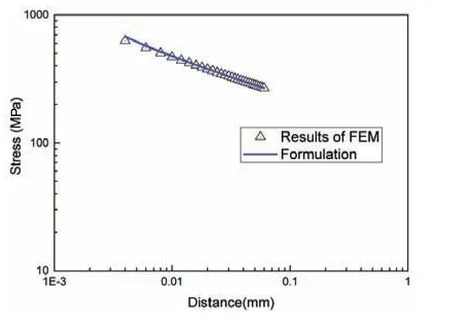
Fig.6 Comparison between the stress results by FE analysis and those by Eq.(12)
As shown in Fig.6,FE results of the stress are in good agreement with the results calculated by Eq.(12). It is verified that the NSIF can accurately describe the stress distribution in the high stress region near the weld toe.
2 Stain energy density method
2.1 The formulation of strain energy density
The strain energy density for isotropic material obeying a linear elastic law is:

In plane stress state,σz=τyz=τxz= 0; and in plane strain state,σz=μ(σx+σy), thus Eq.(13)can be simplified as follows:

By using the superposition effect principle, the stress distribution near the notch tip can be given as follows:

According to Eqs.(8)-(9)and Eq.(15),Eq.(14)can be written as follows:

where
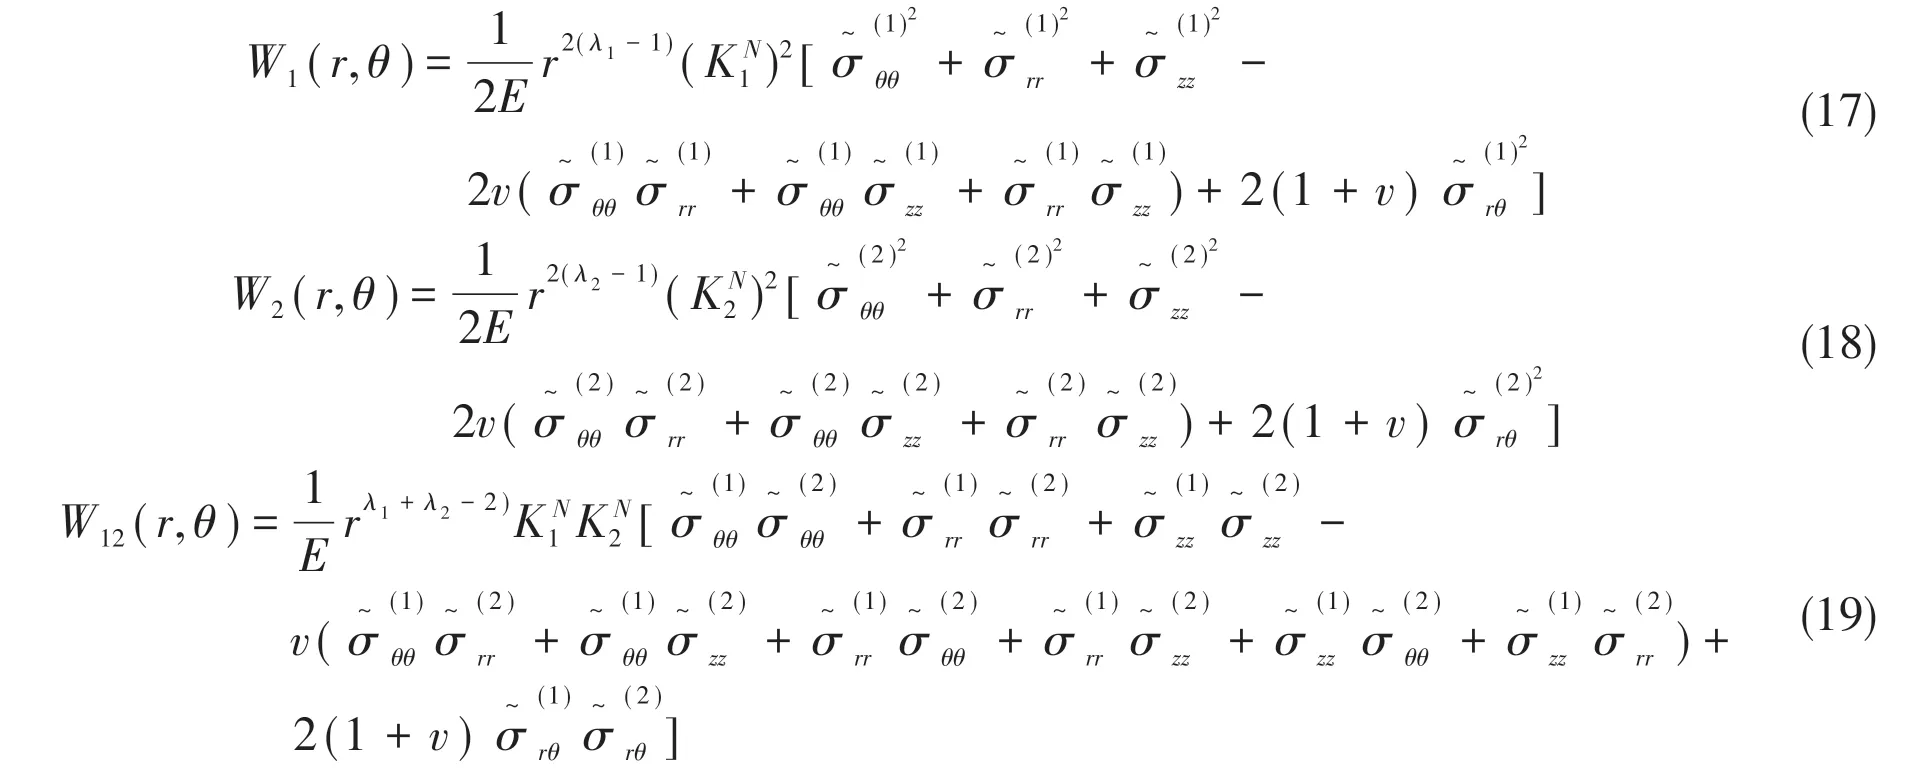
The elastic deformation energy in the region of radiusRaround the notch tip is:

Since the integration field is symmetric with respect to the notch bisector,the contribution ofW12(r,θ)vanishes.As a consequence,

where integralI1andI2are:

The area of fan with the critical radius ofRfrom notch tip is:

The elastic deformation energy,averaged on the areaA,can be expressed as:


The Poisson’s ratioμis 0.3.Because the singularity exponent of stressλiis related to the opening angle of the notch 2α, different opening angle will correspond to different integral constantei.The opening angle of the notch is given from 0°to 150°.Curves of the integral constanteiwith the growth of the opening angle in plane stress state are shown in Fig.7(a) and Fig.7(b),respectively.
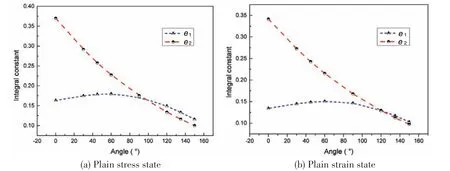
Fig.7 Curves of the integral constants with the growth of the opening angle
2.2 Influence of finite element mesh
As shown in Fig.5,the cross welded joint is numerically analyzed in ANSYS.The elasticity modulus of the material is 2.1×10⁵MPa,and Poisson’s ratio is 0.3.A quarter of the FE model is established because of geometric symmetry of the joint. Linear element Plane42 with four nodes and higher order element Plane82 with eight nodes are used in the calculation, respectively.
FE meshes with different sizes of elements at the weld toe are shown in Fig.8.

Fig.8 FE meshes with different sizes of elements at the weld toe
The calculated results of the strain energy density using the element Plane42 are shown in Tab.2.

Tab.2 Results of the strain energy density using the element Plane42
The calculated results of the strain energy density using the element Plane82 are shown in Tab.3.
It can be seen from Tab.2 and Tab.3 that the calculated results of the strain energy density using Plane42 are the same with those using Plane82 when the meshes are fine enough. When the mesh size becomes large,the error of the strain energy density using Plane42 is obvious because Plane42 is linear and unable to accurately describe shape of the fan area.However,when Plane82 element is used, the results of the strain energy density are not sensitive to the mesh size, and accurate results can be obtained even the mesh size is large. In this paper, the higher order element Plane82 is used.
2.3 Verification of accuracy
As shown in Tab.4, 12 cross welded joints[18-19]are analyzed to compare the results of the strain energy density using coarse mesh with the theoretical results of the strain energy density based on the NSIF.
3 ΔW-N curve
As shown in Fig.9,two welded specimens are numerically analyzed.Model 1,subjected to uniform tension, is selected from the fatigue test specimens of Lihavainen and Marquis[20]. Model 2 is selected from fatigue test specimens of HHI[21-22],which is subjected to bending moment.
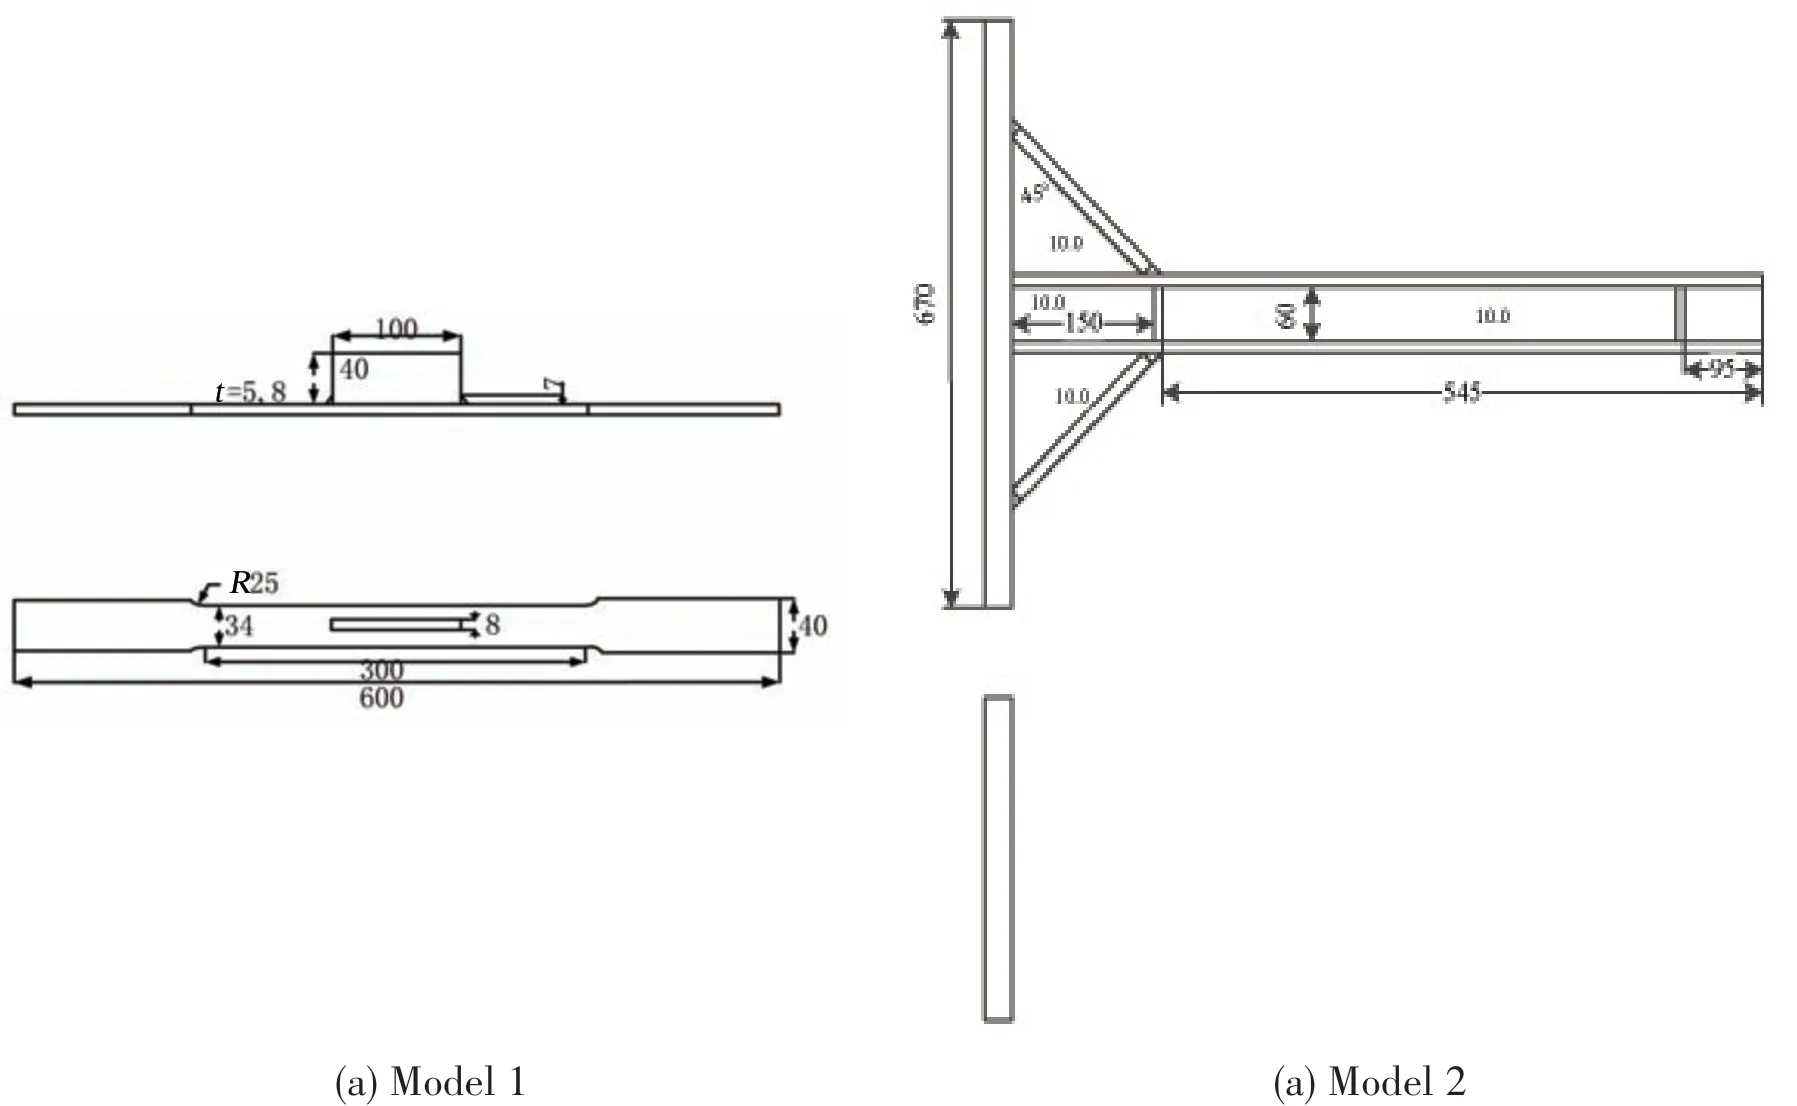
Fig.9 Two welded specimens for numerical analysis
In FE analysis, the elasticity modulus of the specimens is 2.1×10⁵MPa, and Poisson’s ratio is 0.3. Fig.10 shows the ΔW-Ncurve for fatigue life assessment of welded joints obtained by combining the fatigue test data of Model 1 and Model 2.
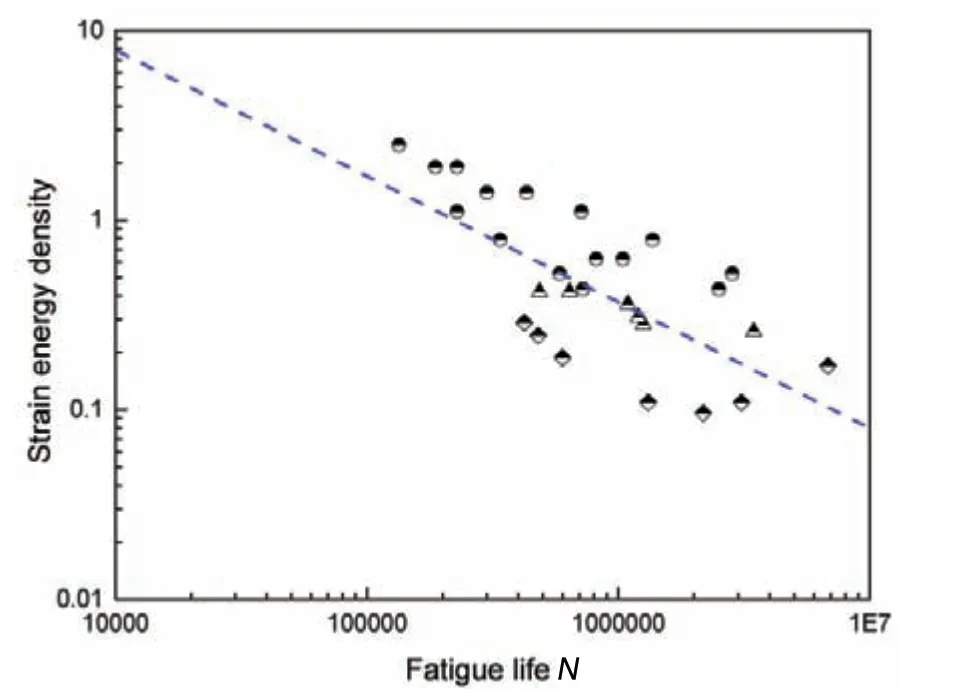
Fig.10 ΔW-N curve
4 Conclusions
This paper has presented a strain energy density method based on the NSIF to assess the fatigue strength of welded joints by considering the influence of local geometry of the welded joint,which can accurately describe the stress distribution of high stress area near the weld toe.The accuracy of the calculation method of the NSIF has been verified by FE analysis, and the relationship between the strain energy density and the fatigue life of welded joints which have different geometries and are subjected to different types of loading has also been studied. From the numerical results,the following conclusions can be drawn:
(1) The welded joint can be simplified as a sharp V-shaped notch, and the stress field near the notch tip can be described by the opening typeK1and the sliding typeK2of the NSIF.It is verified that the stress field described by the NSIF is in good agreement with that by FE analysis.
(2) The accuracy of the strain energy density is independent of the mesh size when the higher order element is used in FE analysis.The maximum error between the numerically calculated strain energy density using the coarse mesh and theoretical value of the strain energy density based on the NSIF is 8.9%.Therefore,the calculated strain energy density using the coarse mesh has a high accuracy for fatigue strength assessment of the welded joints.
(3)Slope of the ΔW-Ncurve obtained by FE analysis of two fatigue test specimens is close to -2/3, which is coincident with the theoretical value. Therefore, the strain energy density can be taken as a parameter to estimate the fatigue strength of welded joints in engineering.
Acknowledgements
This research was supported by the Ministry of Industry and Information Technology (Project No.24(2016)and the Seventh Generation of Ultra-deep Water Drilling Platform (Ship)Innovation Special).
杂志排行
船舶力学的其它文章
- Nonlinear Correction of a Hydraulic Propulsion System Used in Deep-sea Work-Class ROVs
- Nonlinear Wave Loads and Green Water Acting on a Ship in Severe Sea Conditions
- Application of Chebyshev Polynomials to Efficient Approximation of Frequency-Domain Infinite Depth Green Function
- Simulation of Irregular Wave Uplift Force on Horizontal Plate Structures
- Numerical and Experimental Study for SCR with Cable3D
- Nonlinear Numerical Simulation for Flexible Pipes Carcass Wet Collapse
