Comparative Variance and Multiple Imputation Used for Missing Values in Land Price DataSet
2019-12-19LongqingZhangLipingBaiXinweiZhangYanghongZhangFengSunandChangchengChen
Longqing Zhang,Liping Bai, ,Xinwei Zhang,Yanghong Zhang,Feng Sun and Changcheng Chen
Abstract: Based on the two-dimensional relation table,this paper studies the missing values in the sample data of land price of Shunde District of Foshan City.GeoDa software was used to eliminate the insignificant factors by stepwise regression analysis;NORM software was adopted to construct the multiple imputation models;EM algorithm and the augmentation algorithm were applied to fit multiple linear regression equations to construct five different filling datasets.Statistical analysis is performed on the imputation data set in order to calculate the mean and variance of each data set,and the weight is determined according to the differences.Finally,comprehensive integration is implemented to achieve the imputation expression of missing values.The results showed that in the three missing cases where the PRICE variable was missing and the deletion rate was 5%,the PRICE variable was missing and the deletion rate was 10%,and the PRICE variable and the CBD variable were both missing.The new method compared to the traditional multiple filling methods of true value closer ratio is 75% to 25%,62.5% to 37.5%,100% to 0%.Therefore,the new method is obviously better than the traditional multiple imputation methods,and the missing value data estimated by the new method bears certain reference value.
Keywords: Imputation method,multiple imputations,probabilistic model.
1 Introduction
The advent of big data era has led to more serious data missing in the process of data collection,transmission,storing and processing.Usually,these missing values are mostly directly eliminated or replaced by some simple approximations [Mallinckrodt,Roger and Chuang (2014)].These methods generally bear great limitations,and basically cannot guarantee the authenticity of the missing values.The lack of data not only loses a lot of valuable information but also seriously affects the further development of data mining.
2 Content and technology
Based on the two-dimensional relation table,this paper studies the missing values in sample data of land price of Shunde District of Foshan City.Combining the ideas of multiple imputation techniques and probability models [Papadopoulos,Papadopoulos and Sager (2016)],this paper proposes a new method of filling variances to determine the missing values.To a certain extent,the data quality of the relevant two-dimensional relational tables is improved.
The main research content is to apply the stepwise regression analysis method to eliminate the insignificant factors by GeoDa software.According to the correlation between the attribute values of various factors affecting the land price and the land price data [Jeong,Koh and Park (2010)],the NORM software is used to construct the multiple imputation models,and EM algorithm and augmentation are used to fit multiple linear regression equations [Horton and Kleinman (2007)].On such basis,the imputation data set is analyzed,and a method of determining the weight based on the differences between the individual variance and the integrated variance is proposed to realize the imputation expression of the missing value.
Combining the ideas of multiple filling techniques and probabilistic models,this paper proposes a new method of filling variances to determine the missing values.The technical route is as follows:
(1) Randomly eliminate 5%-10% of the land price data as a clean value,determine the missing mechanism and variable type of the remaining data,find other variables related to the missing value variable [Pan,Li and Zhang (2012)],and gradually eliminate impact of the insignificant factor by using the stepwise regression analysis method by GeoDa software.
(2) Determine the number of imputation,which is 3 to 5 times at best.Through NORM software,a number of different linear regression equations between missing value variables and other variables are obtained.
(3) According to different linear regression equations,different filling datasets are calculated and a multiple imputation models is constructed [Dorigato,Pegoretti and Penati (2010)].In this way,the imputation dataset is created.
(4) Statistical analysis is performed on a plurality of different padding data sets,and the mean and variance of each padding data set are respectively calculated and then integrated.Its formula is:
Mean:

M represents the average after integration,and K represents the number of filled data sets;km represents the average calculated by each imputation data set.
Variance:


B is between imputation,indicating the uncertainty of the point data between the data sets,indicating the integrated average,Wkindicating the variance calculated by each filled data set,which refers to the average variance calculated by each imputation data set,T represents The variance after integration [Xie,Qin,Xiang et al.(2018)].
(5) Determine the weight value of the padding data set by difference,which indicates the proximity between WKand T,to determine the weight in turn:

K represents the number of padding data sets [Qin,Li,Xiang et al.(2019)],Wkrepresents the variance calculated by each fill data set,and T represents the variance after integration,Q represents the sum of the distances of Wkvariances of the packed data sets and the integrated variance T [Sarnak,Zhao and Woodbury (2013)],∂krepresenting the weight coefficient obtained.
(6) Imputation estimate of the missing point is determined based on the weighting factor.Therefore,the missing value data of each point can be expressed approximately equal to the sum of the product of the point value corresponding to each padding data set and its corresponding weight coefficient ∂k.
(7) Finally,the estimated value and clean value are compared,and the experimental results are tested to conclude.
3 Method
3.1 Data source
This study selected the residential land price sample data of Shunde District of Foshan City in 2013 to conduct experiments.The land price data and real estate information of this data are the real estate transaction data provided by the Shunde District Land and Resources Bureau;the location-related data,such as the distances related to the land price data,are based on questionnaires and actual research [Li,Zhao,Du et al.(2016)],according to Google.The coordinate data obtained by the name of the real estate in the map is calculated by the geographic information space analysis method.The specific description of the land price data set is as follows:
The data in the dataset is calculated by a questionnaire survey,field survey and geographic information spatial analysis method.It is mainly based on the twodimensional relational table,which is composed of land price data and various factor data affecting land price data,including land price and sampling point number.,address,coordinates,distance from the point to the city center,distance from the point to the park,population density,distance from the point to the school,distance from the point to the mountain,distance from the bus stop,distance from the point to the hospital [Hanula,Mayfield and Reid (2016)],point to the main road The distance,the distance from the point to the highway,the distance from the point to the river,the number of floors,the base area,and the floor area of the building,and 29 attribute fields,and 713 records.
Because it is the data set collected and calculated in the field,rather than the standard test data set,the data itself is different from the general standardized data,there are certain errors,and there are certain limitations in the data quality.The final accuracy has a large impact.
3.2 The specific implementation of multiple fills
3.2.1 Elimination of insignificant factors by stepwise regression analysis using GeoDa software
Using the ordinary OLS test,the OLS test results can obtain the value of Multicollinearity Condition Number,the values of LM-lag and LM-error,and the p value of LM-lag and LM-error.
All factors were tested and the results were:Multicollinearity Condition Number=48.118,LM-lag=43.57,LM-error=24.47,P(LM-lag)=0.0000000,P(LM-error)=0.0000008.The value of Multicollinearity Condition Number is 48.12 and greater than 30,which indicates that there is a problem of multicollinearity in the respective variables in the analysis [Hagen and Mohl (2016)].It is necessary to adopt the method of gradually eliminating variables to discharge the problem of multiple collinearities.
After further experiments,it was found that after eliminating the three independent variables of the river,population density,and school,the value of Multicollinearity Condition Number obtained by the analysis is 28.24 less than 30 [Reddy (2011)],which basically meets the requirements of the multicollinearity test,and the remaining independent factors Further analysis is possible.Where P(LM-lag)=0.0000000,P(LMerror)=0.0000002.Because the p value of LM-lag and LM-error is less than 0.01,it indicates that the two regression models of SLM and SEM are statistically very significant.In the comparison between Robust-lag and Robust-error,P(Robustlag)=0.0000048,P(Robust-error)=0.2510494.It can be found that the p value of Robustlag is smaller than the p value of Robust-error,Robust-lag is significantly more significant than Robust-error,and LM-lag=46.32 is larger than LM-error=26.71,and Robust-lag=20.92 is larger than Robust-error=1.32.Therefore,the final selection of the spatial lag model SLM for estimation is most in line with the actual situation.The results of the regression analysis of the SLM space lag model are shown in Tab.1:
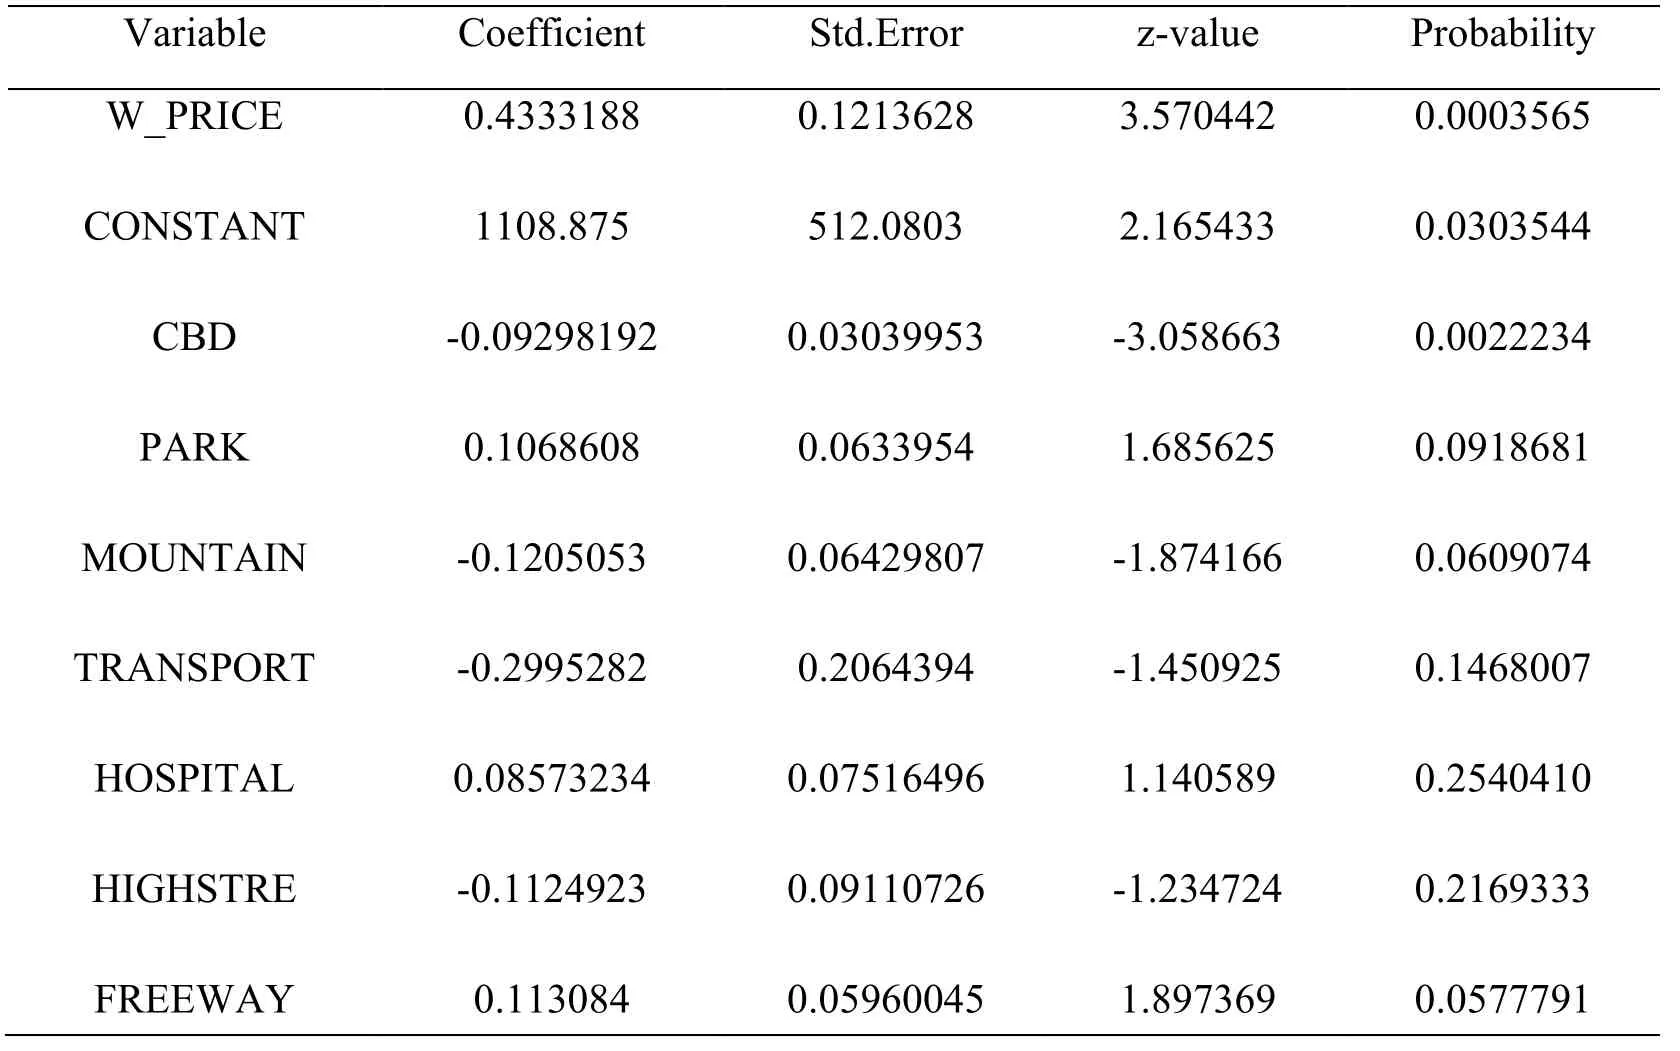
Table 1:Spatial lag model regression analysis results table
According to the significance level test of the independent variable p value of 0.05,from the P value of the respective variables obtained from the analysis results [Kuznetsova,Brockhoff and Christensen (2017)],it can be found that the p values of the four independent variables of CBD,PARK,MOUNTAIN,and FREEWAY are very close to 0.05,indicating that they are on the land price.The impact is more obvious.However,the significant factors of HOSPITAL and HIGHSTRE are not obvious and can be gradually eliminated in further regression analysis to obtain the optimal spatial autocorrelation model.
After removing the two independent variables of HOSPITAL and HIGHSTRE,the results of further regression analysis are shown in Tab.2.It can be found that the p values of the two independent variables of CBD and FREEWAY are less than 0.05,which is significant;PARK,MOUNTAIN The P value of the independent variable factor is slightly larger than 0.05,which has a certain influence on the land price,but the significance is not strong;while the other independent variable factors are not obvious in the stepwise regression analysis because the influence on the land price is not obvious.

Table 2:Further regression analysis results table
Through the regression analysis method of gradual elimination,the four independent variables of CBD,FREEWAY,PARK,and MOUNTAIN are selected as the significant correlation factors affecting the land price data,which is ready for establishing the optimal filling model of land price data.
3.2.2 Fitting multiple linear regression equations with NORM software to construct a multi-fill model
3.2.2.1 Determine the number of iterations and perform the operation of the EM algorithm
The EM algorithm,the Expectation Maximization Algorithm,is an iterative algorithm for the maximum likelihood estimation or the maximum posterior probability estimation of a probability parameter model with a hidden variable [Wang,Hao,Xu et al.(2018)].The maximum expectation algorithm is calculated alternately in two steps:the first step is to calculate the expectation (called the E step),the existing estimate of the hidden variable is used to calculate its maximum likelihood estimate;the second step is to maximize (called For the M step),the maximum likelihood value found on the E step is maximized to calculate the value of the parameter.The parameter estimates found on the M step are used in the next E-step calculation,which alternates until it converges,ultimately determining the number of iterations.
Experimental studies were performed on the three deletions.There were only cases where the PRICE variable was missing and the deletion rate was 5% and 10%,and there were cases where the PRICE variable and the CBD variable were missing.
By statistically testing the PRICE variables in the three case data,it is found to be in a normal distribution,which satisfies the basic requirements of NORM software for estimating the missing data of multivariate normal distribution data.According to the regression analysis method which was gradually eliminated before,the four independent variables CBD,FREEWAY,PARK,and MOUNTAIN closely related to PRICE were selected as the relevant factors affecting the land price data,and the filling model was constructed.It can be seen from the calculation results of the EM algorithm that the maximum number of iterations of the data in the three cases is 8,11 and 10 times in order to ensure that the posterior prediction distribution is independent and stable,and the number of iterations of the subsequent data augmentation is generally set to be larger than EM.2~3 times the number of iterations.
3.2.2.2 Perform data augmentation (DA) operations
Data augmentation (DA) is widely used to deal with non-conjugated models [Xiang,Zhao,Li et al.(2018)].Its idea comes from the EM algorithm.It assumes that there are some implicit structures in the original model that can be explored by introducing augmented variables.Moreover,the original model can be obtained by subtracting the augmented variable from the model.In this framework,the augmentation variable is treated as “augmented data”,making the inference easy to handle.This idea was first proposed by Tanner and Wong to simplify the calculation of the maximum likelihood estimate and then applied to the Bayesian posterior inference.
A linear regression equation that simulates the different fill times between missing value variables and other variables in the three cases is obtained,and the corresponding filled data set is obtained.Because the maximum number of iterations of the EM algorithm is 8,11 and 10 times in a turn,and the number of iterations of the DA is set to be 2 to 3 times of the EM,the number of iterations of the DA operation in the three cases is determined to be 50 times.According to the number of iterations,the appropriate number of filling times is selected.In the experiment,10 is selected as the interval number,and every 10 iterations are estimated.Therefore,in the three cases,5 filling datasets can be obtained.
3.2.3 Calculation of missing values
3.2.3.1 Analyze the padding data sets in the three missing cases
The mean and variance of each padding data set are calculated separately.Then integrate it.Mean:

where K represents the number of padding datasets,representing the average of the calculated population of each padding data,and the average after integration.The results obtained by calculating each group of filled data sets are shown in Tab.3:
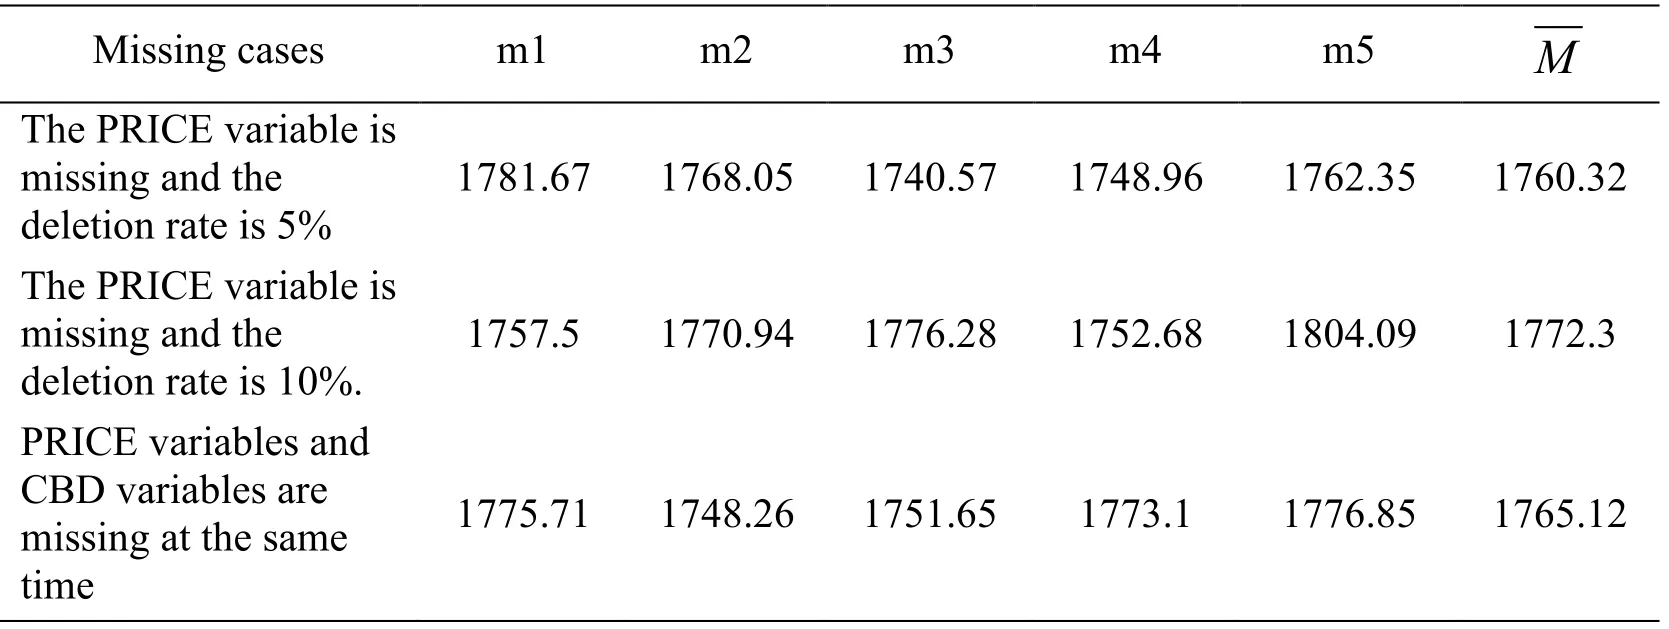
Table 3:Fill data set mean statistics table for three missing cases
Variance:

where K represents the number of padding data sets,mkrepresents the average calculated by each fill data set,Indicates the average after integration,Wkrepresents the variance calculated from each fill data set,represents the average variance calculated for each fill data set,and T represents the integrated variance.
The values of Wk,,B and T when three missing cases are calculated as shown in Tab.4 and Tab.5:
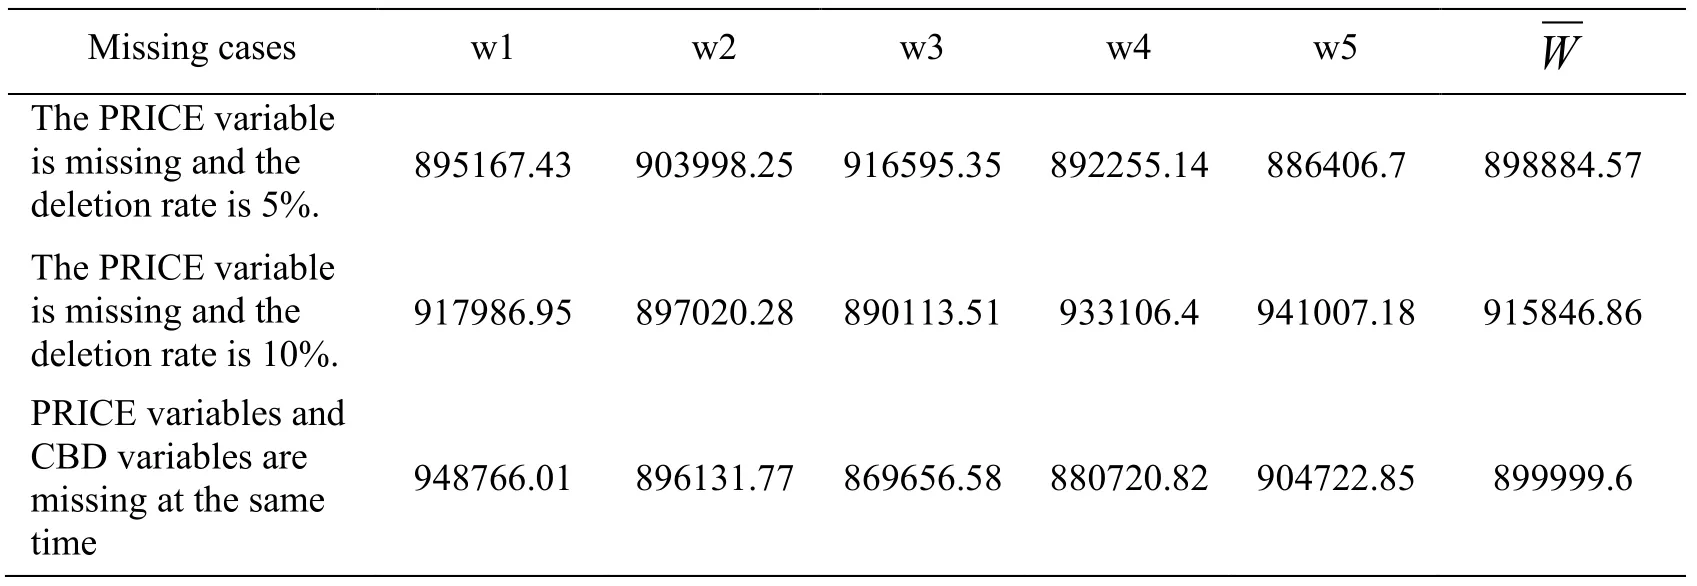
Table 4:Statistical data of variance of filled datasets in three cases

Table 5:Statistics of B-value and T-value of the filled dataset in three missing cases
3.2.3.2 Determination of the weight value of the padding data set

Where K represents the number of padding data sets,kW represents the variance calculated from each fill data set,T represents the variance after integration,Q represents the sum of the distances of the variances of the packed data setskW and the integrated variance T,∂kindicates the weight coefficient obtained.
The correlation coefficients calculated are shown in Tab.6:
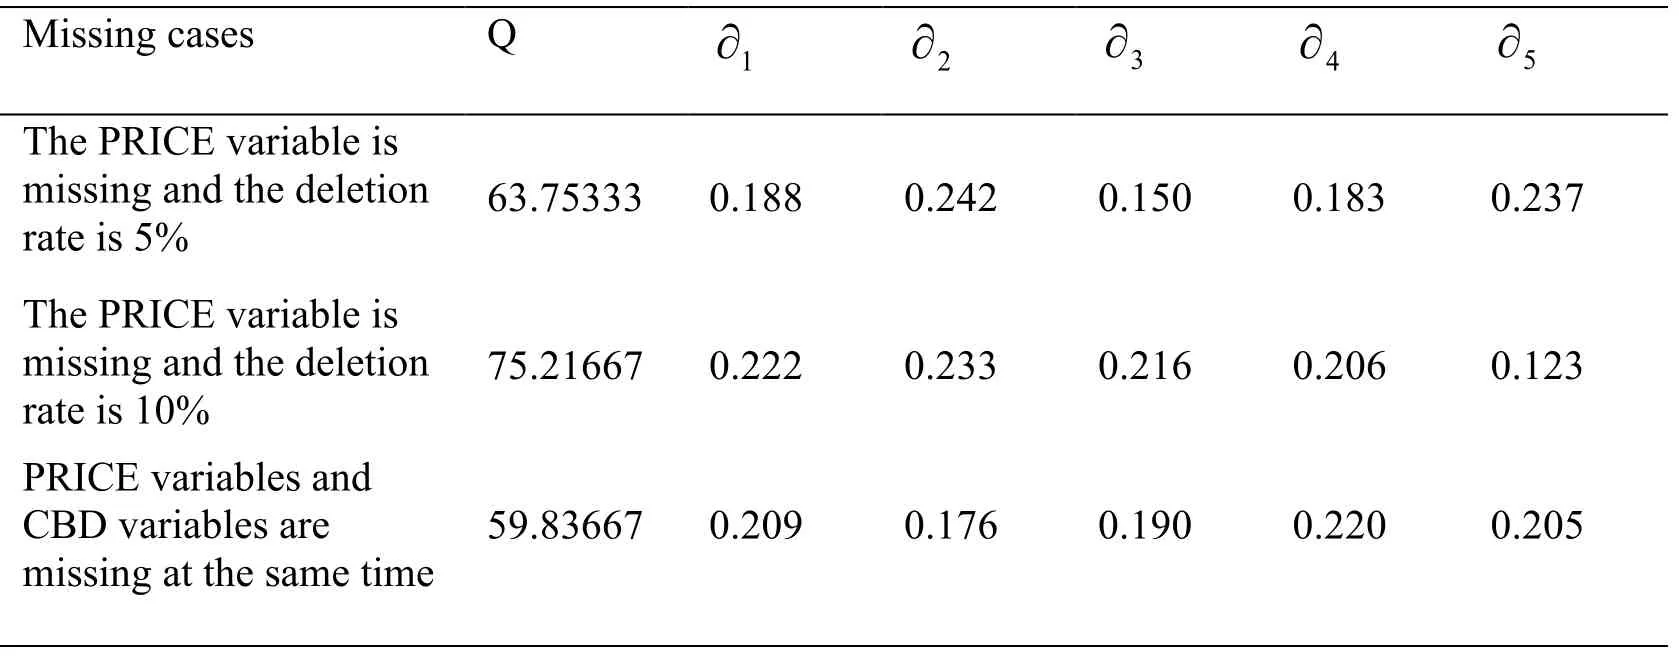
Table 6:Filling data set fill coefficient statistics table for three missing cases
3.2.3.3 Calculate missing point data based on the weighting factor
Well, Heavens. Didn t you ever come down here to the station? He pointed14 across to his magazine stand. I ve been there all the time. I own it. I ve watched everybody that came up the stairs.
Therefore,the missing value of each missing point can be expressed approximately equal to the sum of the product of the point value corresponding to each padding data set and its corresponding weight coefficient ∂k.
The calculation results of the missing values of each missing value in the three missing cases are shown in Tab.7,Tab.8,and Tab.9:
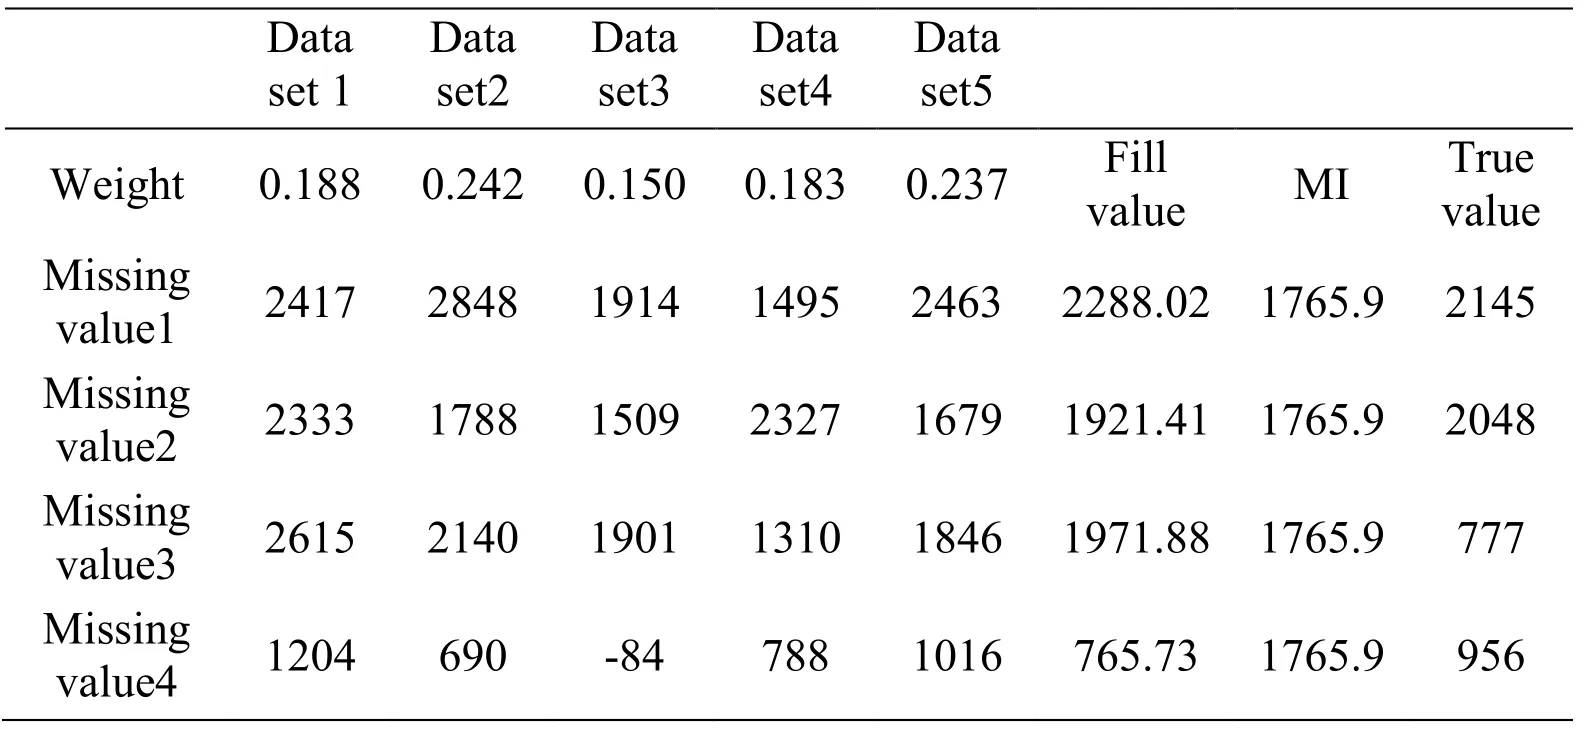
Table 7:Filling value calculation result table in the case where the PRICE variable is missing and the deletion rate is 5%
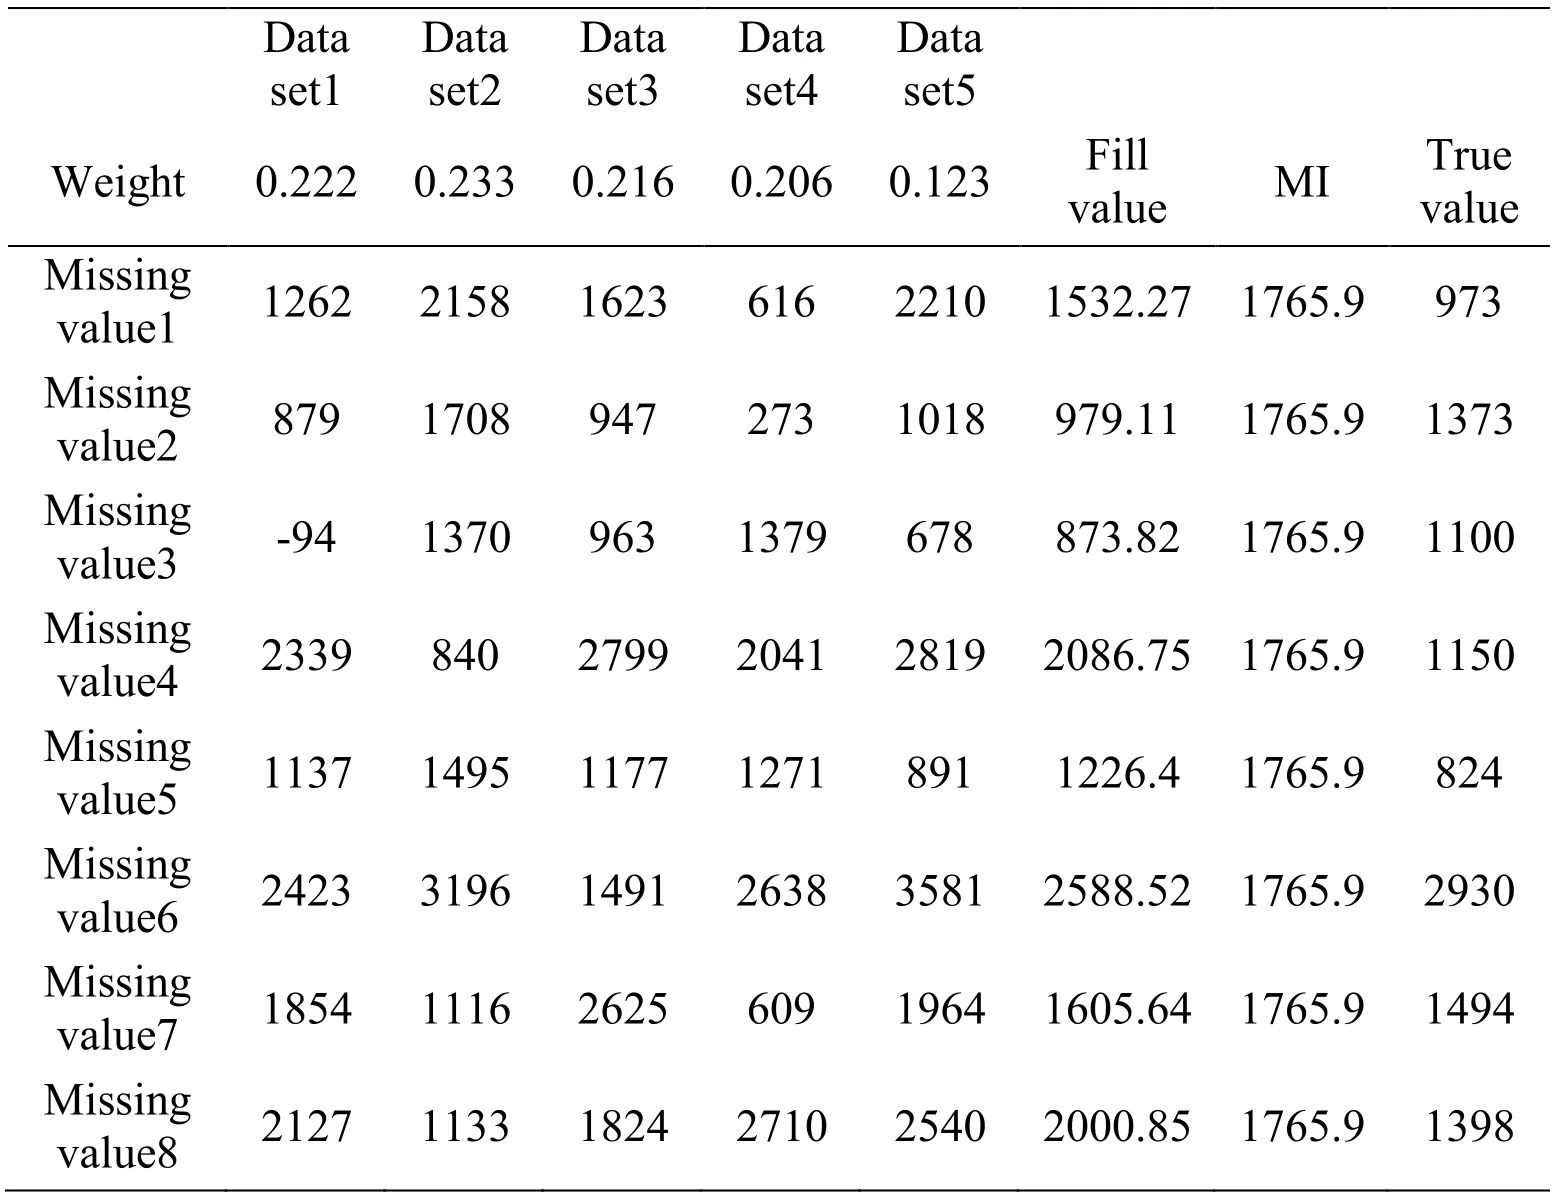
Table 8:Filling value calculation result table in the case where the PRICE variable is missing and the deletion rate is 10%

Table 9:Filling value calculation result table in the case where the PRICE variable and the CBD variable are simultaneously missing
4 Result analysis
Comparing the new padding method based on the variance difference to determine the missing value and the traditional padding result obtained by the method of multi-filled mean integration,we can see that when the PRICE variable is missing and the deletion rate is 5%,The results in Tab.7 show that the ratios obtained by the new method and the traditional multi-fill method are closer to the true value of 75% and 25%;when the PRICE variable is missing and the deletion rate is 10%,the results in Tab.8 indicate the ratio between the new method and the traditional multi-fill method is closer to the true value of 62.5% and 37.5%.When the PRICE variable and the CBD variable are missing at the same time,the results in Tab.9 indicate that the new method is different from the traditional one.The estimation result obtained by the filling method is closer to the true value ratio of 100% and 0%.It can be obtained that:
(1) After the multi-fill model is added to the weight calculation,the filling result of each missing value can be obtained,and the estimation result of the former is obviously better than the filling result of the filling method.In the traditional multiple filling methods,the estimation result of the former is closer to the true value as a whole;
(2) When there is only one missing variable,the filling effect of the new method will be worse as the missing rate in the data set increases,but overall It is better than the traditional multiple filling methods;
(3) When the missing rate of the data set remains the same,as the number of missing variables increases,the estimation effect of the new method will be better than the traditional multiple filling methods;
(4) Although overall See,the new method is better than the traditional multi-fill method,but you can see that the average value of the difference between the estimated value and the real value of the new method is in the range of 100-300.There is still a significant gap,which is mainly Because of the real-time nature of the data,the algorithm of the new method is still rough,and the data quality is not high,and further research and optimization,this side There is still potential to improve the accuracy of the result of the filling.
5 Conclusion
Combining the ideas of multiple filling techniques and probabilistic models,this paper proposes a new method of filling variances to determine the missing values and applies them to the missing value filling process of the two-dimensional land price sample data in Shunde District,Foshan City.The experimental sample data were analyzed by stepwise regression analysis,and the significant factors were eliminated.The four independent variables of CBD,FREEWAY,PARK,and MOUNTAIN were selected from 29 attribute fields as significant factors affecting land price data.From the experimental results (Tab.7,Tab.8,Tab.9),in the three cases,the new method estimated the fill value is 75%,62.5%,100%,The traditional multiple filling methods are 25%,37.5%,and 0%,respectively,and the new method is closer to the true value.It can be seen that the overall new method is obviously superior to the traditional multiple filling methods.
Acknowledgment:This research was financially supported by FDCT NO.005/2018/A1,also supported by Guangdong Provincial Innovation and Entrepreneurship Training Program Project No.201713719017,College Students Innovation Training Program held by Guangdong university of Science and Technology Nos.1711034,1711080,and No.1711088.
References
Dorigato,A.;Pegoretti,A.;Penati,A.(2010):Linear low-density polyethylene/silica micro- and nanocomposites:dynamic rheological measurements and modelling.Express Polymer Letters,vol.4,no.2,pp.115-129.
Hagen,T.;Mohl,P.(2016):Econometric evaluation of EU cohesion policy:a survey empirical evidence on the macroeconomic effects of EU cohesion policy.Springer Fachmedien Wiesbaden,vol.7,no.1,pp.35.
Hanula,J.;Mayfield,A.;Reid,L.(2016):Influence of trap distance from a source population and multiple traps on captures and attack densities of the redbay ambrosia beetle (coleoptera:curculionidae:scolytinae).Journal of Economic Entomology,vol.109,no.3,pp.1196-1204.
Horton,N.J.;Kleinman,K.(2007):Much ado about nothing:a comparison of missing data methods and software to fit incomplete data regression models.American Statistician,vol.61,no.1,pp.79-90.
Jeong,H.;Koh,S.;Park,J.(2010):A study on the correlationship between hwa-byung and various factors including sasang constitution:for the Inhabitants of gangwon-do in 2006.Anatomical Record,vol.21,no.1,pp.159-172.
Kuznetsova,A.;Brockhoff,P.;Christensen,R.(2017):lmerTest package:tests in linear mixed effects models.Journal of Statistical Software,vol.8,no.2,pp.13.
Li,S.;Zhao,Z.;Du,Q.;Qiao,Y.(2016):A GIS-and fuzzy set-based online land price evaluation approach supported by intelligence-aided decision-making.ISPRS International Journal of Geo-Information,vol.5,no.7,pp.126.
Mallinckrodt,C.;Roger,J.;Chuang-Stein,C.(2014):Recent developments in the prevention and treatment of missing data.Therapeutic Innovation & Regulatory Science,vol.48,no.1,pp.68-80.
Papadopoulos,G;Papadopoulos,S.;Sager,T.(2016):Credit risk stress testing for EU15 banks:a model combination approach.Working Papers,vol.2,no.3,pp.11.
Pan,Y.;Li,L.;Zhang,J.(2012):Winter wheat area estimation from MODIS-EVI time series data using the crop proportion phenology index.Remote Sensing of Environment,vol.11,no.93,pp.232-242.
Qin,J.H.;Li,H.;Xiang,X.Y.;Tan,Y.;Pan,W.Y.et al.(2019):An encrypted image retrieval method based on harris corner optimization and LSH in cloud computing.IEEE Access,vol.7,no.1,pp.24626-24633.
Reddy,T.A.(2011):Estimation of linear model parameters using least squares.Applied Data Analysis and Modeling for Energy Engineers and Scientists,vol.1,no.1,pp.141-182.
Sarnak,P.;Zhao,P.;Woodbury,A.(2013):The quantum variance of the modular surface.arXiv preprint arXiv,vol.13,no.3,pp.6972-6991.
Tan,Y.;Qin,J.H.;Xiang,X.Y.;Ma,W.T.;Pan,W.Y.et al.(2019):A robust watermarking scheme in YCbCr color space based on channel coding.IEEE Access,vol.7,no.1,pp.25026-25036.
Wang,S.;Hao,C.;Xu,D.;Chen,D.(2018):Parameter estimation for rayleigh-pearson mixture model based on the expectation-maximization algorithm.OCEANS-MTS/IEEE Kobe Techno-Oceans,vol.1,no.1,pp.1-4.
Xiang,L.;Zhao,G.;Li,Q.;Hao,W.;Li,F.(2018):TUMK-ELM:a fast unsupervised heterogeneous data learning approach.IEEE Access,vol.6,no.1,pp.35305-35315.
Xie,B.;Qin,J.H.;Xiang,X.Y.;Li,H.;Pan,L.L.(2018):An image retrieval algorithm based on GIST and SIFT features.International Journal of Network Security,vol.20,no.4,pp.609-616.
杂志排行
Computers Materials&Continua的其它文章
- Optimization of Face Recognition System Based on Azure IoT Edge
- Smartphone User Authentication Based on Holding Position and Touch-Typing Biometrics
- QoS-Aware and Resource-Efficient Dynamic Slicing Mechanism for Internet of Things
- Research on Time Synchronization Method Under Arbitrary Network Delay in Wireless Sensor Networks
- A Coarse Alignment Based on the Sliding Fixed-Interval Least Squares Denoising Method
- Detecting Domain Generation Algorithms with Bi-LSTM
