Numerical Simulation of Flow-induced Noise of Two Circular Cylinders in Tandem and Side-by-side Arrangements Using a Viscous/ Acoustic Splitting Method
2019-12-10DUBingxinZHANGWenpingMINGPingjian
DU Bing-xin, ZHANG Wen-ping, MING Ping-jian
(College of Power and Energy Engineering, Harbin Engineering University, Harbin 150001, China)
Abstract: A numerical study of the noise caused by flow passing around two circular cylinders with the viscous/acoustic splitting method is performed by using the general multi-physics solver, GTEA.The acoustic characteristics of cylinders in tandem and side-by-side arrangements with different cylinder spacing and different vortex shedding behaviors are investigated at Mach number (Ma) of 0.2 and Reynolds number (Re) of 200. The acoustic fields of two cylinders in tandem arrangement with different flow patterns are all similar to the superposition of two acoustic dipoles with the same uniform flow velocity for which the source intensity is proportional to the lift force coefficient of each cylinder. The flow noise of two side-by-side cylinders directly depends on the flow pattern, and three different acoustic field types are discovered. The directivity distributions of the sound pressure level for the far-field points retain these shapes: (a) A figure-of-eight with a small disturbance in the downstream side (single-body flow pattern); (b) Two unobvious lobes (flip-flopping flow pattern); or (c) A figure-of-eight with an added lobe on the upstream side (synchronized flow pattern).
Key words: flow-induced noise; two circular cylinders; viscous/acoustic splitting method
0 Introduction
The problem of noise caused by flow passing around multiple bodies is important and common in computational aeroacoustics (CAA) and computational hydroacoustics (CHA). The flow noise generated by two circular cylinders is the typical noise of multi-body flow, and the aim of this paper is to explore the acoustic characteristics of two circular cylinders with different flow patterns using the viscous/acoustic splitting method.
There are few studies of flow-induced noise caused by two circular cylinders and many researchers have investigated the flow noise associated with a single circular cylinder with a small Re to test the accuracy of the acoustic method. In 2002, Inoue at al[7]investigated the sound of a single circular cylinder at Ma=0.05~0.3 and Re=150 by directly solving the 2D compressible Navier-Stokes (N-S) equations. In 2005, Gloerfelt et al[8]studied the flow noise generated by a single circular cylinder at Ma=0.1 and Re=1.1×10⁵with the surface integral of Curle’s formulation. In 2006, Seo et al[9]studied the noise caused by flow passing around a single circular cylinder at Re=150 with the linearized perturbed compressible equation (LPCE)method. In 2008, Cheong et al[10]computed the flow noise of a single circular cylinder by solving the linearized Euler equations with source terms (LEEs).
In this paper, the flow-induced noise of single circular cylinders at Re=200 and Ma=0.2 is first calculated to test the accuracy and the mesh independence of the viscous/acoustic splitting method. Then the acoustic characteristics of three different flow patterns for two circular cylinders in tandem and side-by-side arrangements are simulated at Re=200 and Ma=0.2.The calculations of the fluid dynamics and acoustic equations are both performed with the general fluid flow solver, GTEA, which is a self-developed unstructured grids finite volume solver.
1 Governing equations
The viscous/acoustic splitting method (VASM) was first initiated by Hardin and Pope[11]and then improved by Shen et al[12]by changing the decomposed equations for the basic variables. The derivation of the viscous/acoustic splitting method is based on the compressible NS equations:
Compressible continuity equation:

Compressible momentum equation:

State equation for isentropic flow:

where ρ, u and p are the compressible density, velocity and pressure, respectively; c is the speed of sound; and μ is the dynamic viscosity.
The viscous/acoustic splitting method uses a splitting approach introduced by Hardin and Pope for the flows at a small Mach number (Ma≤0.3). The variables (ρ, u, p) in Eqs.(1)-(3)could be split into incompressible and fluctuating acoustic parts as shown in Eqs.(4)-(6):

where P, U and ρ0stand for the pressure, velocity, and density of the incompressible flow, respectively; and p′, u′ and ρ′ are the acoustic pulsating pressure, velocity and density, respectively.
The variables of incompressible flow are solved by the incompressible N-S equations:

Introducing the decomposed variables into Eqs.(1)-(3) and considering Eqs.(7)-(8), the final perturbed acoustics equations could be
Acoustic continuity equation:

Acoustic momentum equation:

Acoustic state equation:

where A stands for the acoustic co-velocity vector, A= ρu′+ρ′U, and S is the acoustic source and could be written as:

where μAis equal to μ over ρ.
The equations of the acoustic boundary condition are shown below:
Acoustic non-sliding boundary:

Acoustic non-reflecting boundary[13]:

where unis the normal compressible velocity, f is the transform function from ∂/∂xjto ∂/∂r, r is the distance from acoustic source to the far-field boundary, and (θ,φ )are the underlying variables of spherical coordinates.
2 Numerical methods
The collocated finite volume method (CFVM) is adopted for the numerical discretization of both the incompressible fluid dynamics equations and the VASM equations. The SIMPLE algorithms are both used to calculate the fluid and the acoustic equations. The details are described in early publications[14].
In the flow-induced noise solution process, the flow equations are solved immediately and the acoustic equations are solved after the flow field becomes regular. After the acoustic equations solution process starts, the equations of flow and acoustics are solved, in turn, in each time step so that the flow variables used in acoustic equations can be updated before the calculation of the acoustic equations.
3 Mathematical model and boundary condition

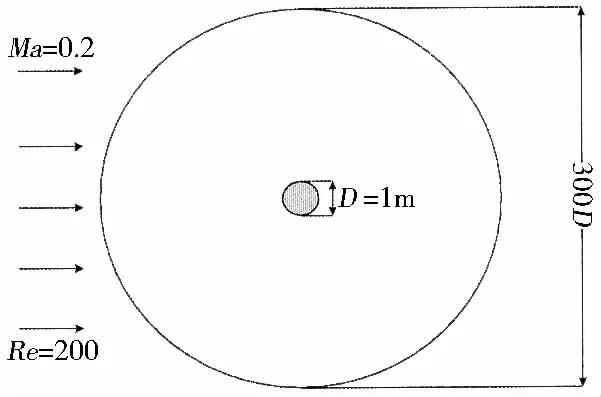
Fig.1 Computational domain
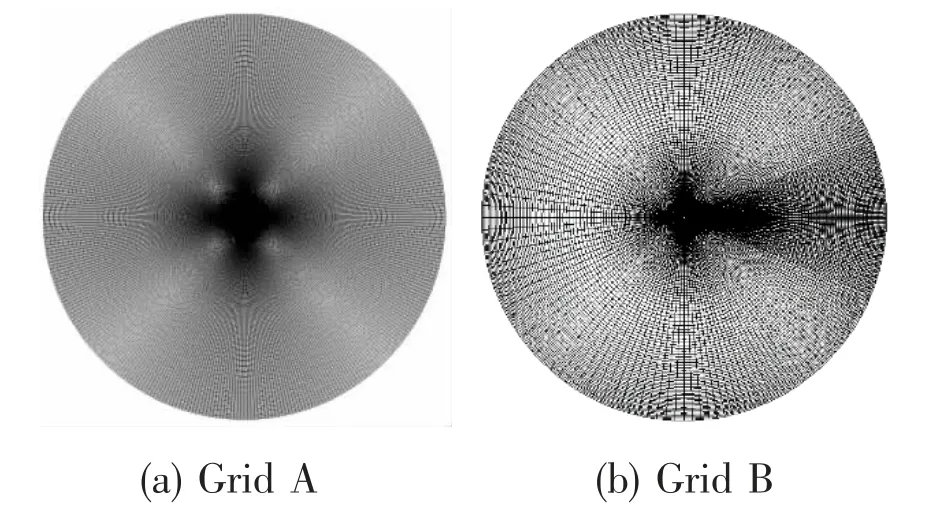
Fig.2 Computational grid of single circular cylinder
The boundary conditions for each case are the same. In flow simulation, the velocity inlet condition (u=0.2, Ma=68.6 m/s, v=0) is applied on the left semi-circumference and the pressure outlet condition is applied on the right semi-circumference. In calculating the acoustic equations, the inner cylinder surface uses the acoustic non-sliding condition and the acoustic non-reflecting condition is applied on the two semi-circumferences. The time step chosen in the simulation is 0.001 s for Grid A, 0.002 5 s for Grid B, and the acoustic solver is activated at t=3.5 s.
4 Results and analysis
4.1 Single circular cylinder


where U is the free-stream velocity, Fdragand Fliftare the total drag force and lift force on the cylinder, and f is the main peak frequency of Cl.
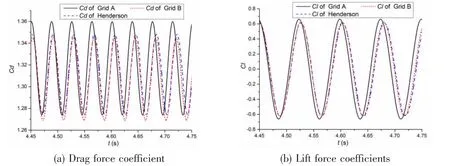
Fig.3 Comparison of curves between Henderson and the current work


Tab.1 The results of the single circular cylinder at Re=200
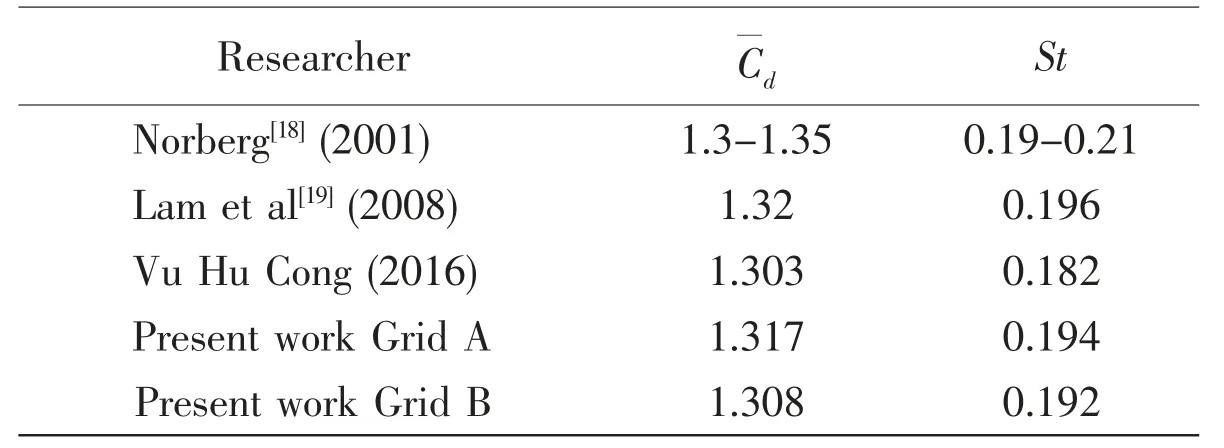
Continue Tab.1
Fig.4 shows the instantaneous sound pressure of the single cylinder. The acoustic results of Grid A and Grid B have a similar distribution: the flow noise of the single cylinder is symmetrically generated by each side of the cylinder and is propagated perpendicular to the stream direction.
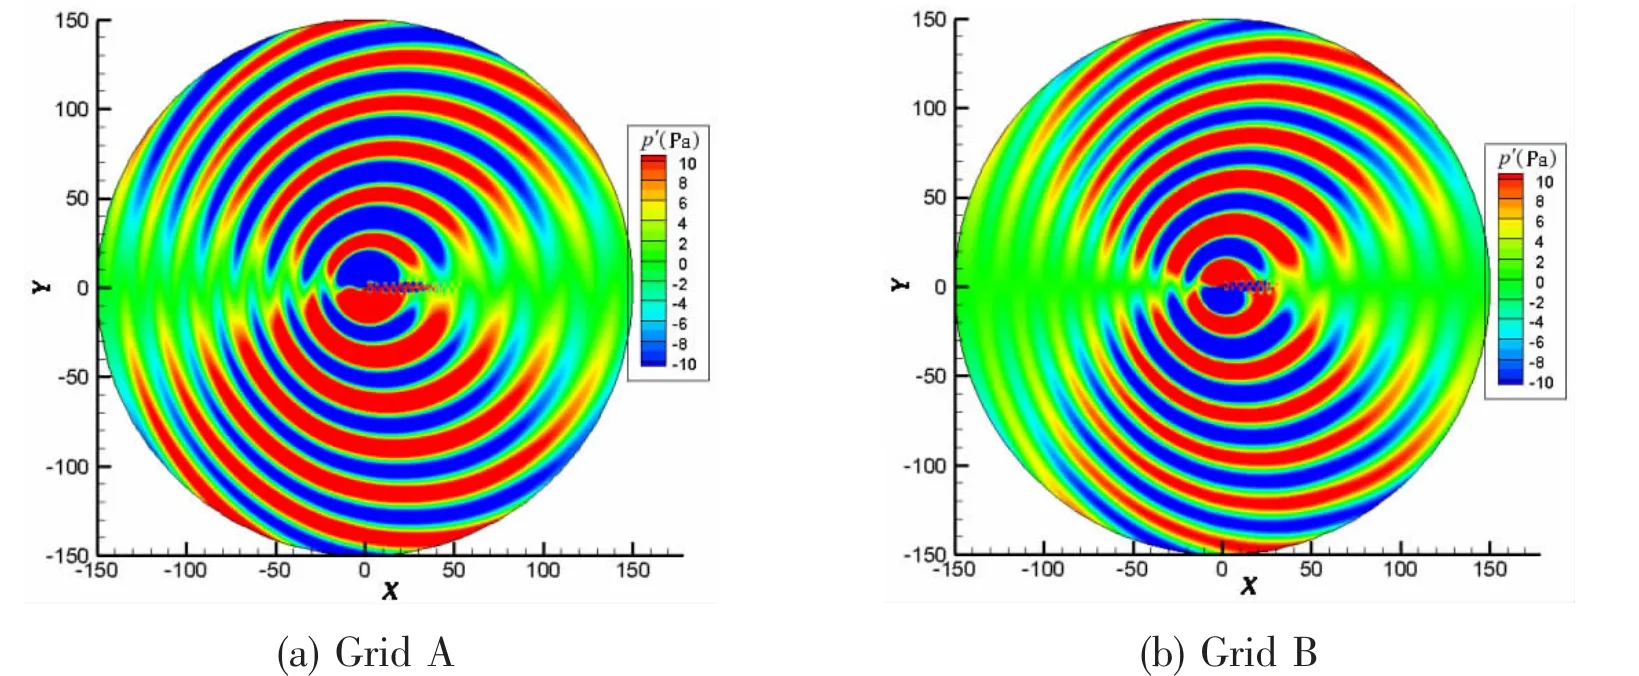
Fig.4 Contour of instantaneous acoustic field
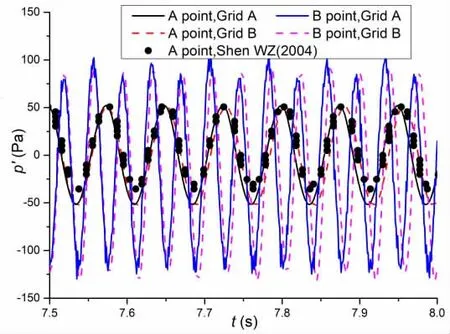
Fig.5 Curves of sound pressure at points in the time domain
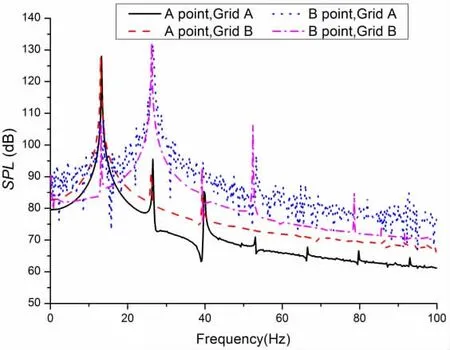
Fig.6 Curves of sound pressure at points in the frequency domain
Two monitor points are chosen to study the acoustic characteristic along and vertical to the stream direction: A (0, 20, 0), B (20, 0, 0). Fig.5 shows the sound pressure (p′) curves at two monitor points in the time domain. As shown, the sound pressure curve of point A, Grid B, is close to the result of Shen[20]in the same time period, whereas the period of Grid A’s curve is a little smaller. The sound pressure curve of point B, Grid A, has the same small highfrequency fluctuation and the amplitudes of Grid A’s and Grid B’s curves are the same. Fig.6 shows the sound pressure level (SPL) curves in the frequency domain. According to Fig.6, the main peak frequency of the SPL at point A (vertical to the stream direction) is 13.3 Hz for Grid A and 13.05 Hz for Grid B, which equal the frequency of Cl, and the main peak frequency of the SPL at point B corresponds to the frequency of Cd.
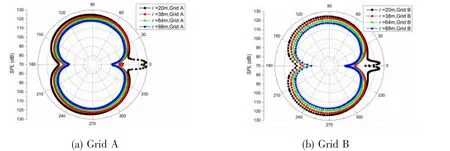
Fig.7 SPL directivity diagram of the single circular cylinder
Fig.7 shows the directivity distribution of the SPL for the single circular cylinder with different r. SPL is calculated by Eq.(19):

where pref=2e-5Pa and peffis the effective sound pressure.
The correctional equation of r is used to remove the effect of the Mach number on the acoustic directivity:

As shown in Fig.7, the acoustic directivity distribution of Grid A and Grid B are the same:the directivity distribution of the SPL in the far field has the figure-of-eight shape and the SPL directivity in the near field has two extra small crests in the downstream direction. These two small crests are generated by the non-propagated perturbed wave (pseudo-sound), which quickly disappears along the stream direction. As shown in Fig.4, the domain of the non-propagated perturbed wave of Grid A is a little bigger than that of Grid B.
According to the discussion above, the flow and acoustic accuracy between Grid A and Grid B are almost the same. Grid B is used in the analysis of two cylinders below and the size of the grid is about 67 340~70 281 for the tandem cylinders and 68 289 ~69 366 for the sideby-side cylinders.
4.2 Two tandem circular cylinders
Three different vortex shedding patterns of two tandem cylinders are obtained at s=1.1~5.0 and Re=200, which is close to the result of Vu (2016). Fig.8 gives the vorticity contour of flow with different patterns.
As shown in Fig.8(a), the flow field of two tandem cylinders with small s is similar to the single cylinder result and is called the single-body (SB) flow pattern. According to Figs.8(b)and 8(c) with middle s, the reattach point appears on the downstream surface of the cylinder and the flow can be classified as the reattachment flow (RF). For Figs.8(d) and 8(e) with large s, the vortex shedding can be clearly seen in the gap between the two cylinders and the flow is the typical vortex shedding (VS) flow.
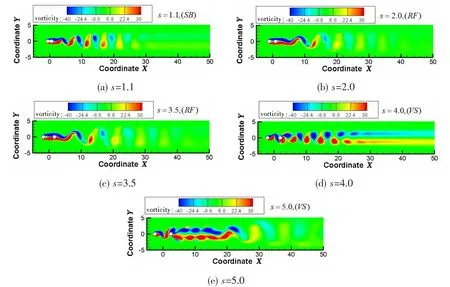
Fig.8 Contours of vorticity of two tandem circular cylinders
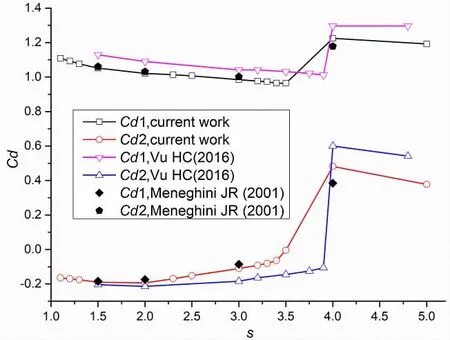
Fig.9 Curves of mean drag force coefficients(Cd1, upstream; Cd2, downstream)
Fig.10 shows the instantaneous sound pressure of two tandem cylinders. The directivity distribution of tandem cylinder noise with different s and different vortex shedding behavior retains the basic figure-of-eight shape. With the increase of s, the center of the acoustic field slightly deviates from the central point of two cylinders.

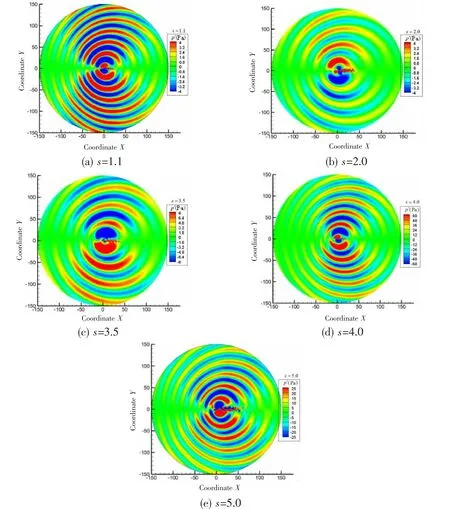
Fig.10 Instantaneous sound pressure of two tandem cylinders
The acoustic source superposition method is used to study the flow noise of two tandem cylinders. The sound field generated by two acoustic dipoles with the same uniform flow velocity is calculated. The location of the source point for the dipoles is the center of each cylinder and the source strength is proportional to Clof each cylinder, respectively. The sound pressure, p′, is calculated:

where U0is the velocity of uniform flow.
The acoustic field, calculated by the viscous/ acoustic splitting method and the superposition method, is shown in Fig.11. The far-field acoustic directivity of the two methods have a similar distribution. So the noise caused by flow passing around two tandem cylinders could be approximate to the superposition of two acoustic dipoles, whose source intensity is proportional to the lift force coefficient of each cylinder, respectively.
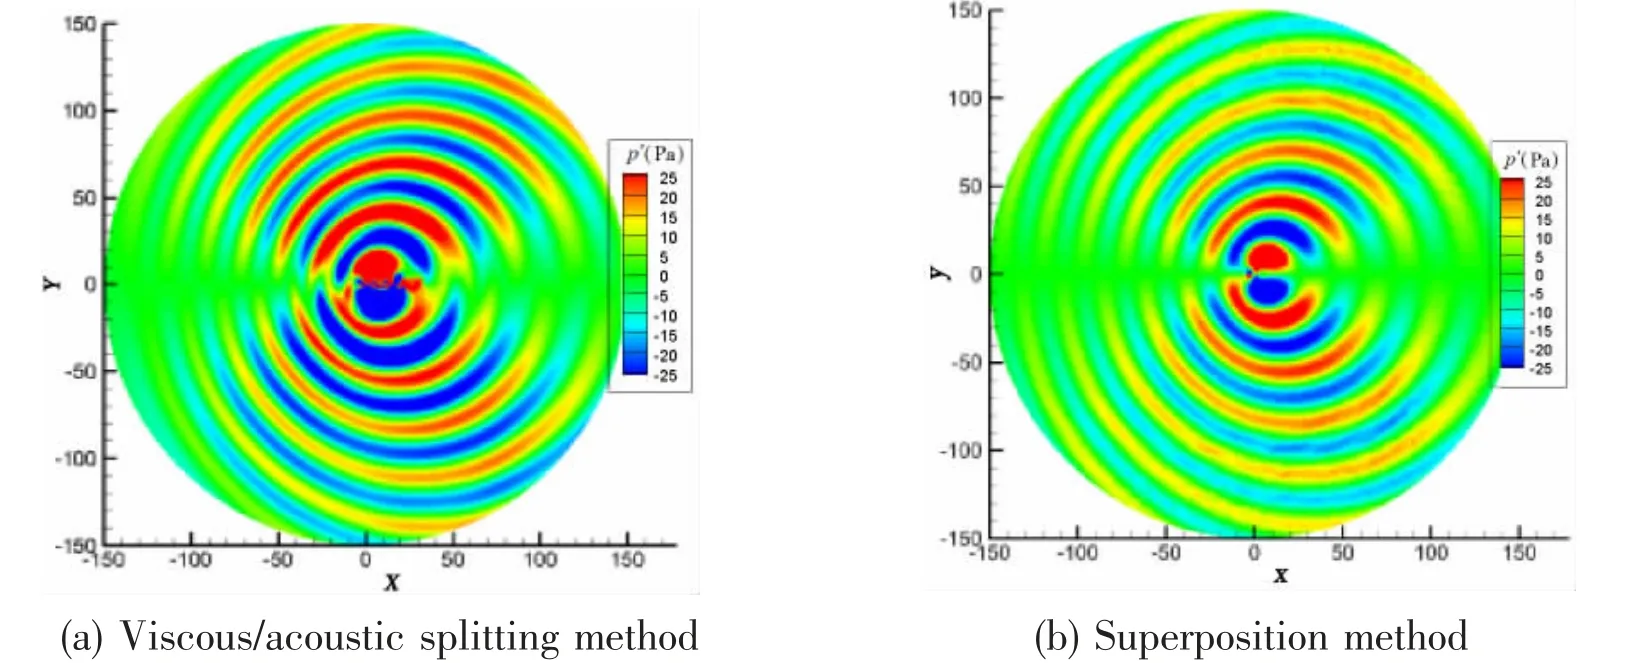
Fig.11 Contour of instantaneous acoustic field at s=5 with two different methods
4.3 Two side-by-side circular cylinders
Three different vortex shedding behaviors are successfully observed for the two side-byside cylinders at Re=200, s=1.05~4.0 in this article: (1) single-body (SB) flow with small s(s=1.05, 1.1); (2) flip-flopping (FF) flow, in which the two vortices flip-flop in the gap with a random model (s=1.7); and (3) synchronized vortex shedding (VS) flow, in which the shedding vortex of each cylinder is synchronized.
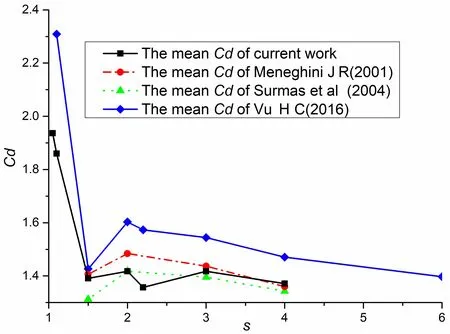
Fig.12 Curves of mean drag force coefficient

Fig.13 Vorticity of cylinders at s=1.05, 1.1 with the side-by-side arrangement
Fig.13 shows the vorticity contours at s=1.05 and s=1.1 with the single-body flow wave pattern. At Re=200, the flow of two cylinders in the side-by-side arrangement with small s could only generate one vortex street but the interference of vortices appears at x>20D in the downstream region and breaks the regular vortex street trace.
The interference of vortices directly influences the distribution of flow-induced noise.Fig.14 shows the instantaneous sound pressure contours at s=1.05 and 1.1. As shown in Fig.14,the acoustic field of two side-by-side cylinders with the SB flow pattern at Re=200 is not as regular as that of the tandem cylinders. The flow noise generated by the single vortex street does not regularly propagate perpendicular to the stream direction. The direction of sound propagation is not fixed and the acoustic wave petals are not perfectly symmetrical about the x-axis. With the increase of s, the interference of vortices becomes more severe and some small acoustic perturbation appears in the downstream direction.
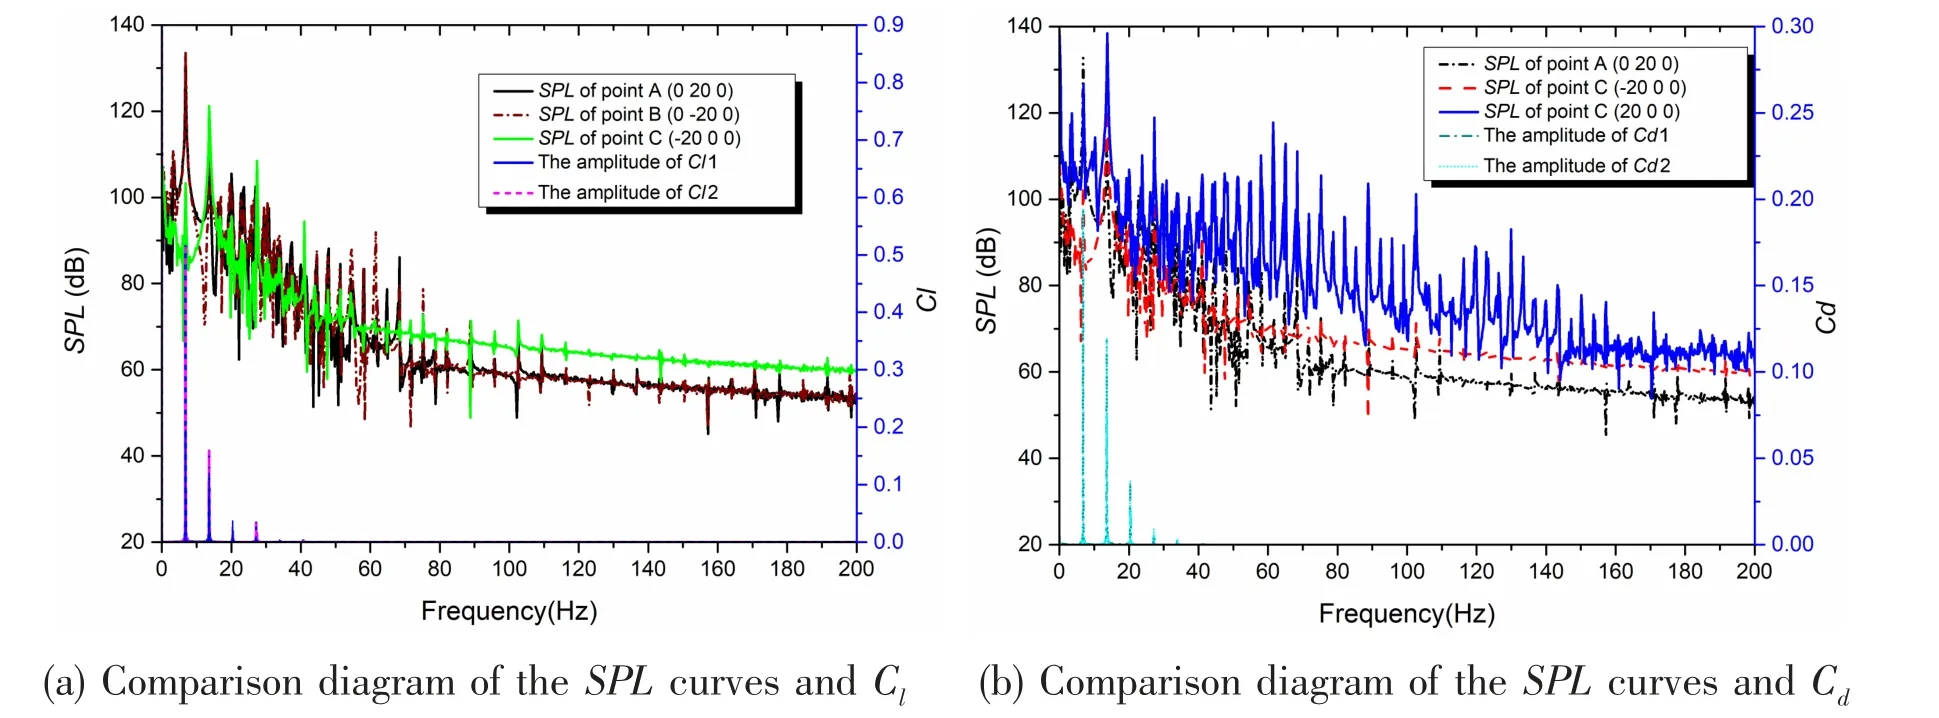
Fig.15 Comparison diagram of the SPL curves and Cd, Cl at s=1.1 (1-upstream; 2-downstream)
Four acoustic monitor points are chosen to study the acoustic characteristic along and vertical to the stream direction with the same radius (20D). Fig.15 shows diagram of the SPL curves of each monitor point and the curves of Cd, Clin the frequency domain. As shown in Fig.15(a),the SPL curves of the symmetry points vertical to the stream direction keep the same shape and the main peak frequency of points A and B is equal to the main frequency of Cl, 6.8 Hz.The SPL of point C in the upstream direction is 10 dB lower than point A and the main peak frequency is 13.6 Hz, which is the main frequency of Cd. The SPL curve of point D in the downstream direction includes some high-frequency disturbance (60-80 Hz), which is caused by the pseudo-sound wave and the main acoustic peak frequency is still 13.6 Hz.
Fig.16 shows the SPL directivity diagrams with different r values at s=1.05 and 1.1. The SPL directivity distribution of the SB flow pattern retains the figure-of-eight shape in the far field. With the increase of s, some small perturbation appears in the left lobes as the effect of the interference of vortices in the downstream region.
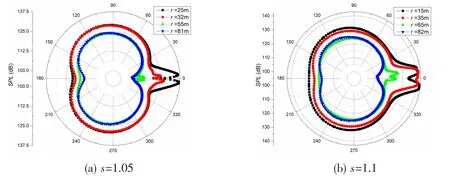
Fig.16 The sound pressure directivity diagram of two side-by-side circular cylinders
Fig.17 shows the vorticity distribution of the FF flow pattern at s=1.7. As shown in Fig.17, vortices form in the small gap and there is strong interference from vortices in the downstream domain. The vortices that shed from the inward and outward edge of cylinders crash, break, and coalesce in the downstream region.
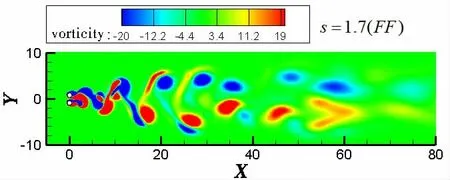
Fig.17 Vorticity of two cylinders at s=1.7 with the side-by-side arrangement
The intense interference of each vortex directly influences the acoustic field. The perturbation of P on the pressure-out condition with r=150D could not fit the acoustic radiation boundary and the computation region of s=1.7 extends to 400D. Fig.18 gives the distribution of instantaneous sound pressure with s=1.7. The acoustic field of the FF flow pattern could not retain the dipole noise shape and the sound petals generated by the irregular vortices propagate in random directions. The instantaneous distribution of sound pressure is similar to that generated by multipole noise.
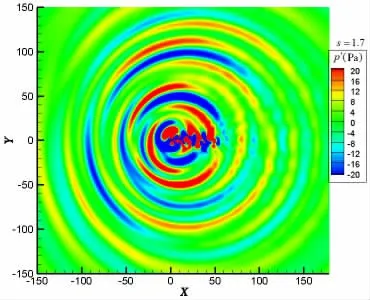
Fig.18 Instantaneous sound pressure of cylinders at s=1.7 with the side-by-side arrangement
Fig.19 shows the SPL curves of points on the x-axis and y-axis, which are compared with the curves of Cdand Clin the frequency domain. As shown in Fig.19, Cdand Clof each cylinder are irregular in the time domain, but the frequency curves retain similar distributions. So the SPL of points A and B retain similar distribution and the main peak frequencies are 6.65 Hz, 13.3 Hz and 19.95 Hz, which are equal to the peak frequencies of Cl. The SPL of point C in the upstream direction could not maintain the same distribution as the one at point A or B.The peak at 6.65 Hz disappears and the highest SPL appears at 13.3 Hz. Because of the intense interference of the vortices in the downstream domain, the SPL of point D is 20 dB higher than the one at point A or B and does not have the typical peak frequency.
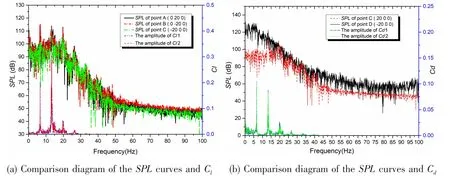
Fig.19 Comparison diagram of the SPL curves and Cd, Cl at s=1.7 (1-upstream; 2-downstream)
Fig.20 shows the directivity diagram of the SPL at s=1.7 with different r values. As shown in Fig.20, the SPL directivity diagram of the noise generated by the FF wake pattern did not maintain the figure-of-eight shape. According to the time average, the directivity of the SPL calculated by the effective sound pressure maintains the shape of two unobvious lobes at 80 and 215 degrees.
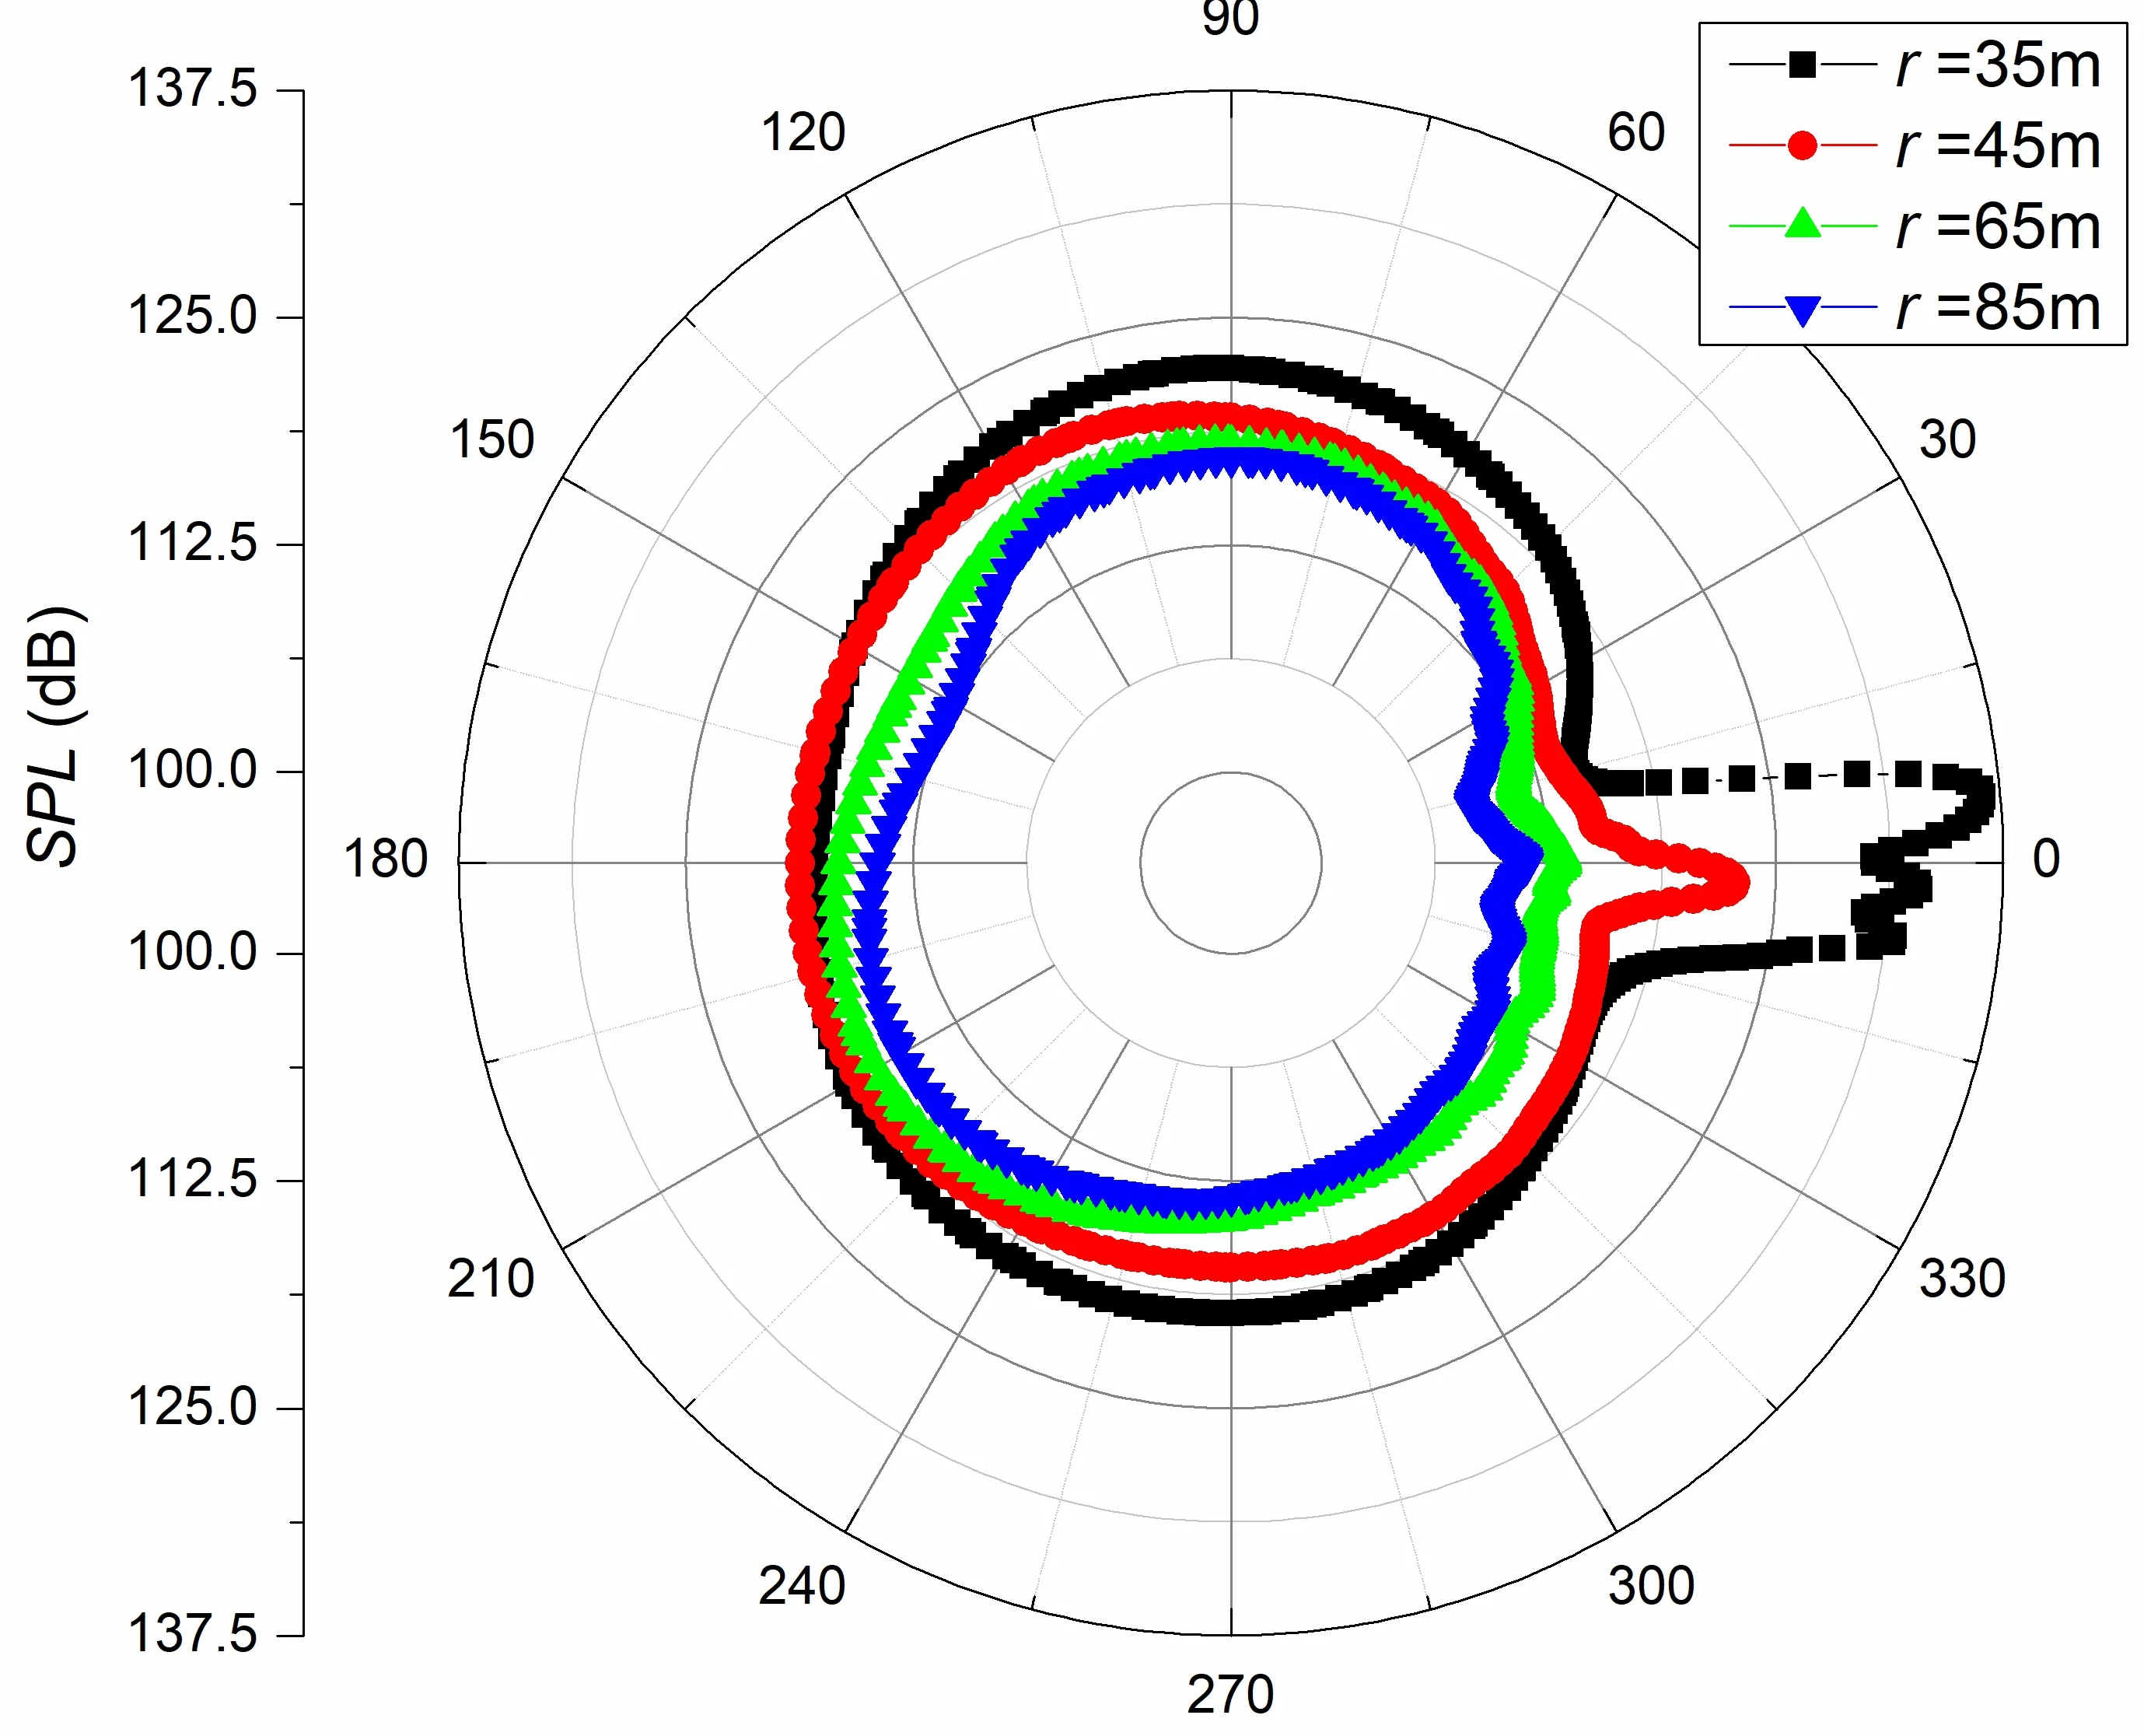
Fig.20 SPL directivity diagram of cylinders at s=1.7 with the side-by-side arrangement
Fig.21 shows the vorticity contours of the VS flow pattern at s=3.0 and 4.0. With an increased gap, the gap flow becomes regular and the vortices that shed from each circular cylinder become two independent processes.

Fig.21 Vorticity of cylinders at s=3.0, 4.0 with the side-by-side arrangement
Fig.22 shows the distribution of the instantaneous sound pressure at s=3.0 and 4.0. The acoustic field generated by the VS flow is regular and the sound waves caused by the two regular vortex streets propagate perpendicular to the stream direction. According to Fig.22,the acoustic transmission effect of the gap becomes obvious and the sound wave generated in the downstream region propagates to the upstream region through the gap.
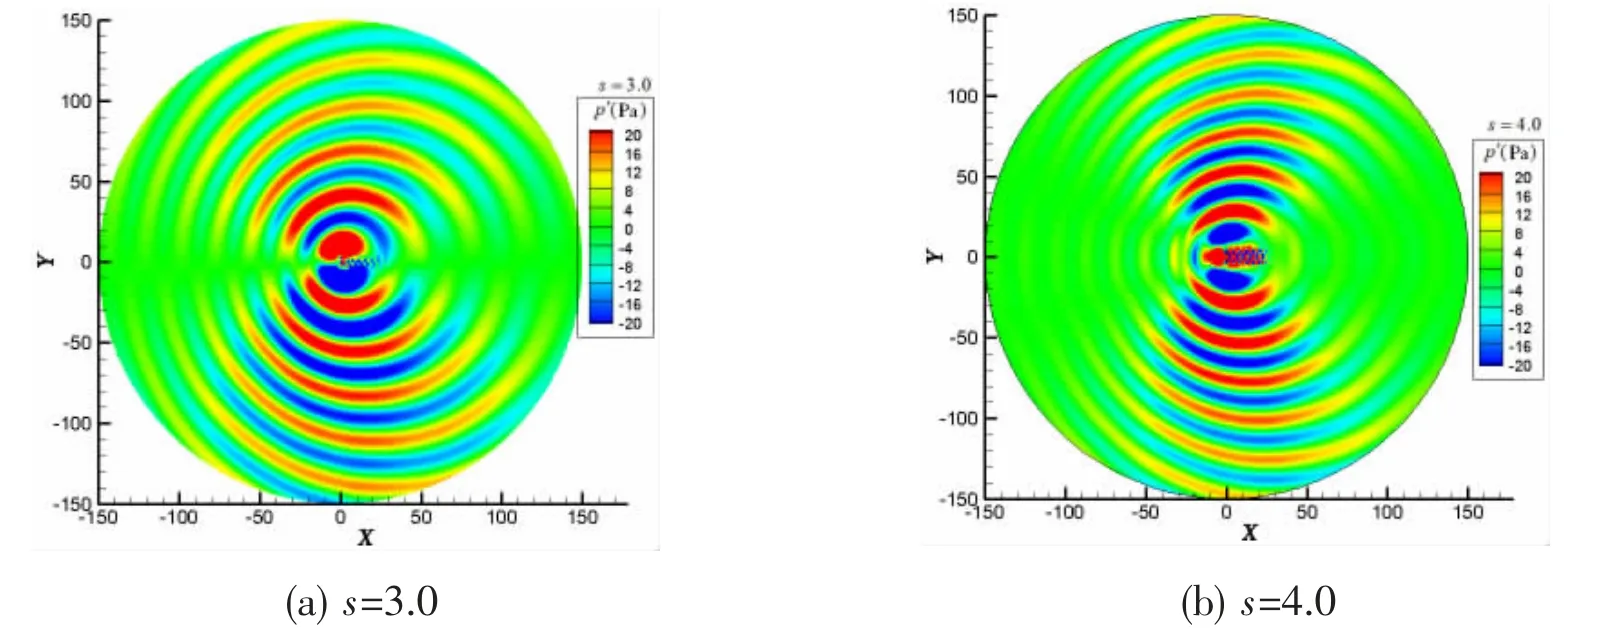
Fig.22 Instantaneous sound pressure of cylinders at s=3, 4 with the side-by-side arrangement
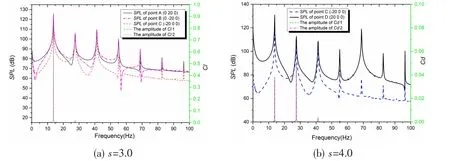
Fig.23 Comparison diagram of the SPL curves and Cd, Cl at s=3.0 (1-upstream; 2-downstream)
Fig.23 and Fig.24 show the SPL curves of points on the x-axis and y-axis at s=3.0 and 4.0.As shown in Fig.23(a), the SPL of the points vertical to the stream direction and the upstream point at s=3.0 have a similar distribution in the frequency domain. The peak frequency of the SPL curves at point A, B and C is 13.8 Hz, which is the peak frequency of Cl. As shown in Fig.21,point D is located in the symmetry axis of the two regular vortex streets and the effect of the pseudo-sound wave becomes small. The SPL curve of point D at s=3.0 has the same peak frequency of Cland the frequency of the pseudo-sound wave appears at the fifth-order harmonic frequency of Cl. According to Fig.24, the SPL curve of the acoustic monitor points at s=4.0 keeps the same regularity of that at s=3.0 and the peak frequency is 13.35 Hz.
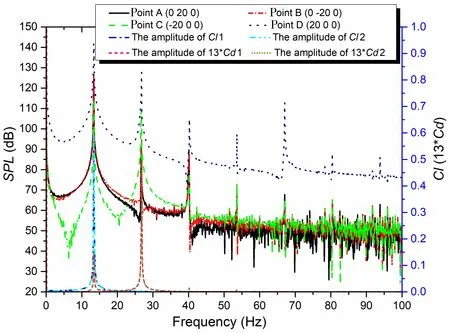
Fig.24 Comparison diagram of the SPL curves and Cd, Cl at s=4.0 (1-upstream; 2-downstream)
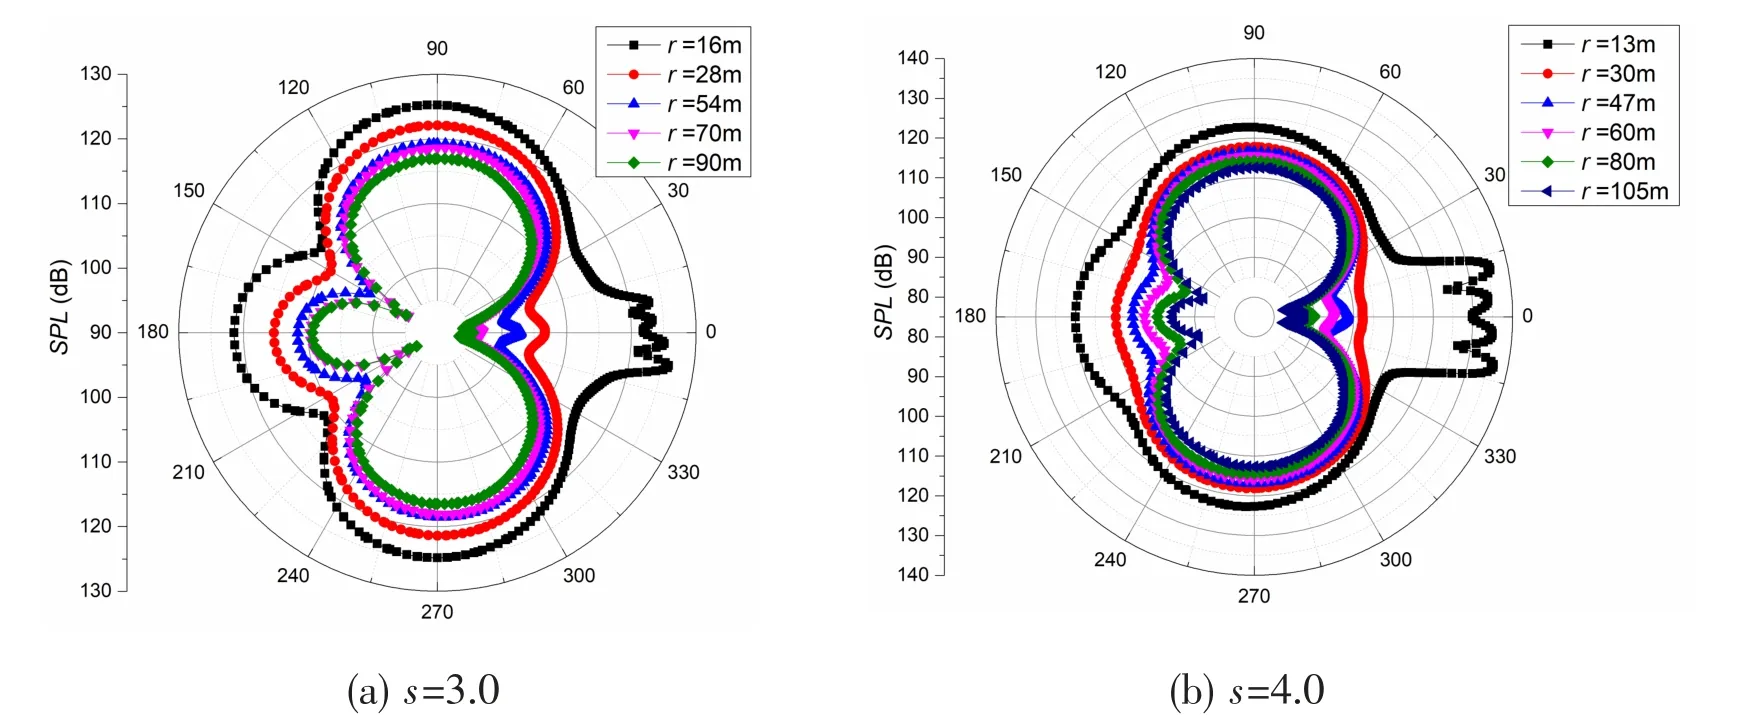
Fig.25 The SPL directivity diagram of cylinders with the side-by-side arrangement
Fig.25 shows directivity diagrams of the SPL at s=3.0 and 4.0. The SPL directivity distribution of cylinders with the VS flow pattern retains the figure-of-eight shape with an added lobe in the upstream direction.
5 Conclusions
The noise generated by flow passing around two tandem or side-by-side circular cylinders was studied by using the viscous/acoustic splitting method. The flow noise of two tandem cylinders with different vortex shedding behaviors maintains similar distribution regularity and could approximate the superposition of two acoustic dipoles with the same spacing and the source intensity of each dipole is proportional to the lift force coefficient of each cylinder. The acoustic field caused by flow passing around two circular cylinders in the side-by-side arrangement is influenced by the different flow patterns. The SPL directivity distributions in the far field retain the following shapes:
(1) Figure-of-eight with small perturbation of the lobe in the downstream direction (single-body flow pattern);
(2) Two unobvious lobes at 80 and 215 degrees (flip-flopping flow pattern);
(3) Figure-of-eight with an added obvious lobe in the upstream direction (synchronized flow pattern).
杂志排行
船舶力学的其它文章
- Numerical Prediction of Propeller Noise Based on the‘Source Time-Dominant Algorithm’
- Simulation of Ship Motions Based on the HOBEM Acceleration Potential Method
- Experimental Study on Air Bleed Fusion of Underwater Vehicle
- Numerical Simulation of Cavity and Hydrodynamic Force of the Sphere Water Entry in Consideration of Surface Wettability
- Improved Moving Particle Semi-implicit Method with Large Eddy Simulation for Determining Water-entry Impact and Damage to Flat-bottomed Structures
- A Phase Modification Methodology in Modelling Deterministic Freak Wave Train
