Ultrasound-based techniques for the diagnosis of liver steatosis
2019-11-19GiovannaFerraioliLiviaBeatrizSoaresMonteiro
Giovanna Ferraioli, Livia Beatriz Soares Monteiro
Abstract Non-alcoholic fatty liver disease (NAFLD) is the leading cause of diffuse liver disease. An accurate estimate of the fat in the liver is important in the diagnostic work-up of patients with NAFLD because the degree of liver steatosis is linked to the metabolic syndrome and the cardiovascular risk. Ultrasound (US) B-mode imaging allows to subjectively estimate the fatty infiltration in the liver; however,it has a low performance for the detection of mild steatosis. Quantitative US is based on the analysis of the radiofrequency echoes detected by an US system, and it allows to calculate a backscatter coefficient or an attenuation coefficient or the sound speed. The estimation of the backscatter coefficient is rather cumbersome and requires the use of a phantom for addressing all sources of variability.Controlled attenuation parameter (CAP) available on the FibroScan® system(Echosens, France) measures the attenuation of the US beam. CAP is accurate in grading fatty infiltration-even though there is an overlap between consecutive grade of liver steatosis-and the values are not influenced by liver fibrosis. Several US manufacturers are developing or have already developed software for quantifying the attenuation of the US beam. Preliminary results show that proprietary technologies implemented in US systems seem more accurate than CAP for grading liver steatosis. Another available method for quantifying liver steatosis is based on the computation of the sound speed and the initial results appear promising.
Key words: Non-alcoholic fatty liver disease; Chronic liver disease; Ultrasound;Controlled attenuation parameter; Quantitative ultrasound; Attenuation imaging
INTRODUCTION
Non-alcoholic fatty liver disease (NAFLD) is the leading cause of diffuse liver disease.NAFLD ranges from liver steatosis to non-alcoholic steatohepatitis (NASH). This latter may progress to liver cirrhosis with its complications, namely portal hypertension and hepatocellular carcinoma. It has been estimated that the global prevalence of NAFLD is 25.24%, with 40.76% progression to fibrosis and 0.09% mean annual rate of progression in NASH[1]. The reason why some NAFLD patients, even those with a low amount of fat in the liver, will develop NASH is still not clearly understood. It is well known that the degree of liver steatosis is linked to the metabolic syndrome and the cardiovascular risk[2]. On the other hand, it has recently been reported that significant steatosis is associated with progression of fibrosis in NAFLD patients[3]. Therefore, an accurate estimate of the quantity of the fat in the liver is of great interest in the diagnostic work-up of patients with liver steatosis. This review of the literature is focused on the assessment of liver steatosis using ultrasound (US) techniques.
ULTRASOUND: SEMIQUANTITATIVE ASSESSMENT
US B-mode imaging allows to subjectively estimate the degree of fatty infiltration in the liver. The grading of liver steatosis is usually obtained using some US features that include liver brightness, contrast between the liver and the kidney, US appearance of the intrahepatic vessels, liver parenchyma and diaphragm. Steatosis is graded as follows: Absent (score 0) when the echotexture of the liver is normal; mild(score 1), when there is a slight and diffuse increase of liver echogenicity with normal visualization of the diaphragm and of the portal vein wall; moderate (score 2), in case of a moderate increase of liver echogenicity with slightly impaired appearance of the portal vein wall and the diaphragm; severe (score 3), in case of marked increase of liver echogenicity with poor or no visualization of portal vein wall, diaphragm, and posterior part of the right liver lobe[4-6].
The performance of US B-mode imaging for the detection of mild steatosis (fat content > 5%) is low, with reported sensitivity of 60.9%-65%[6,7]. A meta-analysis has assessed that, for the detection of moderate-severe fatty liver (> 20%-30% steatosis), Bmode US has a performance similar with computed tomography or magnetic resonance imaging (MRI). Compared to histology as reference standard, the overall sensitivity and specificity of B-mode US were, respectively, 84.8% and 93.6%, with 0.93 (0.91-0.95) area under the ROC curve (AUROC)[5].
Abdominal gas or obesity may decrease the applicability of B-mode US. Moreover,in patients with liver fibrosis the accuracy of the technique for diagnosing hepatic steatosis may decrease[8,9]. On the other hand, a significant intra- and inter-observer variability for the assessment of the US findings of liver steatosis has been reported[10,11]. However, it should be emphasized that US B-mode imaging is widely available, noninvasive, repeatable because there is no exposition to ionizing radiation,it has low cost and is well-accepted by patients. Indeed, the technique has been recommended as the preferred first-line diagnostic procedure for imaging of NAFLD in adults by the clinical practice guidelines of the European Association for the Study of the Liver released together with the European Association for the Study of Diabetes and the European Association for the Study of Obesity[12]. An A1 score,i.e., a high quality of evidence with a strong strength, has been assigned to this recommendation.
Hamaguchi score
To calculate the Hamaguchi score, four US findings, including hepatorenal echo contrast, bright liver, deep attenuation, and vessel blurring, are evaluated. Bright liver and hepato-renal contrast are evaluated together: The score goes from 0 to 3, if they are both negative the final score is zero. Deep attenuation goes from 0 to 2, and vessel blurring can be positive (score 1) or negative (score 0)[13]. In a series of 94 patients undergoing liver biopsy, Hamaguchiet al[13]found that a score ≥ 2 had an AUROC of 0.98 with 91.7% sensitivity and 100% specificity for diagnosing NAFLD. A score ≥ 1 was able to diagnose visceral obesity, with 68.3% sensitivity and 95.1% specificity. It needs to be underlined that this score has not been validated yet in large series of patients.
US-FLI score
The US-FLI score is based on the following features: Liver/kidney contrast,attenuation of the US beam, poor vessel visualization, difficult visualization of the gallbladder wall, poor visualization of the diaphragm, and presence of fatty sparing areas. The score ranges from 2 to 8 and NAFLD is diagnosed by a score at least > 2.Conditio sine qua nonis the presence of the contrast between the liver and the kidney,which is scored 2 if mild/moderate and 3 if severe. The presence of each other finding is scored 1[14]. In a small series of non-consecutive patients, using liver histology as reference, it has been reported that the US-FLI score was independently associated with NASH (OR: 2.236;P= 0.007) and an US-FLI < 4 ruled out severe NASH (negative predictive value, 94%) but its specificity was low (45.7%). The AUROCs were 0.76 for the diagnosis of NASH and 0.80 for the diagnosis of severe NASH[15]. Still, as for the Hamaguchi score, the US-FLI score lacks validation.
Hepatorenal steatosis index
Webbet al[16]retrospectively calculated a hepatorenal sonographic index, which was based on liver/kidney cortex echogenicity ratio. A histogram analysis of the echogenicity, which is a proprietary software available on the EUB-8500 US system(Hitachi Ltd., Japan), was used. The results were excellent, with AUROCs higher than 0.90 for all steatosis grades. Another group has used a freeware available online,reporting that a hepatorenal index of 1.28 or higher had 100% sensitivity and 54%specificity for identifying steatosis > 5%[17]. However, it was necessary to convert the images from a picture archiving and communication system (PACS) into JPEG images, as well as to download an outside software. The same authors have recently reanalyzed the DICOM images of the patients included in the previous study,downloading them directly from the PACS and using a markup region of interest tool. They report a better performance: A hepatorenal index of 1.34 or higher had 92%sensitivity and 85% specificity for identifying steatosis > 5%[18]. The hepatorenal steatosis index lacks validation in large series of patients; therefore, the applicability of the findings to the general population is unclear.
QUANTITATIVE ULTRASOUND
The analysis of the radiofrequency (RF) echoes detected by an US system may allow to calculate a backscatter coefficient or an attenuation coefficient or the sound speed.
Backscatter coefficient
For the evaluation of liver steatosis, it has been reported that quantitative indices of liver parenchyma backscattering are more accurate than a subjective assessment[19].Backscatter coefficient (BSC) is estimated by using a computer algorithm and a reference phantom in order to reduce sources of variability due to US systems or operators. The measurement can be performed on any conventional US system, and the reproducibility is reportedly high and independent from the operator or the settings of the US system[20]. By using proton density fat fraction estimated by magnetic resonance imaging (MRI-PDFF) as reference in a cohort of 204 adult subjects, it has been reported that the BSC analysis was able to diagnose NAFLD(MRI-PDFF > 5%) with 93% and 87% sensitivity, respectively, in the training and validation groups, and with 97% and 91% specificity. The AUROC was 0.98 (0.95-1.00)in the training group with an optimal BSC cutoff of 0.0038 square radian.
The technique, however, is rather cumbersome and requires the use of a phantom for addressing all sources of variability.
Controlled attenuation parameter
Controlled attenuation parameter (CAP) is the technique available on the FibroScan system (Echosens, Paris, France) that measures the attenuation of the US beam as it traverses the liver tissue. CAP is evaluated together with liver stiffness measurement and using the same RF data[21]. The results are given in decibels per meter (dB/m),ranging from 100 to 400 dB/m. The technique is available on the M and XL probe of the FibroScan system, and the choice between the two probes is based on the skin-toliver capsule distance (up to 25 mm or higher than 25 mm). The inter-observer reproducibility of the technique is high, with a concordance correlation coefficient of 0.82 (0.78-0.85)[22]. A study performed in a large series of patients has reported measurement failure in 7.7% of cases, showing that factors independently associated with failure were female gender, body mass index (BMI), and metabolic syndrome[23].Several studies, in which liver biopsy was used as the reference standard, have reported a good performance of the CAP in grading liver steatosis[24-28].
In a recent meta-analysis based on 19 studies and 2735 patients, the CAP optimal cut-off values were 248 (237-261) dB/m for mild steatosis (S > 0); 268 (257-284) dB/m for significant steatosis (S > 1); 280 (268-294) dB/m for severe steatosis (S > 2)[29]. CAP values were influenced by several covariates including NAFLD, diabetes and BMI.Accordingly, it has been suggested to add to the optimal cut-offs 10 dB/m in case of NAFLD/NASH or diabetic patients, and to adapt the values also to the body mass index. AUROCs were all higher than 0.80; however, for the detection of steatosis (S >0) the sensitivity was suboptimal [0.69 (0.60-0.75)]. The patients included in the metaanalysis presented mixed etiologies of liver disease and only 20% of them had NAFLD/NASH.
In a series of patients with NAFLD/NASH, the optimal cutoff for the diagnosis of steatosis, obtained with MRI-PDFF as the reference standard, was 288 dB/m[30].Quality criteria for reliable CAP measurements are not yet defined and there are conflicting results in the literature. It has been reported that the validity of the CAP for the diagnosis of liver steatosis is higher when the interquartile range (IQR) of the 10 acquisitions is below 40 dB/m[31]. Another study has set the IQR upper limit at 30 dB/m[30]. On the contrary, a recent multicenter study that enrolled patients with NAFLD showed that there wasn't any difference in CAP performance when the IQR was ≥ 30 dB/m or ≥ 40 dB/m[32]. In this study, the Youden cutoff values for S > 1, S >2, and S > 3 liver steatosis were 302 dB/m, 331 dB/m, and 337 dB/m, respectively,and the highest accuracy was at the S > 1 threshold.
Using the latent class analysis method in a series of 726 subjects, it has been reported that, in patients with chronic viral hepatitis and advanced liver fibrosis, the performance of CAP is better than US[9]. The AUROCs of US and CAP, respectively,were 58.2% and 82.3% in patients with advanced fibrosis, whereas they were 86.4%and 68.6% in patients without fibrosis. Indeed, liver echogenicity is a reliable US sign for the assessment of steatosis when there is a low prevalence of advanced liver disease in the population being studied[33]. However, this sign is not specific and can be observed in both advanced fibrosis and steatosis, leading to a decrease of US diagnostic accuracy in some cases. On the contrary, by using liver histology as the reference standard, it has been shown that the CAP values are not influenced by liver fibrosis and cirrhosis[24,25,34].
The increasing incidence of NAFLD in children, mainly explained by the sedentary lifestyles and the hyper-caloric diets, is worrisome. B-mode US is the most widely used imaging technique for screening purposes but it lacks sensitivity for the detection of low amount of fat in the liver. Using the imperfect gold standard methodology, a study in 305 children assessed that both CAP and US had a specificity above 90% for the diagnosis of steatosis, but CAP showed a higher sensitivity (72%vs46%)[35]. Moreover, children with liver steatosis had liver stiffness values significantly higher (by some 0.5 kPa) than children without steatosis. Although this increase is not relevant from a clinical point of view, it should be emphasized that steatosis is not always a benign condition, since patients with NAFLD are at risk of NASH with its consequences. Indeed, 15% of children with NAFLD have advanced fibrosis (F3) at diagnosis and the disease in children seems to be more severe than in adults[36].Therefore, an early diagnosis is of great value in the management of children with NAFLD. The guidelines issued by the Expert Committee on NAFLD and the North American Society of Pediatric Gastroenterology, Hepatology and Nutrition recommend that the best screening test to detect NAFLD in children is alanine aminotransferase (ALT) whereas B-mode US is not recommended due to inadequate sensitivity and specificity[36].
Studies on the inter-observer concordance in the CAP measurements have shown that the mean difference in CAP values between two observers is up to 20 dB/m[22,37].Hence, in the follow-up of patients, this difference should be taken into account[38]. In the update of the guidelines on liver elastography of the World Federation of Ultrasound in Medicine and Biology (WFUMB) a paragraph is dedicated to the assessment of liver steatosis because this is a very hot topic due to the rising prevalence of NAFLD worldwide. At the time of the update, only studies performed with CAP were available in the literature. The guidelines acknowledged that CAP is a point-of-care technique for the detection of liver steatosis, even though there is a large overlap between adjacent grades and cut-offs vary between studies[39].
Quantification of US attenuation with imaging systems
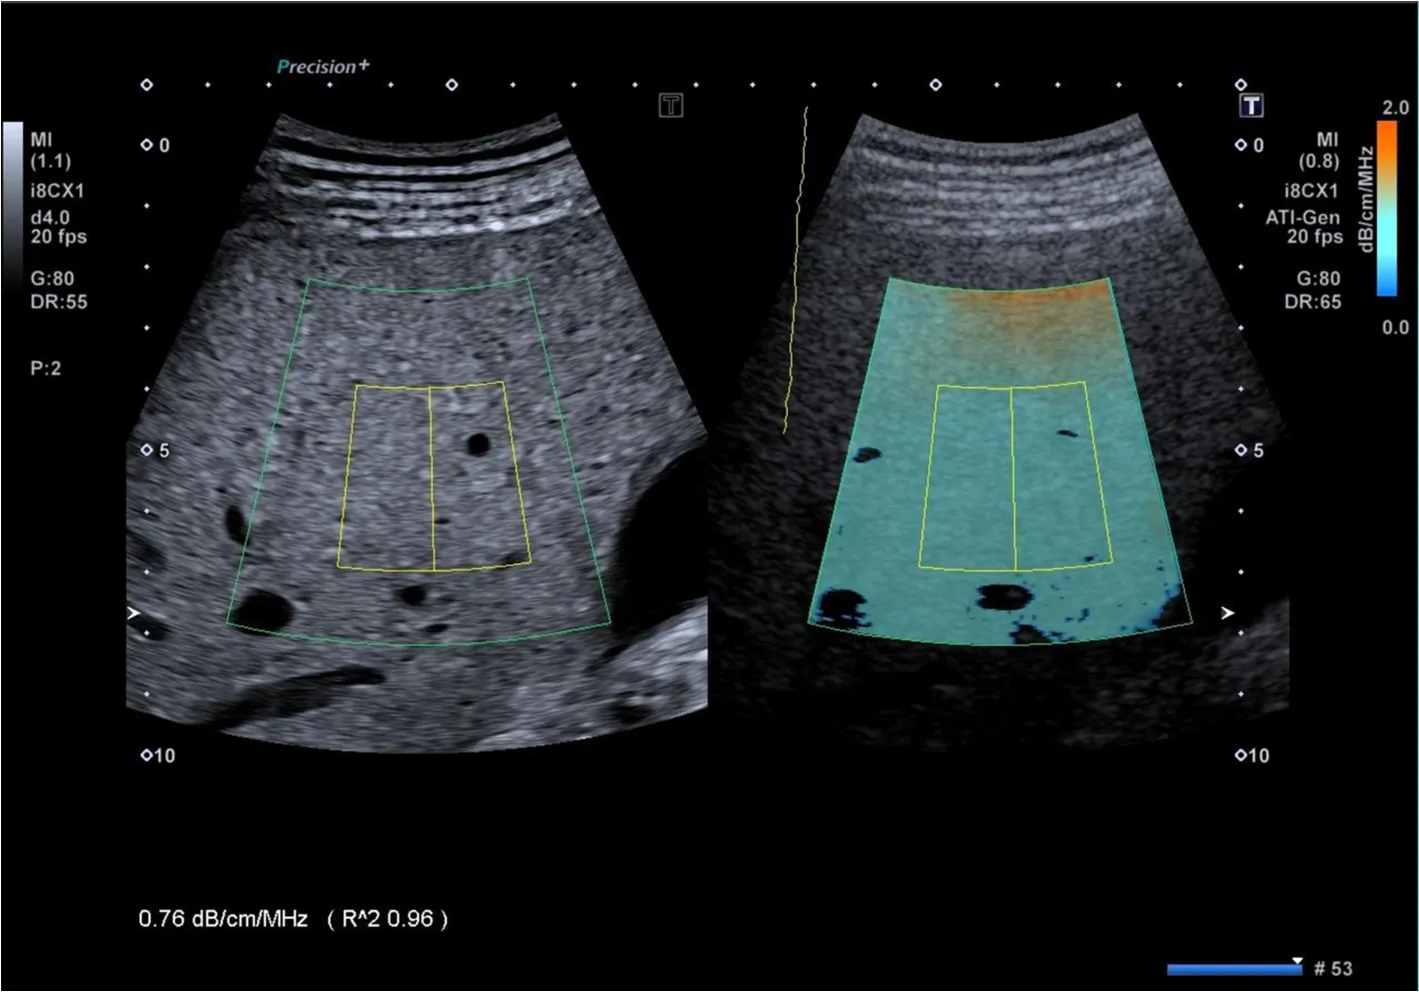
Several US manufacturers are developing or have already developed software for quantifying the attenuation of the US beam. In the literature there are studies performed using the proprietary technology of Canon Medical Systems (Tochigi,Japan), GE Healthcare (Wauwatosa, WI, United States) and Hitachi Ltd. (Tokyo,Japan). Attenuation imaging (ATI®) is the technique developed by Canon and implemented in the Aplio i800 US systems (Figure 1). Like CAP, ATI quantifies the attenuation of the US beam. However, CAP hasn't a B-mode guidance for choosing the area of measurement. With ATI, the attenuation is quantified and shown in a large area using a real-time color-coded map. The RF data of the backscattered US signals are used; therefore, the measurement is not affected by the post-processing of the acquired data or by the settings of the US system. The attenuation coefficient is calculated in decibel per centimeter per megahertz (dB/cm/MHz). Vessels or strong artifacts are automatically filtered out.
An excellent intra-observer and inter-observer agreement, ranging from 0.91 to 0.98, has been reported[40]. In a study performed on 114 consecutive adult subjects potentially at risk of steatosis and 15 healthy controls, ATI results were compared to that obtained with CAP using MRI-PDFF as the reference standard[40]. ATI showed a correlation with MRI-PDFF higher (r= 0.81) than that of the CAP (r= 0.65). AUROCs of ATI and CAP, respectively, were 0.91 and 0.85 for detecting S > 0 (MRI-PDFF ≥ 5%);0.95 and 0.88 for detecting S > 1 (MRI-PDFF ≥ 16.3%). The cutoffs of ATI were 0.63 dB/cm/MHz for detecting S > 0 liver steatosis, and 0.72 dB/cm/MHz for detecting S> 1. ATI was more accurate than CAP, and this difference reached a statistical significance for S > 1 (P= 0.04). In this cohort there was a high prevalence of no fibrosis/mild fibrosis; therefore, it was not explored whether significant fibrosis could affect the accuracy of the ATI technique. Using liver histology as the reference standard in a series in which 33.6% of the 108 subjects were in stage F2 or higher, it has been reported that the degree of steatosis was the only significant determinant factor for the ATI results and the AUROCs ranged from 0.84 to 0.93[41].
The quantification of liver steatosis by means of an attenuation coefficient (in dB/cm/MHz) is available also on the US systems of General Electric (GE) company. It has been named ultrasound-guided attenuation parameter (UGAP)[42]. The attenuation coefficient is calculated in a region of interest that has a length of 65mm and is positioned at least 20mm below the Glisson's capsule. The performance of the technique has been assessed in a series of 163 patients who underwent UGAP, CAP,and liver biopsy on the same day[42]. Significant correlations were found between UGAP and the percentage of steatosis. The AUROCs of UGAP for grading steatosis were 0.90 or higher and they were significantly better than that obtained with CAP for identifying steatosis ≥ S2 and ≥ S3. In another study that enrolled 126 patients with chronic liver disease, the correlation of UGAP with MRI-PDFF was 0.75[43].
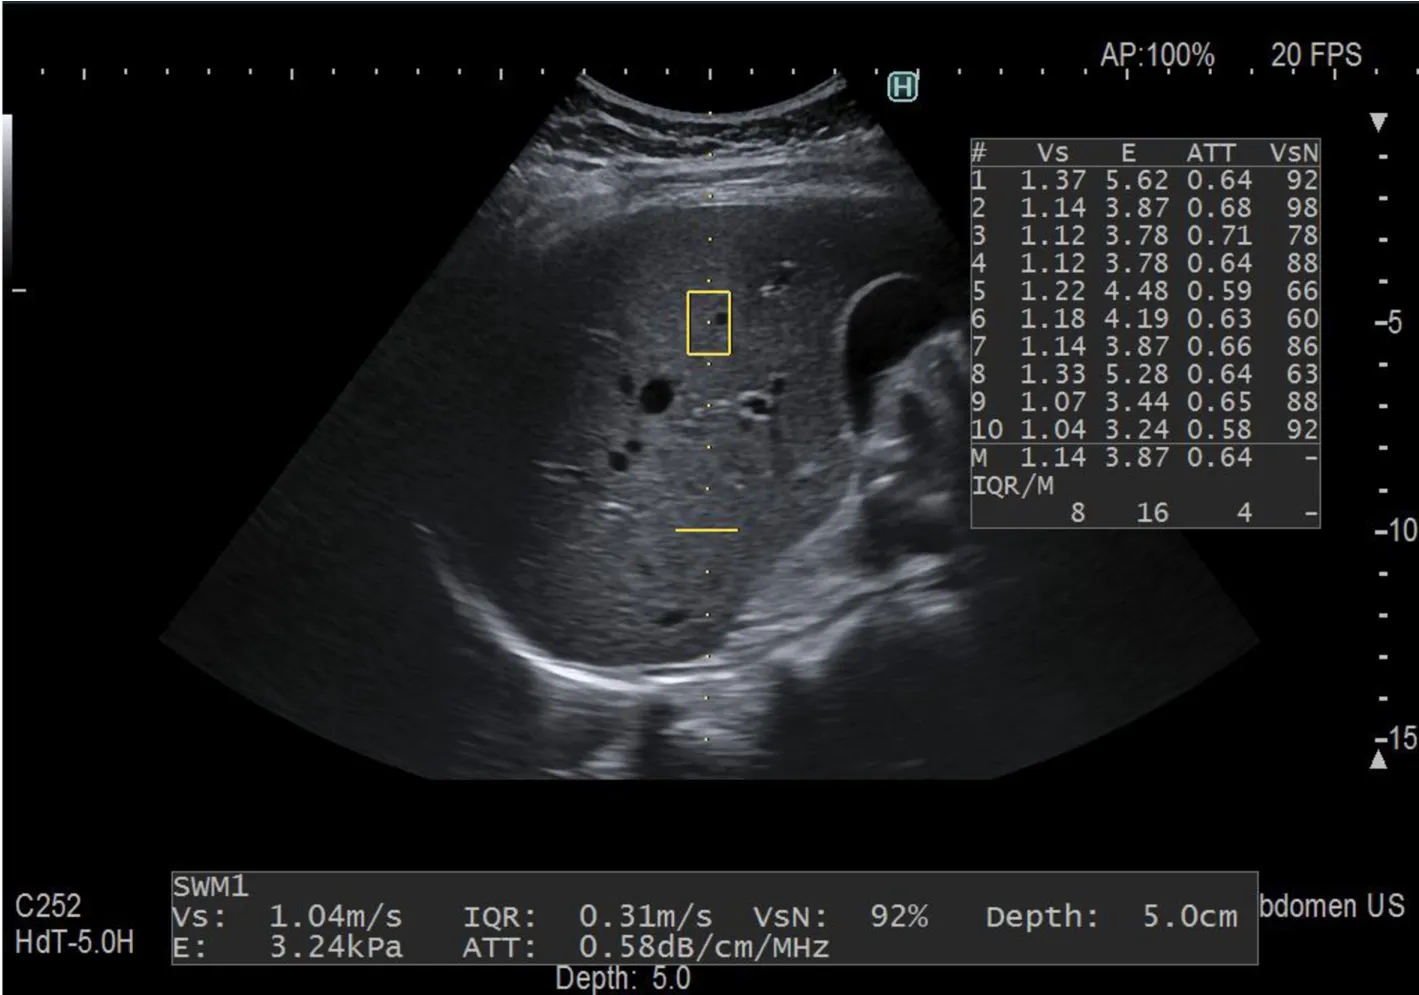
Attenuation (ATT®) is the technique developed by Hitachi Ltd. Company (Figure 2). It estimates the attenuation coefficient (in dB/cm/MHz) by calculating the amplitude difference of the RF signals in two frequencies and determining the slope of the graph. In a series of 351 patients, there was a moderate correlation of ATT with the fat area (r= 0.50) and the AUROCs for mild steatosis (S ≥ 1), significant steatosis (S≥ 2), and severe steatosis (S ≥ 3) were 0.79, 0.87, and 0.96, respectively[44].
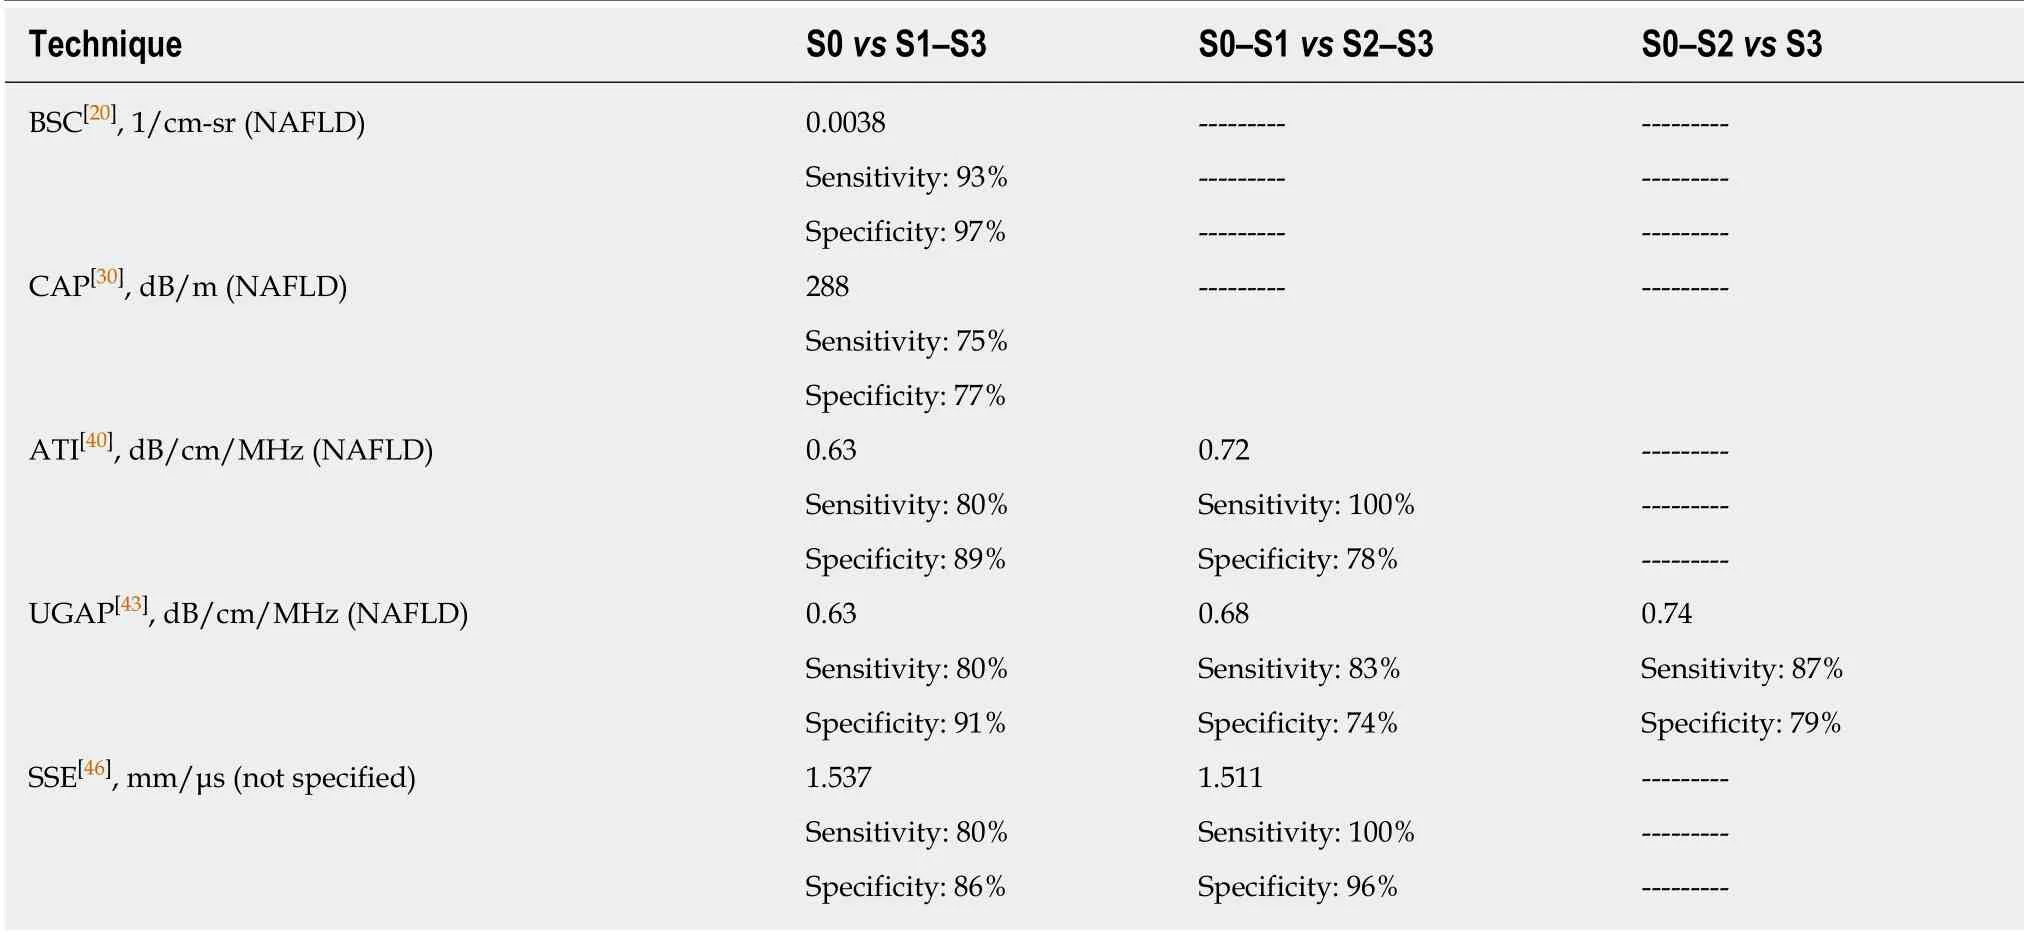
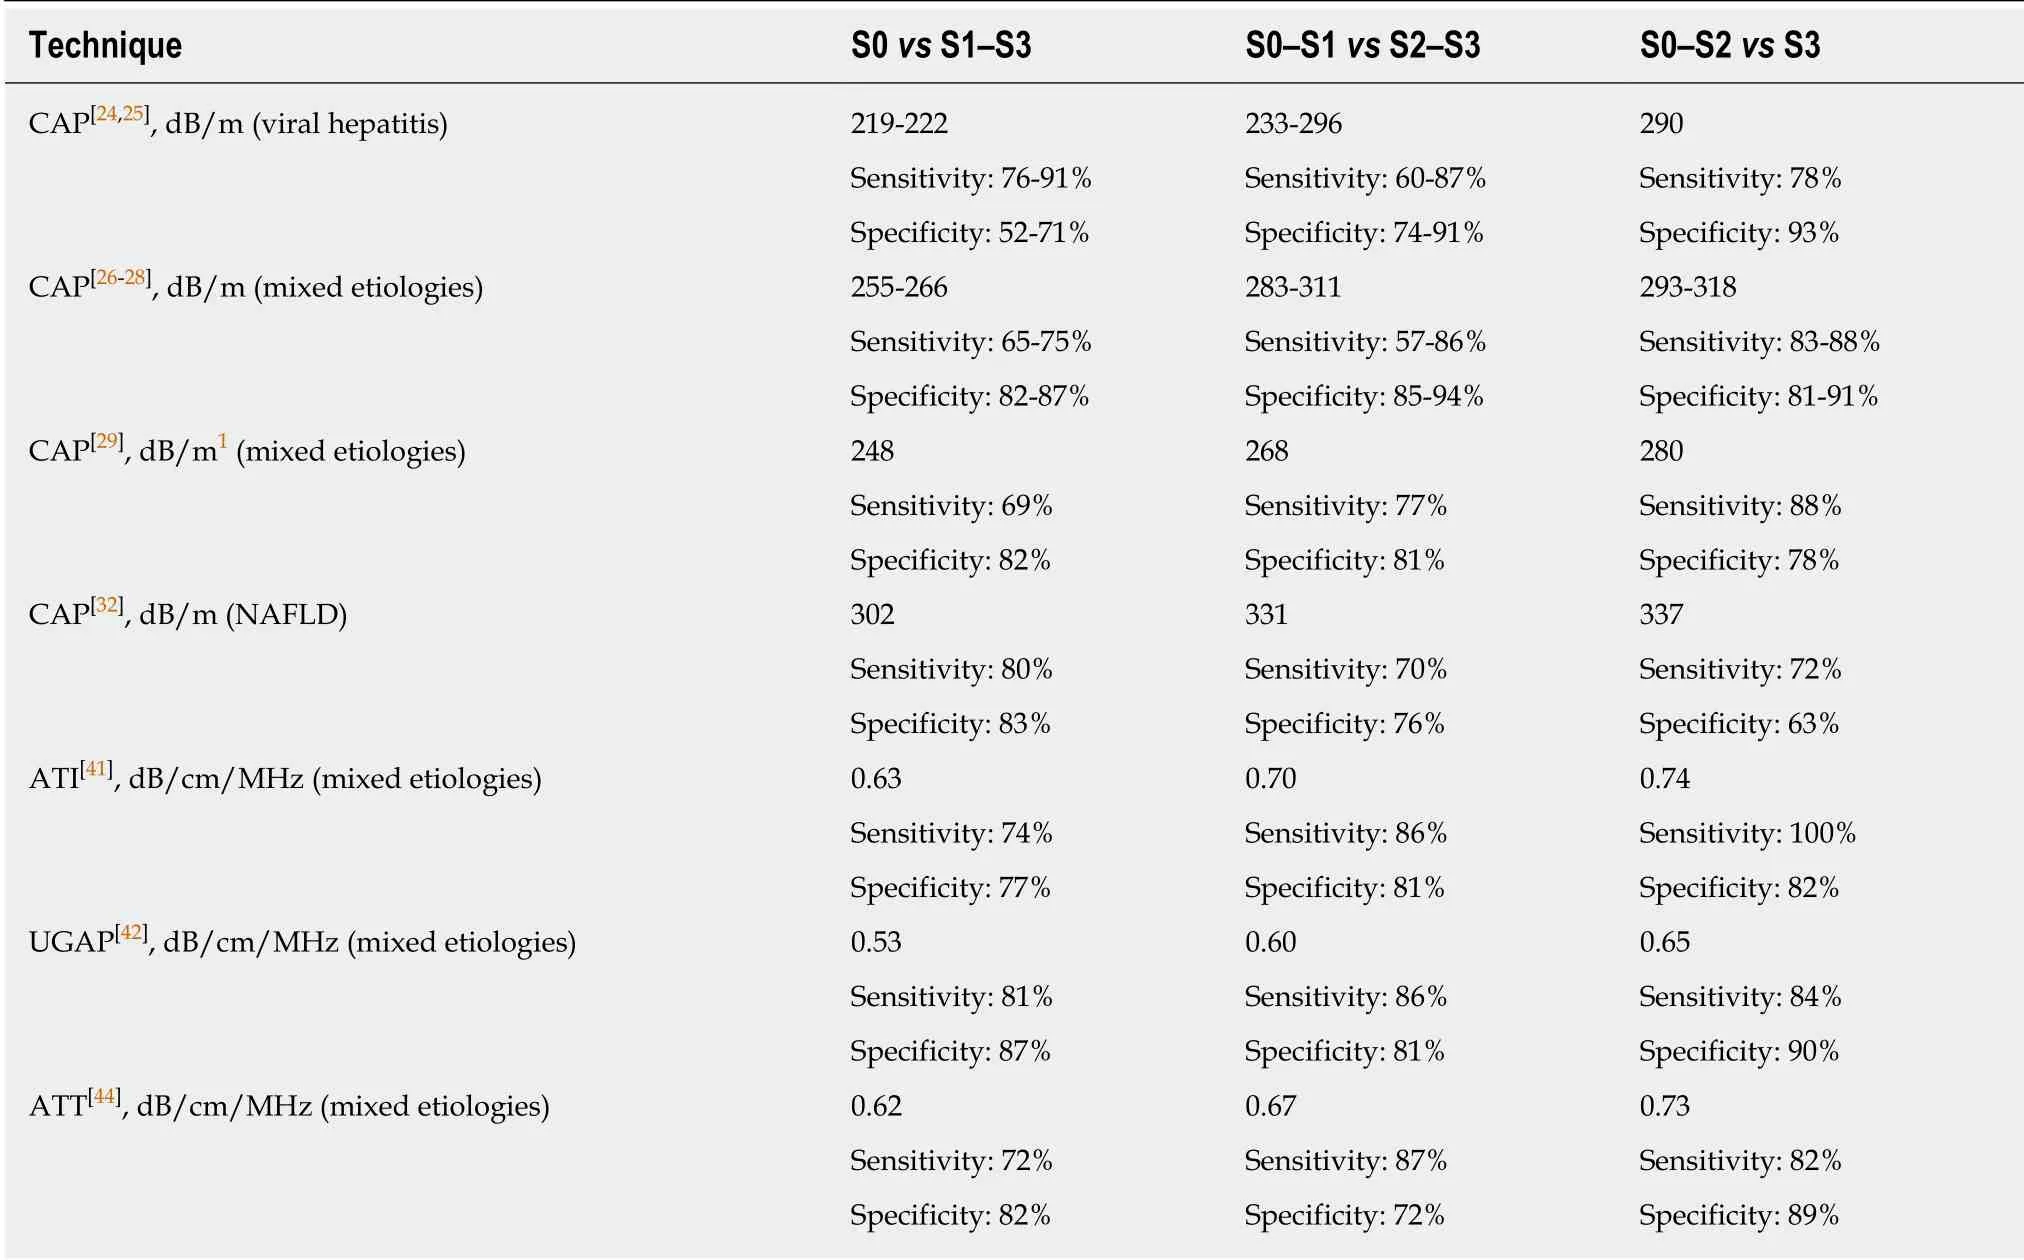
Table 1 and Table 2 report the published cutoffs, together with sensitivities and specificities, of the CAP and of the other new techniques available for the quantification of liver steatosis.
Speed of sound estimation
An increase of fat in the liver causes a decrease in the speed of the sound. A method able to compute the sound speed in the liver has been developed and assessed in a proof of concept study[45]. The ability of the sound speed estimation (SSE) technique for detecting and grading liver steatosis, using MRI-PDFF as the reference standard,has been assessed in a small pilot study that included 100 patients divided in a training cohort and a validation cohort[46]. The Aixplorer®US system (Supersonic Imagine, Aix-en-Provence, France) was used. The repeatability of the technique was excellent, with an intraclass correlation coefficient of 0.93. An SSE cutoff ≤ 1.537 mm/μs showed 80% sensitivity and 85.7% specificity in detecting steatosis (S1-S3). In a multivariable regression analysis, only MRI-PDFF and BMI were associated with SSE values. To confirm these preliminary results, further studies in larger series of NAFLD patients are awaited.

Figure 1 lntercostal scan of the right lobe of the liver, obtained with the Aplio i800 ultrasound system equipped with the ATl® technique. The color-coded map, which is overlaid on the B-mode image, and the B-mode image without colors are shown side-by-side on the monitor of the ultrasound system. The inner rectangle is the fixed measurement box. The reliability of the result is displayed by the R2 value.
CONCLUSION
An early and accurate detection of liver steatosis is of great interest because NAFLD is associated with several metabolic comorbidities that are the risk factors for cardiovascular diseases, and may progress to NASH. Today, for the quantification of liver steatosis with US, several techniques are available. CAP is available since almost a decade. Several studies have shown its accuracy for the grading of liver steatosis and it has become a point-of-care technique. Preliminary results from two studies performed in small series of subjects show that the quantification tools available on ultrasound systems seem more accurate than CAP. On the other hand, the US systems are widely used for the screening of liver disease and they allow a thorough evaluation of the liver, whereas the assessment with CAP needs a dedicated device that gives only information about steatosis and fibrosis.

Table 1 Quantitative ultrasound: Optimal cutoffs obtained using proton density fat fraction with magnetic resonance imaging as the reference standard

Table 2 Quantitative ultrasound: Optimal cutoffs obtained using liver biopsy as the reference standard

Figure 2 lntercostal scan of the right lobe of the liver, obtained with the Arietta 850 ultrasound system equipped with the ATT® technique. The attenuation coefficient is calculated along the dotted yellow line and together with the assessment of liver stiffness. The maximum depth of ATT measurement is indicated by the horizontal continuous yellow line. The measurements are automatically displayed on the right side of the image on the monitor of the US system.
杂志排行
World Journal of Gastroenterology的其它文章
- Role of liver biopsy in hepatocellular carcinoma
- lnsulin-like growth factor 2 mRNA-binding protein 1 promotes cell proliferation via activation of AKT and is directly targeted by microRNA-494 in pancreatic cancer
- Nucleus tractus solitarius mediates hyperalgesia induced by chronic pancreatitis in rats
- Sustained virologic response to direct-acting antiviral agents predicts better outcomes in hepatitis C virus-infected patients: A retrospective study
- Endoscopic retrograde cholangiopancreatography in children with symptomatic pancreaticobiliary maljunction: A retrospective multicenter study
- Apparent diffusion coefficient-based histogram analysis differentiates histological subtypes of periampullary adenocarcinoma
