Groundwater Nitrate Contamination and Driving Forces from Intensive Cropland in the North China Plain
2019-10-24JingLIUChengjunZHANGPengLIShunjiangLIMaotingMAGuoyinZHANG2XianbiaoGAO3ChanglinKOU4LihuaJIANG5TongkeZHAO
Jing LIU, Chengjun ZHANG, Peng LI, Shunjiang LI, Maoting MA, Guoyin ZHANG2, Xianbiao GAO3, Changlin KOU4, Lihua JIANG5, Tongke ZHAO
1. Institute of Plant Nutrition and Resources, Beijing Academy of Agricultural and Forestry Sciences, Beijing 100091, China; 2. Institute of Agricultural Resources and Environment Science, Hebei Academy of Agriculture and Forestry Sciences, Shijiazhuang 050051, China; 3. Tianjin Institute of Agricultural Resources and Environment Science, Tianjin 300192, China; 4. Institute of Plant Nutrition and Resources, Henan Academy of Agricultural Sciences, Zhengzhou 450002, China; 5. Institute of Plant Nutrition and Resources, Shandong Academy of Agricultural Sciences, Jinan 250100, China
Abstract High nitrate in groundwater is a serious problem especially in highly active agricultural areas. In this paper, the concentration and spatial distribution of groundwater nitrate in cropland area in the North China Plain were assessed by statistical and geostatistical techniques. Nitrate concentration in groundwater reached a maximum of 526.58 mg/L, and 47.2%, 21.33% and 11.13% of samples had levels in excess of nitrate safety threshold concentration (50 mg/L) in shallow, middle-deep and deep groundwater, respectively. And content significantly decreased with groundwater depth. Groundwater nitrate concentrations under vegetable area are significantly higher than ones under grain and orchard. And there are great differences in spatial distribution of nitrate in the North China Plain and pollution hotspot areas are mainly in Shandong Province. Based on both multiple regressions combined with principal component analysis (PCA), significant variables for nitrate variation in three types of ground water were found: population per unit area, percentage of vegetable area, percentage of grain crop area, livestock per unit area, annual precipitation and annual mean temperature for shallow groundwater; population per unit area and percentage of vegetable area for middle-deep groundwater; percentage of vegetable area, percentage of grain crop area and livestock per unit area for deep groundwater.
Key words Groundwater, Nitrate contamination, Spatial variation, Principal component analysis, Regression analysis
1 Introduction
Groundwater is an important natural resource that provides drinking water supplies for nearly half the population in China and in the whole world as well[1-3]. But this natural resource is susceptible to contamination by various human activities, such as industry, municipal discharges and excessive use of fertilizer in croplands[4-5]. Nitrate occurs naturally in the environment, but its contents in groundwater commonly exceed natural levels, which may produce potential hazards to human health, such as birth defects, digestive cancers and leading to increase in the occurrence of an impairment of immune-system[6-8].

The North China Plain is the most intensive agricultural regions, called as "China’s granary"[23]. Monitoring and understanding trends in groundwater nitrate concentration in this area are necessary and important for determining the effect of agricultural practices on groundwater quality. In 1996, Zhang Weilietal.[24]found nitrate pollution in groundwater caused by agriculture in the North China Plain. Then, many districts have been reported with groundwater nitrate contamination[25-27]. Zhao Tongkeetal.[28]conducted the survey of groundwater nitrate pollution in seven provinces in the North China[28]. However, research on the spatial distribution and influencing factors of nitrate pollution in this area are inadequate. Therefore, this study aimed at the analysis of nitrate pollution situation and probable factors in different groundwater depth, in order to develop suitable agricultural practices to mitigate the groundwater nitrate pollution to a greater extent.
2 Material and methods
2.1 Overview of study areaThe study area (Fig.1) is a three-province and two-municipality area in the North China Plain, including Hebei Province, Henan Province, Shandong Province, Beijing City and Tianjin City. The area is approximately 514 126 km2, with longitude from 110°22′ E to 122°42′ E and latitude from 31°23′ N to 42°39′ N, of which 347 741 km2is used for cropland[29](Fig.1). The mainly grown crops are wheat, maize, greenhouse vegetables, cotton and fruit, of which the wheat-maize rotation, vegetables and orchards account for multitude cultivated area. The temperate, semi-moist, and continental climate in the study area is influenced by the monsoon, with 400-800 mm of annual precipitation, mainly between June and September. The mean temperature is 8-14℃, and the annual accumulated temperature (>0℃) is 3 200-4 500℃[23].

Fig.1 Location of sampling wells in intensive cropland in the region of North China
2.2 Sampling and data collectionAbout 1 111 groundwater samples were collected in 2002, including 343 in Beijing, 105 in Tianjin, 239 in Hebei province, 206 in Henan and 218 in Shandong (Fig.1). The sampling was conducted in May (before rainy season) and October (after rainy season) for every site, and mainly involving intensive cropland, and grain crop, vegetable crop and orchard. Samples were collected in polyethylene bottles after pumping the wells for about 30 min. The pumping ensured that collected water samples did not come from the water in the storage within the wells. The polyethylene bottles were first rinsed with the water samples to be collected to reduce the probability of contamination. All samples were transported in an ice-cooled cabin to the laboratory and they were stored in a cooler until analysis. Nitrate concentrations of water samples were analyzed in the laboratory using a colorimetric method with an UV-VIS spectrophotometer[30].
During sampling, basic information about well location, groundwater depth, planting pattern and surrounding land-use were collected. According to depth, sampling wells were divided into three types, shallow (0-30 m), middle-deep (30-100 m) and deep (>100 m). Additionally, ten possible variables including per capita agricultural production, livestock per unit area, percentage of grain crop area, percentage of vegetable area, percentage of orchard area, amount of nitrogen fertilizer per unit area, percentage of effective irrigation area, population per unit area and two climate variables (annual mean temperature and precipitation), were assembled at the municipal level from statistical data and literatures[29, 31].

Geostatistical analyses were performed to determine the spatial extent of groundwater nitrate contamination, which were subjected to three stages of analysis: the first involved determining the type of distribution using histogram views and Voronoi maps; the second stage represented fitting the best representative semivariogram model; and the final stage involved the constructing the spatial distribution maps for some variable based on kriging interpolation techniques. We used GS+ software[32]to model experimental semivariograms and ArcGIS Geostatistical Analyst (ESRI version 10.0) to conduct kriging and to map kriging predicted values of nitrate.
Principal component analysis (PCA) was used in this study to transform a number of predictive variables into a small number of artificial variables known as principal components (PC) with a variation reduction technique. The table of rotated principal components loadings was used for confirmation of PC. The ordination diagram also presents the PCA result, in which all of the variables are represented by arrows. A smaller angle between arrows represents a higher correlation between variables, arrow direction represents positive or negative correlation, and arrows length corresponds to variance contribution to PC. The significant factors and the regression model for nitrate variation were then completed by stepwise regression with stepwise Akaike’s Information Criterion (AIC). In analysis, square-root transformation was applied to all data to transform non-normal data to a data set that is reasonably normal. All statistical analyses were conducted using R software (version 3.0.3).
3 Results
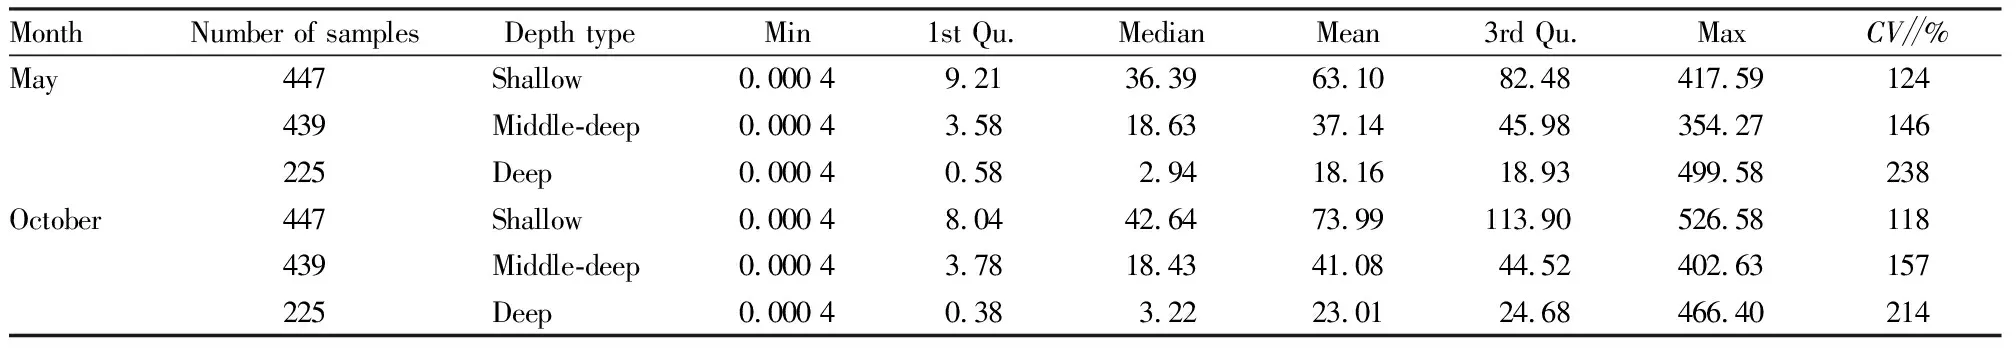
Table 1 Nitrate concentration in water supply wells: descriptive statistical analysis mg/L
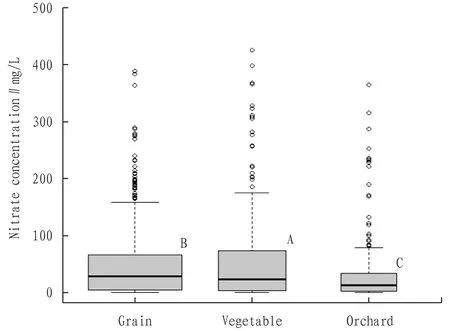
Note: Different letters on the top of boxes represent a significant difference between different cropland use types (P<0.05).
Fig.2 Comparisons of measured groundwater nitrate concentration among different cropland use types in three depths of wells in study area.
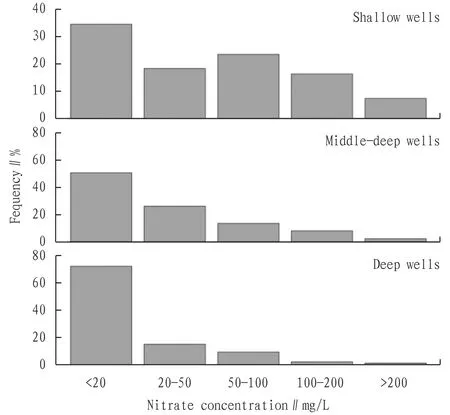
Fig.3 Frequency distribution for nitrate concentration in groundwater samples from the study area
Validation analysis was performed to evaluate the accuracy of the interpolation of the ordinary Kriging. The residual sum of squares (RSS) and the correlation coefficient (r2) were then used to evaluate the performance of the interpolation. Ideally, RSS should be as small as possible, andr2should be close to 1. The result of validation showed that the RSS ranged from 0.096 to 0.421 andr2ranged from 0.229 to 0.341, indicating an accuracy of predictions.


DepthModelNuggetSillNugget/SillRange∥mr2RSSShallowSpherical0.2200.6830.3281 0000.300.179Middle-deepExponential0.0860.6060.1493 0000.300.096DeepSpherical0.0721.0130.0792 0000.340.421

Fig.4 Spatial pattern of estimated groundwater nitrate concentration in shallow, middle-deep and deep wells in the study area
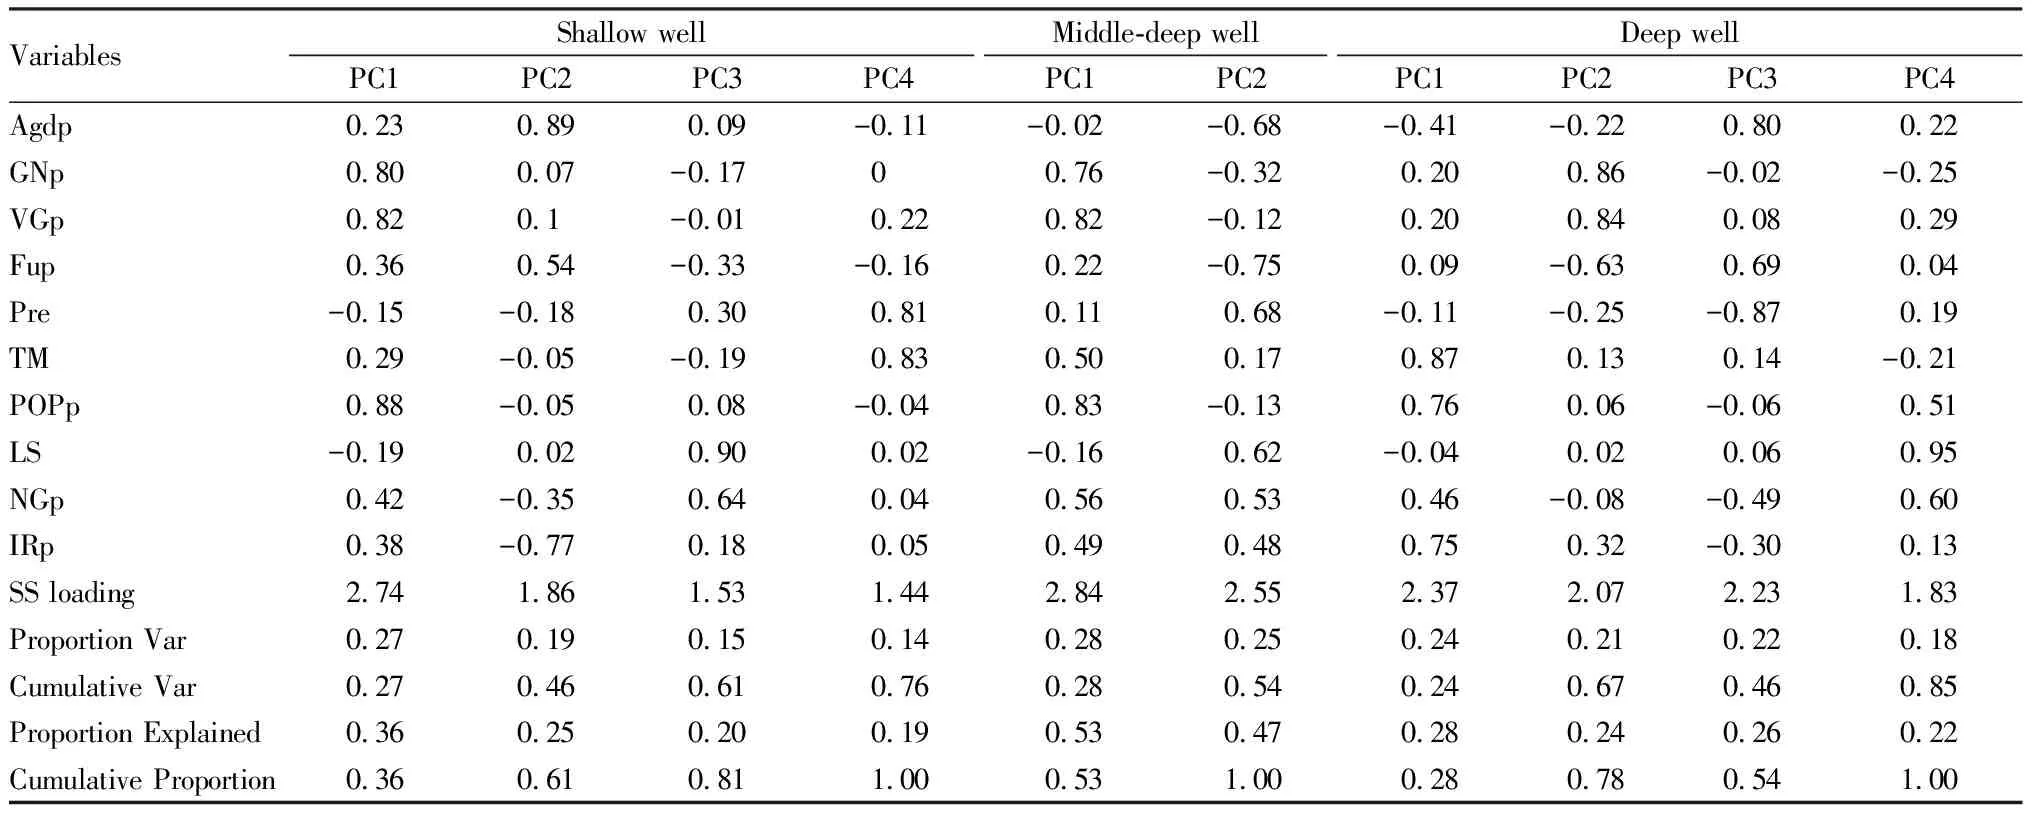
3.3 Analysis on influencing factorsPrincipal component analysis (PCA) of ten variables probably affecting variation of groundwater nitrate in shallow, middle-deep and deep wells was conducted. A data matrix (Table 3) extracts the dominant patterns in terms of a complementary set of score and loading plots. The pattern in three types of wells was different for the principal components. PCA in shallow wells showed the first four PCs explained 76% of the total variance. Among these PCs, the first PCs (PC1) explained 27% of total variance, on which 3 factors, population per unit area (POPp), percentage of vegetable area (VGp) and percentage of grain crop area (GNp) have high loading. The second PCs (PC2), accounting for approximately 19% of the total variation, was loaded heavily with per capita agricultural production (Agdp). The third PCs (PC3) and the forth PCs (PC4) accounted for 15% and 14% of the total variance, with high loading of livestock per unit area (LS), annual precipitation (Pre) and annual mean temperature (TM), respectively. In middle-deep wells, the first two PCs explained 54% of the total variance. PC1 explains 28% of total variance and it loaded heavily on population per unit area (POPp) and percentage of vegetable area (VGp). PC2, accounting for approximately 25% of the total variation, was loaded heavily with high percentage of orchard area (Fup). Additionally, in deep wells, the first four PCs explained 85% of the total variance. PC1 explained 24% of total variance, on which 3 factors, TM, POPp and percentage of irrigation area (IRp) have high loading. PC2, accounting for approximately 18% of the total variation, was loaded heavily with GNp and VGp. PC3, accounting for approximately 22% of the total variation, was loaded heavily with Pre and Fgdp. And PC4 accounted for 18% of the total variation, with high loading on LS.
Table 3 Rotated principal components loadings of ten variables in shallow, middle-deep and deep wells
VariablesShallow wellPC1PC2PC3PC4Middle-deep wellPC1PC2Deep wellPC1PC2PC3PC4Agdp0.230.890.09-0.11-0.02-0.68-0.41-0.220.800.22GNp0.800.07-0.1700.76-0.320.200.86-0.02-0.25VGp0.820.1-0.010.220.82-0.120.200.840.080.29Fup0.360.54-0.33-0.160.22-0.750.09-0.630.690.04Pre-0.15-0.180.300.810.110.68-0.11-0.25-0.870.19TM0.29-0.05-0.190.830.500.170.870.130.14-0.21POPp0.88-0.050.08-0.040.83-0.130.760.06-0.060.51LS-0.190.020.900.02-0.160.62-0.040.020.060.95NGp0.42-0.350.640.040.560.530.46-0.08-0.490.60IRp0.38-0.770.180.050.490.480.750.32-0.300.13SS loading2.741.861.531.442.842.552.372.072.231.83Proportion Var0.270.190.150.140.280.250.240.210.220.18Cumulative Var0.270.460.610.760.280.540.240.670.460.85Proportion Explained0.360.250.200.190.530.470.280.240.260.22Cumulative Proportion0.360.610.811.000.531.000.280.780.541.00
Note: Agdp, the gross agricultural production per capita; GNp, percentage of grain crop area; VGp, percentage of vegetable area; Fup, percentage of orchard area; Pre, annual precipitation; TM, annual mean temperature; POPp, unit-area population; LS, unit-area livestock quantity; NGp, unit-area nitrogen fertilizer; IRp, percentage of irrigation area.
4 Discussions
According to WHO, 47.2%, 21.33% and 11.13% of the groundwater samples have been in excess of nitrate safety threshold concentration (50 mg/L) in shallow, middle-deep and deep wells, which shows nitrate pollution of groundwater in the North China Plain cannot be ignored. Long-term groundwater quality monitoring studies are needed and will provide the critically needed data on changes in ground water quality with different land use management programs and to understand if good agriculture practices are effective in protecting groundwater.
The difference of nitrate concentration before and after the rainy season is consistent with many reports, indicating that large amounts of precipitation can cause rapid infiltration (3.8-5.8 mm/min); accordingly, the contamination or excess fertilizer/manure application might have entered the groundwater via heavy rainfall after the rainy season (from June to August)[34]. CV of nitrate was all beyond 100% in three types of wells. Higher CV means large variation among sampling sites. In deep groundwater, nitrate standard deviation is lower than that in shallow and the middle-deep groundwater, and mean nitrate contents also lower sharply, which leads to a larger CV in deep groundwater.
Difference of groundwater nitrate contamination under cropland use rooted in agriculture management practices such as cropping pattern, fertilizer application and irrigation way[35]. Many reports showed excessive nitrate in groundwater is closely related to vegetation planting, for its higher loads of nitrogen[24, 28, 36-37], which is no exception in this research. Space distribution of nitrate in Fig.3 shows areas in the central and eastern parts of Shandong Province have high nitrate concentration, where vegetable grow widespreadly. Results of multivariate statistical analysis also showed the variable of percentage of vegetable area is significant factor for variation of groundwater nitrate in three types of groundwater. Fig.5 with the first two PC in three types of wells showed many cities, such as Liaocheng, Taian and Zaozhuang in Shandong Province, Kaifeng, Luohe, Shangqiu and Puyang in Henan Province have high ratio of vegetable cultivation area. Especially in shallow wells, the variable of percentage of vegetable area is the main influencing factor for nitrate spatial distribution. The number of significant variables for nitrate variation in shallow groundwater is higher than than that in middle-deep and deep wells, indicating groundwater in shallow wells is more easily affected by the outside.

Gu Baojingetal.[42]reported that amount of nitrate leakage to groundwater was significantly related to population density. This variable also has high loading on the principal components of PCA in shallow and middle-deep wells in this study. Regions in this study are the relative centralization of urban construction and population, and there are significantly differences among cities. Additionally, the effects of natural factors (annual mean temperature and precipitation) on groundwater nitrate variation were different in many reports[41-42]. In this study, variables of TM and Pre significantly affect nitrate content in shallow water, but have little impact in middle-deep and deep wells after multivariate statistics.
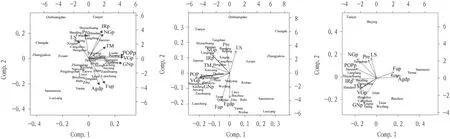
Note: Agdp, the gross agricultural production per capita; LS, unit-area livestock quantity; GNp, percentage of grain crop area; VGp, percentage of vegetable area; Fup, percentage of orchard area; NGp, unit-area nitrogen fertilizer; IRp, percentage of irrigation area; POPp, unit-area population, TM, annual mean temperature; Pre, precipitation.
Fig.5 Principal component analysis (PCA) of variables for groundwater nitrate
5 Conclusions
Based on both multiple regressions combined with principal component analysis (PCA), significant variables for nitrate variation in three types of ground water were found: population per unit area, percentage of vegetable area, percentage of grain crop area, livestock per unit area, annual precipitation and annual mean temperature for shallow groundwater; population per unit area and percentage of vegetable area for middle-deep groundwater; percentage of vegetable area, percentage of grain crop area and livestock per unit area for deep groundwater.
Nitrate contamination in groundwater should be considered in developing and implementing strategies for rural developments. Measures must be taken to alleviate nitrogen pollution, such as changing the cropping pattern, adjusting the irrigation and fertilization programs and applying limited water application and split application of nitrogen fertilizers and reducing pollution from livestock and wastewater discharge. Results in present study may have important implications for regions with similar climate, topography, agriculture model and urbanization in China.
Acknowledgments
Additional support for fieldwork was provided by Hebei Academy of Agricultural Sciences, Shandong Academy of Agricultural Sciences and Henan Academy of Agricultural Sciences.
杂志排行

Asian Agricultural Research的其它文章
- Poverty Alleviation by Helping the Disabled in Impoverished Mountainous Areas of Western China: Taking Luquan Yi and Miao Autonomous County in Yunnan Province as an Example
- Research on Scientifically and Rationally Promoting the Fallow of Cultivated Land under the Strategy of Rural Revitalization
- Study on the Effect of "Crayfish-Rice Continuous Cropping" on Grain Production: A Case Study of Hubei Province
- Integrated Development of Rural Tourism and Rural Poverty Alleviation in the Context of Rural Revitalization: A Case Study of Enshi Prefecture, Hubei Province
- A Preliminary Study on Patent Application and Management of Agricultural Scientific Research Institutions
- Development of Rural E-commerce from the Perspective of Agricultural New Kinetic Energy Cultivation: Based on Survey on the "E-commerce Entering Villages and Households" Project of Jurong City