Effects of granulation process variables on the physical properties of dosage forms by combination of experimental design and principal component analysis
2019-09-11PrkshThpDuHyungChoiMinSooKimSeongHoonJeong
Prksh Thp,Du Hyung Choi,Min Soo Kim,Seong Hoon Jeong,*
aCollege of Pharmacy,Dongguk University,Gyeonggi 10326,Republic of Korea
bDepartment of Pharmaceutical Engineering,Inje University,Gyeongnam 50834,Republic of Korea
cCollege of Pharmacy,Pusan National University,Busan 46241,Republic of Korea
Keywords:Experimental design Principal component analysis High shear granulation Process parameter
ABSTRACT The current study was to understand how process variables of high shear wet granulations affect physical properties of granules and tablets.The knowledge gained was intended to be used for Quality-by-Design based process design and optimization.The variables were selected based on the risk assessment as impeller speed,liquid addition rate,and wet massing time.Formulation compositions were kept constant to minimize their influence on granules properties.Multiple linear regression models were built providing understanding of the impact of each variable on granule hardness,Carr’s index,tablet tensile strength,surface mean diameter of granules,and compression behavior.The experimental results showed that the impact of impeller speed was more dominant compared to wet massing time and water addition rate. The results also revealed that quality of granules and tablets could be optimized by adjusting specific process variables (impeller speed 1193 rpm, water spray rate 3.7 ml/min, and wet massing time 2.84 min). Overall desirability was 0.84 suggesting that the response values were closer to the target one.The SEM image of granules showed that spherical and smooth granules produced at higher impeller speed, whereas rough and irregular shape granules at lower speed.Moreover,multivariate data analysis demonstrated that impeller speed and massing time had strong correlation with the granule and tablet properties.In overall,the combined experimental design and principal component analysis approach allowed to better understand the correlation between process variables and granules and tablet attributes.©2018 Shenyang Pharmaceutical University.Published by Elsevier B.V.This is an open access article under the CC BY-NC-ND license.(http://creativecommons.org/licenses/by-nc-nd/4.0/)
1. Introduction
Granulation has long been considered as a pharmaceutical process of particle design where fine particles are changed to larger ones as granules or agglomerates [1]. Main objectives of the process include: reduce dustiness,improve flowability,improve density of materials, minimize tablet weight variation, and improve dissolution rate [1-3]. Among the granulation techniques,wet granulation method can be the most popular one. Especially, high shear granulation is still the most commonly used in pharmaceutical industry as it offers several advantages over the other methods such as short processing time, uniform size distribution of granules with reproducibility, and dense granules suitable for tableting [4].However, process understanding of high shear wet granulation is crucial to obtain desirable granule quality and tablet properties, because wet granulation process is complicated and multivariate by nature. The scientific understanding of multi-factorial relationships between formulation, process,and granules properties may require the use of multivariate approach such as statistical experimental design, optimization and multivariate data analysis. The combination of design of experiment(DoE)and multivariate data analysis could generate more comprehensive information on the granules attributes.
Impeller speed is one of the process variables in high shear granulation. The main function of impeller is to agitate the powder bed and to get uniform distribution of binding solution. Selection of optimum impeller speed might be critical to obtain granules with desirable physical properties as insufficient impeller speed leads to uneven distribution of binding agent resulting in uncontrolled granule growth.Similarly,wet massing time also has crucial role to control properties of granules and tablets. Longer massing time could generate granules with higher density and strong granules[1,3,5-7].Hard granules might reduce the disintegration and dissolution time of tablet.
Liquid to solid ratio (L/S) i.e. quantity of granulating liquid used in granulation is an important variable that could affect the granule properties in high shear granulation. Agglomeration increases with increase in liquid binder, which is enhanced by continuous addition of the liquid in the process[8-11].Inadequate amount of liquid binder or water gives weak,fragile granules with high percentage of fines,whereas excess water results in over-wetting forming hard,dense,and uncontrolled granule growth[1,12].The amount of water used in granulation is mainly dependent on the drug and excipients properties(solubility,water uptake capacity)and its composition in formulation. The amount of water can be optimized by observing the change in power consumption or change in torque profile,which has been proven to be a reliable control method because of its correlation with the different stages of wet massing time [13]. Likewise, liquid addition rate governs the granules growth rate.Therefore,it could provide the potential impact on granule and tablet properties. Previous studies showed that liquid binder addition rate was inversely related to onset of nucleation stage and operation time [14].Those factors need to be optimized together to obtain desirable granules.
Even though several studies have described the impact of granulation process parameters on granule size distribution,granules density,and flowability [1,3,14-17], no systematic investigation has yet been reported how these variables influence the granule hardness and compression properties of granules. Granule hardness could be one of the important properties in tablet formulation because granules having insufficient hardness are extremely fragile leading to compromise on quality. On the other hand, if the granules are extremely hard, this may compromise the compressibility.Meanwhile, compression behavior of granules might be altered by process variables.However,detailed studies are very limited how process variables influence the compression behavior of granules. Heckle plot analysis can be commonly used for the analysis of compression behavior of pharmaceutical excipients.Therefore,one of the objectives of the present study was to investigate the impact of process variables on granule hardness and compression behavior of granules.
Quality by design (QbD) is a systematic, efficient, riskcontrolled and knowledge based method in order to improve the pharmaceutical process development and eventually improve the product quality[18-20].Initial RA(risk assessment)helps to find the critical process parameters (CPPs) or critical material attributes (CMAs) [21]. Moreover, it allows time efficient and cost-effective process and narrow down gap between science and industry by applying DoE.The DoE statistical tools are intended to understand the interaction among complex process parameters.An empirical model was generated to predict the effect of independent variable on the responses. The main objective of present study was to understand the impact of granulation process parameters;impeller speed, wet massing time, and liquid addition rate, and their interaction on the physical properties of granules and tablets by combination of experimental design and multivariate data analysis.Granulation process parameters were also optimized to obtain desired granules and tablet properties.Finally,optimized process parameters were utilized to design sildenafil immediate release tablet.
2. Materials and methods
2.1. Materials
Sildenafil citrate (SC) was kindly supplied from Daewoong Pharmaceuticals (Seoul, Korea). Lactose monohydrate (LM,Pharmatose 200 M) and croscarmellose sodium (Premellose)were supplied from DFE pharma (Goch, Germany). Microcrystalline cellulose (MCC, Heweton 102) was obtained from JRS Pharma GmbH & Co.(Rosenberg,Germany) and polyvinyl pyrrolidone (Povidone K30, Kollidon®30) was obtained from BASF(Ludwigshafen,Germany).
2.2. Experimental design
Design-Expert®software was used for the experimental design (version 10; Stat-Ease, Inc., MN, USA). Based on the preliminary studies, three factors were chosen as independent variables (impeller speed (x1), water spray rate (x2), and wet massing time (x3). The effects of these factors on the physi-cal properties of granules were evaluated at three levels.The experimental matrix for the experimental runs is provided in Table 1. The granule strength (y1), Carr’s index (y2), granule density (y3),surface mean diameter (y4),compression behavior(Heckel constant,y5),and tablet tensile strength(y6),were selected as dependent variables.Analysis of variance(ANOVA)was performed to determine the significance of each factor and their mutual interactions on response variables.The bestfit mathematical model was selected based on the comparison of several statistical parameters, including the multiple correlation coefficient (R2) and adjusted multiple correlation coefficient(adjusted R2).The 3-D response surface plots were generated using the same software.

Table 1-Experimental design of wet granulation parameters with three input control factors and values of the dependent variables for different process parameters.
The empirical models were constructed by fitting the data based on statistical analyses.The optimized formulation was identified by means of the simultaneous optimization.In the method, an individual desirability function (di) is generated by converting each response,which can be varied across the range 0 <di<1. Consequently, the design variables are selected to maximize overall desirability,as shown in equation below.

where D is overall desirability,diis individual desirability,and m is the number of responses.
2.3. Preparation of granules
High shear wet granulation was carried out using a Mi-Pro(ProCepT, Zelzate, Belgium) having the capacity of 0.9 l Prior to the granulation, all the excipients were sieved through 30 mesh size, transferred into a granulation bowl, and then premixed for 5 min at the impeller speed of 200 rpm.This was followed by the addition of water using peristaltic pump.Liquid to solid ratio was 33% (w/w, water was added to powder mixture).This value was set based on the preliminary study.Formulation composition without the drug consisted of commonly used excipient including LM 62.5% (w/w), MCC 30%(w/w), croscarmellose sodium 5% (w/w), and povidone K30 2.5% (w/w).The batch size of each study was 120 g.Likewise,SC tablet formulation composed of SC 7.15%(w/w),LM 55.35%(w/w),MCC 30% (w/w),croscarmellose sodium 5% (w/w),and povidone K30 2.5% (w/w). The processing parameters (impeller speed,liquid addition rate,and wet massing time)were set accordingly as shown in Table 1. The wet granules were dried in an oven at 45°C for 5 h and moisture content was analyzed using a moisture analyzer(Sartorius AG,Germany).The percent moisture content was calculated using equation below.

where Wiand Wfare the initial and final weight of the granules,respectively.
2.4. Evaluation of granule properties
The particle size distribution of granules was determined by laser diffraction to avoid granule breakage during sieving and shaking process. For each experimental run, 5 g sample was measured using HELOS particle size analyser (Clausthal Zellerfeld,Germany).The mean surface diameter of granules was determined in triplicates for each experimental run.
The bulk and tap density of the granules were determined using an Erweka SVM 122 tapped density tester (ERWEKA GmbH., Heusenstamm, Germany). Bulk density was determined after filling granules in a 100 ml glass cylinder. The tap density was determined after 1250 taps(constant level of granules in cylinder).Each analysis was repeated three times.The increase in bulk density of powder is related to the cohesiveness of the granules.The Carr’s Index (CI) values provide information about flowability of granules. The CI was determined using equation below.

where, ρBis bulk and ρTis tap density of granules. CI value above 25 indicates poor flowability whereas CI value below 10 indicates excellent flowability.CI decreases with decreases in difference between bulk and tapped density.
The granule true density was determined using a helium pycnometer(AccuPyc 1330;Micrometrics instruments Co.,GA,USA).The accuracy of the pycnometer was evaluated using a standard steel sphere before measurement.The experimental sample was accurately weighed and loaded into the sample cell.Sample volume was calculated by measuring pressure by filling the sample chamber with high purity helium gas followed by discharging the gas into a second empty chamber.The measurements were repeated for five cycles.
Granule strength test was carried out using a Texture Analyser (TA XT plus, Stable MicroSystems, UK) equipped with a 5 kg load cell. The granules of size 600-710 μm was selected.Individual dry granule was compressed with a stainless steel probe with a diameter of 9 mm.In order to obtain statistically reliable results,a sufficiently large number of granules(at least 30 granules)were tested per each experiment.
2.5. Scanning electron microscope
A scanning electron microscope(SEM)(Model EM-30,COXEM,Korea) was used to characterize the morphology of granules produced at impeller speed of 500, 900, and 1300 rpm. The samples were coated with gold under vacuum in an argon atmosphere prior to observation. The SEM images of the samples were taken at an acceleration voltage of 20 kV at different magnifications.
2.6. Tablet preparation
Prepared granules (350 mg) were weighed, filled into a die of 9 mm internal diameter, and compressed on a single punch Carver Laboratory Press(Carver Inc.,Wabash,IN,USA)at compression pressure of 300 MPa.Before each compaction,die wall was dusted by magnesium stearate using a brush.Each compact was weighed accurately and its dimension and thickness were measured using a digital slide caliper(Mitutoyo Co.,Kawasaki,Japan)(n=10).
2.7. Measurement of tablet tensile strength
The tablet crushing strength was determined by compressing a compact diametrically on Erweka hardness tester at the speed of 0.5 mm/s.(Erweka TBH 125,Heusenstamm,Germany).The radial tensile strength of the compact was calculated from the crushing strength and thickness in accordance with the Fell and Newton’s method [22], in which the radial tensile strength σxis given in equation below as follows:

where σxis the tensile strength[23],x is the force required to cause failure in tension (N),d is the diameter of the compact(mm),and t is the thickness of the compact(mm).The use of tensile strength allows the dimensions of the compact to be taken into account.The force leading to failure in tension was used for the calculation of tensile strength.
2.8. In vitro dissolution studies
In vitro dissolution studies of sildenafil citrate from tablets of optimized process parameters was carried out in the USP apparatus I (Varian 705DS, Varian, Cary, NC, USA). The release profiles of tablet containing 50 mg of sildenafil citrate was determined in 500 ml of simulated gastric fluid (pH 1.2) at a rotating speed of 75 rpm at 37±0.5 °C.The mean of four determinations were used to calculate the drug release for each experiment. The studies were carried out for 30 min during which 3 ml of aliquot of the release medium was withdrawn at different time intervals and replaced with an equal volume of fresh medium.The samples were filtered through 0.45 μm membrane filter.The filtrate was suitably diluted with distilled water and assayed for the drug spectrophotometrically(OPTIZEN POP UV/Visible spectrophotometer,Mecasys Co.Ltd.,Korea)at the wavelength of 292 nm.
2.9. Compression behavior using Heckel and Kawakita analysis
Heckel equation is one of the most commonly used mathematical models for the pharmaceutical compaction [24].The basis of the mathematical relationship for powder compression is that densification of the bulk powder under force follows first-order kinetics.The Heckel equation is described as following:
where D is the relative density of a powder compact at pressure P and k is a slope of straight line portion of Heckel plot.Constant A is related to the die filling and particle rearrangement before deformation and bonding of the discrete particles.The Heckel plot allows an interpretation of the consolidation mechanisms and a measure of the yield pressure of the powders.
Kawakita equation is used to express compaction behavior of powder.It is based on the assumption that the particles subjected to compressive load are in equilibrium at all stages of compression[25].The Kawakita equation is:

where C is the relative reduction in volume by the compression,P is applied pressure and a is initial porosity.The parameter b is proposed to be inversely related to the yield strength and plasticity of the material.

Table 2.-Initial risk assessment of process variables of high shear granulation on granules attributes based on published literature,prior knowledge,and experience.
3. Results and discussion
3.1. Initial risk assessment
International council for harmonization (ICH) Q8 (R2) described quality target product profiles(QTPP)as essential elements of QbD approach [26-28]. The effect of CPPs on CQAs should be defined early in process development of pharmaceutical dosage form. To identify the effects of granulation process variables on CQAs (granules and tablet attributes), the initial risk assessment was conducted. For the initial assessment, granules hardness, Carr’s Index, SMD of granules, Heckel plot constant, true density of granules and tablet tensile strength were identified as subset of CQAs that have potential to be altered by granulation process parameters and should be discussed in detail in subsequent process development studies. The initial risk assessment was based on screening experiments, prior knowledge, and experience and information about high shear granulation from published literature. For initial risk assessments, quantitative risk priority numbers were mapped onto three categories (high, medium, and low), as shown in Table 2. The high risk process variables should be investigated and discussed in detail whereas low risk variables require limited investigation.
3.2. Evaluation of impeller torque profiles
The amount of water as a liquid binder is critical for the wet granulation process because excessive water might result in over-wetting, which was characterized by initial sharp rise of torque and then dropped significantly as the wet granules converted to slurry. On the other hand, inadequate water may generate weak granules[29].In order to find optimum amount of binding solution,impeller torque consumption of wet mixture has been reported [5]. An impeller torque profile was monitored while recording real time with 1 s interval.Fig.1 shows the torque profiles of the experimental runs during the granulation(Table 1)as a function of water addition.In the initial stage of process,the impeller torque increased almost proportionally with the increase in impeller speed.And then,the impeller torque was gradually increased with the increase in liquid/solid ratio(L/S ratio)indicating onset of powder wetting and nuclei formation [5]. Moreover, the pattern of impeller torque profiles showed that the torque value increased linearly with increase in water addition rate. However, after adding certain amount of water, impeller torque remained almost constant forming a plateau suggesting saturation phase. This point was considered as an optimum of water requirement for the granulation.
The hygroscopic nature of excipients might have impact on the granulation process.Lactose monohydrate has high wettability(aqueous solubility about 16 g/100 ml)[30].The lactose monohydrate constituted 62.5% of the formulation, which might cause rapid onset of nucleation and granule growth.Based on the preliminary study,the 33%(w/w)of liquid to solid ratio(L/S)was used for the study(Box-Behnken design experimental runs).Moisture contents of the dry granules were in the range of 1.50%-2.15%.
3.3. Experimental design and fitted models

Fig.1.-Impeller torque profiles plotted versus liquid to solid ratio during the high shear granulation.
A Box-Behnken design (BBD) of three factors with three levels was used to investigate the effect of the independent variables on the dependent variables. Impeller speed (x1), spray rate(water addition rate)(x2),and wet massing time(x3)were chosen as independent variables based on initial risk assessment.The granule strength(y1),Carr’s index(y2),tablet tensile strength(y3),and surface mean diameter(y4)were selected as dependent variables. The experimental matrix for the 15 experiments is presented in Table 1.The mathematical response surface models were generated by statistical analysis with the Design-Expert®software by applying coded values of factor levels.The random behavior of the residuals was studied with the residual analysis, and normal probability plots were obtained for residual errors of the response variables(Fig.2).The plots appeared to be normally distributed and showed straight lines; outlier points were not observed. The values of the coefficients x1,x2,and x3were related to the effects of these variables on the response.A positive coefficient represents a synergistic effect,whereas a negative coefficient indicates an opposite effect on the response; moreover, a greater coefficient indicates that the independent variable has a stronger effect on the response[31-33].
3.3.1. Effect of control factors on granule strength(y1)
Granules should bear sufficient strength to survive stringent forces that they experience during post granulation process(drying and compression). Weak granules are too fragile and might convert into fines which could lead to issues of tablet weight variation and content uniformity.Conversely,too hard granules might lose the compactability leading to low tablet hardness. Granules strength of different experimental runs ranged from 0.75 N to 4.17 N.Fig.2A showed the residual plot of granule hardness, which showed that the experimental data and predicted values of granules hardness were well fitted.A regression analysis of control factors affecting the granule hardness was used to generate the empirical model described in equation below.

As shown in Table 3, value P <0.05 for any factors in the ANOVA indicated a significant effect of the corresponding factors on the granules hardness. Regression coefficient of Eq. (5) explained that x1and x3have positive effect while x2has negative effect on the granule hardness. Likewise, an interaction term x1x2was favorable for decreasing granules strength while the x1x3led to increase the granules strength.The quadratic term x12had also positive effect on the granules hardness.This can be explained on the basis that high impeller speed generates high shear force which could favor collision between particles and particle-equipment. This helps to reduce the porosity of granules by forming strong bridge between particles and eventually increased granule hardness.This result is in line with other previous studies [1,3,5,34].Long wet massing time helps consolidate the granules,which further densifies the granules and aids to enhance granules strength.Moreover,depending on the degree of liquid saturation,the bonding strength between the colliding granules may be strong enough to resist the separating force between the granules.This can be explained by that low liquid addition rate results in uniform dispersion of water in powder mixture and granules formed have a higher degree of saturation.However,total granulation time was increased due to slow liquid addition rate and this makes agglomerates with higher mechanical strength.In addition,the binding agent,povidone K30 in this case could be affected by water addition rate and could affect granules hardness.

Fig.2.-Residual plots for(A)granule hardness,(B)Carr’s index,(C)true density,(D)SMD,(E)Heckel plot constant,and(F)tablet tensile strength.
Surface response plot of granules hardness (Fig. 3) shows the relationship of impeller speed and wet massing time on granule strength. It was observed that high impeller speed and low water spray rate could generate granules with high mechanical strength.Short massing time had little influence.However,with increased wet massing time the granule hardness increased irrespective of water spray rate.
3.3.2. Effect of control factors on Carr’s Index(y2)
One of the purposes of granulation process was to improve the flow properties of materials. The bulk and tapped densities of granules affect the granules flowability. Carr’s Index(CI) of granules can be obtained from the tapped and bulk density which provides the indication of granule flowability.The result showed that CI of powder blend prior to granulation was 38.36%, indicating very poor flow. However, CI was significantly reduced after granulation: CI value of experimental runs ranged from 9.28 to 16.9.The residual plot of CI(Fig.2B)exhibited good fitness between experimental data and predicted value. The result of regression analysis of control factors affecting the CI of granules was used to generate the empirical model as described in equation below.

Table 3 presents ANOVA results of CI. A P value <0.05 of any factors or their interaction indicates a significant effect on CI.It was observed that impeller speed had the most significant effect on granule flow properties followed by massing time. The negative sign of estimated coefficients for the impeller speed and massing time indicated that CI of granules decreased with increase in impeller speed and massing time.This might be attributed due to high granule density as well as smooth and spherical surface morphology of granules at high impeller and massing time[35].However,positive sign of estimated coefficient for interaction term of liquid spray rate and massing time (x2x3) indicated that CI of granules increased due to interaction effect of spray rate and massing time.Furthermore, response surface plot (Fig. 4) showed the relationship of impeller speed and wet massing time on CI. It was demonstrated that high impeller speed and long wet massing time improved the granule flowability by decreasing CI.The flowability of granules could also be influenced by surface morphology of granules.Generally,spherical and smooth surface texture granules have good flow properties whereas granules with rough texture and irregular shape have poor flow property. High impeller speed and long massing time helpsproduce dense granules as describe previously, which could reduce the CI.Moreover,spherical shape with smooth texture could minimize the CI value.CI provides valuable information on granules flowability as inadequate flow property of granules causes issues during compaction process such as tablet weight variation and inadequate content uniformity.Granules with lower CI value were considered suitable for tableting process.

Table 3.-ANOVA of the dependent variables of the experimental design.
3.3.3. Effect of control factors on granule density(y3)
As shown in Table 3,P value <0.05 of impeller speed and liquid spray rate in the ANOVA indicated a significant effect on granule density. The actual model R2and adjusted R2of the true density of granules(y3)is 0.9389 and 0.9287,respectively.This value indicated good data fitting. In addition, the residual plot of density of granules(Fig.2C)explained good fitness.The effect of control factors on granule density was shown in the surface response plots (Fig.5).It showed that the granule density increased with increase in impeller speed.
3.3.4. Effect of control factors on surface mean diameter of granules(SMD,y4)
The granule growth is dominated by one of the two mechanisms; coalescence and layering [10]. Granules formation at lower impeller speed might be dominated by coalescence mechanism. However, granules growth by both layering and collision mechanism predominated at higher impeller speed.Granules growth by layering occurs when fine particles stick to larger granule in presence of binding agent[11].The result of regression analysis of control factor affecting the SMD of granules was used to generate the empirical model described by equation below.

Fig.3.-Response surface plots correlating dependent variable(y1:granule hardness)with independent variables(x1:impeller speed and x3:massing time).Independent variable(x2:spray rate)was presented with(A)3.7 ml/min,(B)5.2 ml/min,and(C)6.7 ml/min.

Fig.4.-Response surface plots correlating dependent variable(y2:Carr’s index)with independent variables(x1:impeller speed and x3:massing time).Independent variable(x2:spray rate)was presented with(A)3.7 ml/min,(B)5.2 ml/min,and(C)6.7 ml/min.

Fig.5.-Response surface plots correlating dependent variable(y3:granule density)with independent variables(x1:impeller speed and x3:massing time).Independent variable(x2:spray rate)was presented with(A)3.7 ml/min,(B)5.2 ml/min,and(C)6.7 ml/min.

Fig.6.-Response surface plots correlating dependent variable(y4:SMD)with independent variables(x1:impeller speed and x3:massing time).Independent variable(x2:spray rate)was presented with(A)3.7 ml/min,(B)5.2 ml/min,and(C)6.7 ml/min.

SMD of granules of different formulations ranged from 147.90 μm to 342.25 μm. In Table 3, a P value <0.05 for any factor in ANOVA represents a significant effect of the corresponding factors on the SMD. All the significant terms have positive effect exhibiting that increasing level of these factors results in higher SMD.High impeller speed generates highshear force between granulating particles.This force could facilitate coalescence in the presence of binding agent. Moreover, the densification of granules may occur affecting the mechanical properties of granules and ultimately the SMD of granules. As consistence with the previous works, impeller speed and massing time had more potential for controlling the particle size distribution of granules [36-38]. However,some literatures revealed that granules size decreased with increase in impeller speed and massing time [39,40]. Granule size distribution (GSD) is an important CQA of granules which could affect the tablet properties.Wide GSD might result in inconsistent tablet weight,issues of content uniformity due to segregation of fine and large granules. Fig. 6 showed the surface response plot of SMD which depicted that SMD of granules increased with increasing impeller and wet massing time. In addition, the residual plot of granule hardness(Fig.2D)described good fitness of experimental and predicted values.

Table 4.-Heckel and Kawakita parameters of granules.
3.3.5. Effect of control factors on compression behavior(y5)
Heckel and Kawakita equations are commonly used to characterize compaction behavior of pharmaceutical materials or agglomerates.Heckel constant(slope of-ln(porosity)vs.compaction pressure) is inversely proportional to yield pressure.It has been used to characterize plastic behavior of the materials. The parameters obtained from the Heckel analysis of the 15 experimental granules are summarized in Table 4.Yield pressure was calculated from the straight line of the plot between compaction pressures 50-200 MPa (R2>0.99 in all cases).
As shown in Table 3, P value <0.05 of impeller speed and wet massing time showed significant effect on the Heckel constant.The actual model R2and adjusted R2of the plot constant(y5)is 0.8416 and 0.8371,respectively.The residual plot of the constant (Fig.2E) suggested good fitting between experiment and predicted values.Moreover,the relationship between the impeller speed,water spray rate,and massing time on Heckel plot constant could be investigated using surface response plot (Fig. 7). It showed that Heckel plot constant decreased with increase in wet massing time irrespective of water addition rate.This could indicate that wet massing time increased the yield pressure required for granules to undergo plastic deformation.The other factors that may affect the yield pressure include deforming nature of excipients,and friction between granules and die wall during compression.
Effect of compression pressure on compressibility of granules was studied by Kawakita analysis.Kawakita parameters,a and b of granules of all the experimental runs, were presented in Table 4. Granules having high value of a indicated greater compressibility.Moreover,granules produced at lower impeller speed was porous compared to the ones obtained at higher impeller speed. Likewise, b indicated that tablet produced by granules of Run 6 had the highest yield strength.The granule produced at lower impeller speed had low yield strength.
3.3.6. Effect of control factors on tablet tensile strength(y6)
Tensile strength of tablet can be an important parameter that should be taken into consideration during wet granulation as it affects the quality of final dosages forms.Tablet with poor tensile strength may break during subsequent handling during coating and/or transportation. Table 1 shows the result of tensile strength. The quadratic mathematical equation in coded terms for a tensile strength is given in equation below.

As shown in Table 3, all the factors have significant effect on tablet tensile strength (P value <0.05). It shows that impeller speed has the highest effect followed by wet massing.The positive sign of the estimated coefficients of impeller speed and wet massing time indicated that high level of these parameters led to higher tensile strength while spray rate had negative effect on it. Similarly, the interaction of x2and x3favored the increase in tensile strength while x1and x3and quadratic term of x32reduced the tensile strength. During compression, various factors such as mechanical interlocking,solid bridging,particle fragmentation,van der Waal’s force have contributed in packing and bonding of granules[41].The effect of independent variables on tablet tensile strength was shown in the response surface plot in Fig. 8. Lower impeller speed and short massing time decreased the tensile strength while slow spray rate increased the tensile strength.Previous study revealed that the influence of process variables on tablet tensile strength varied with the nature of excipients used in formulation [42-44]. In addition, the residual plot of granule hardness(Fig.2F)defined good fitness.
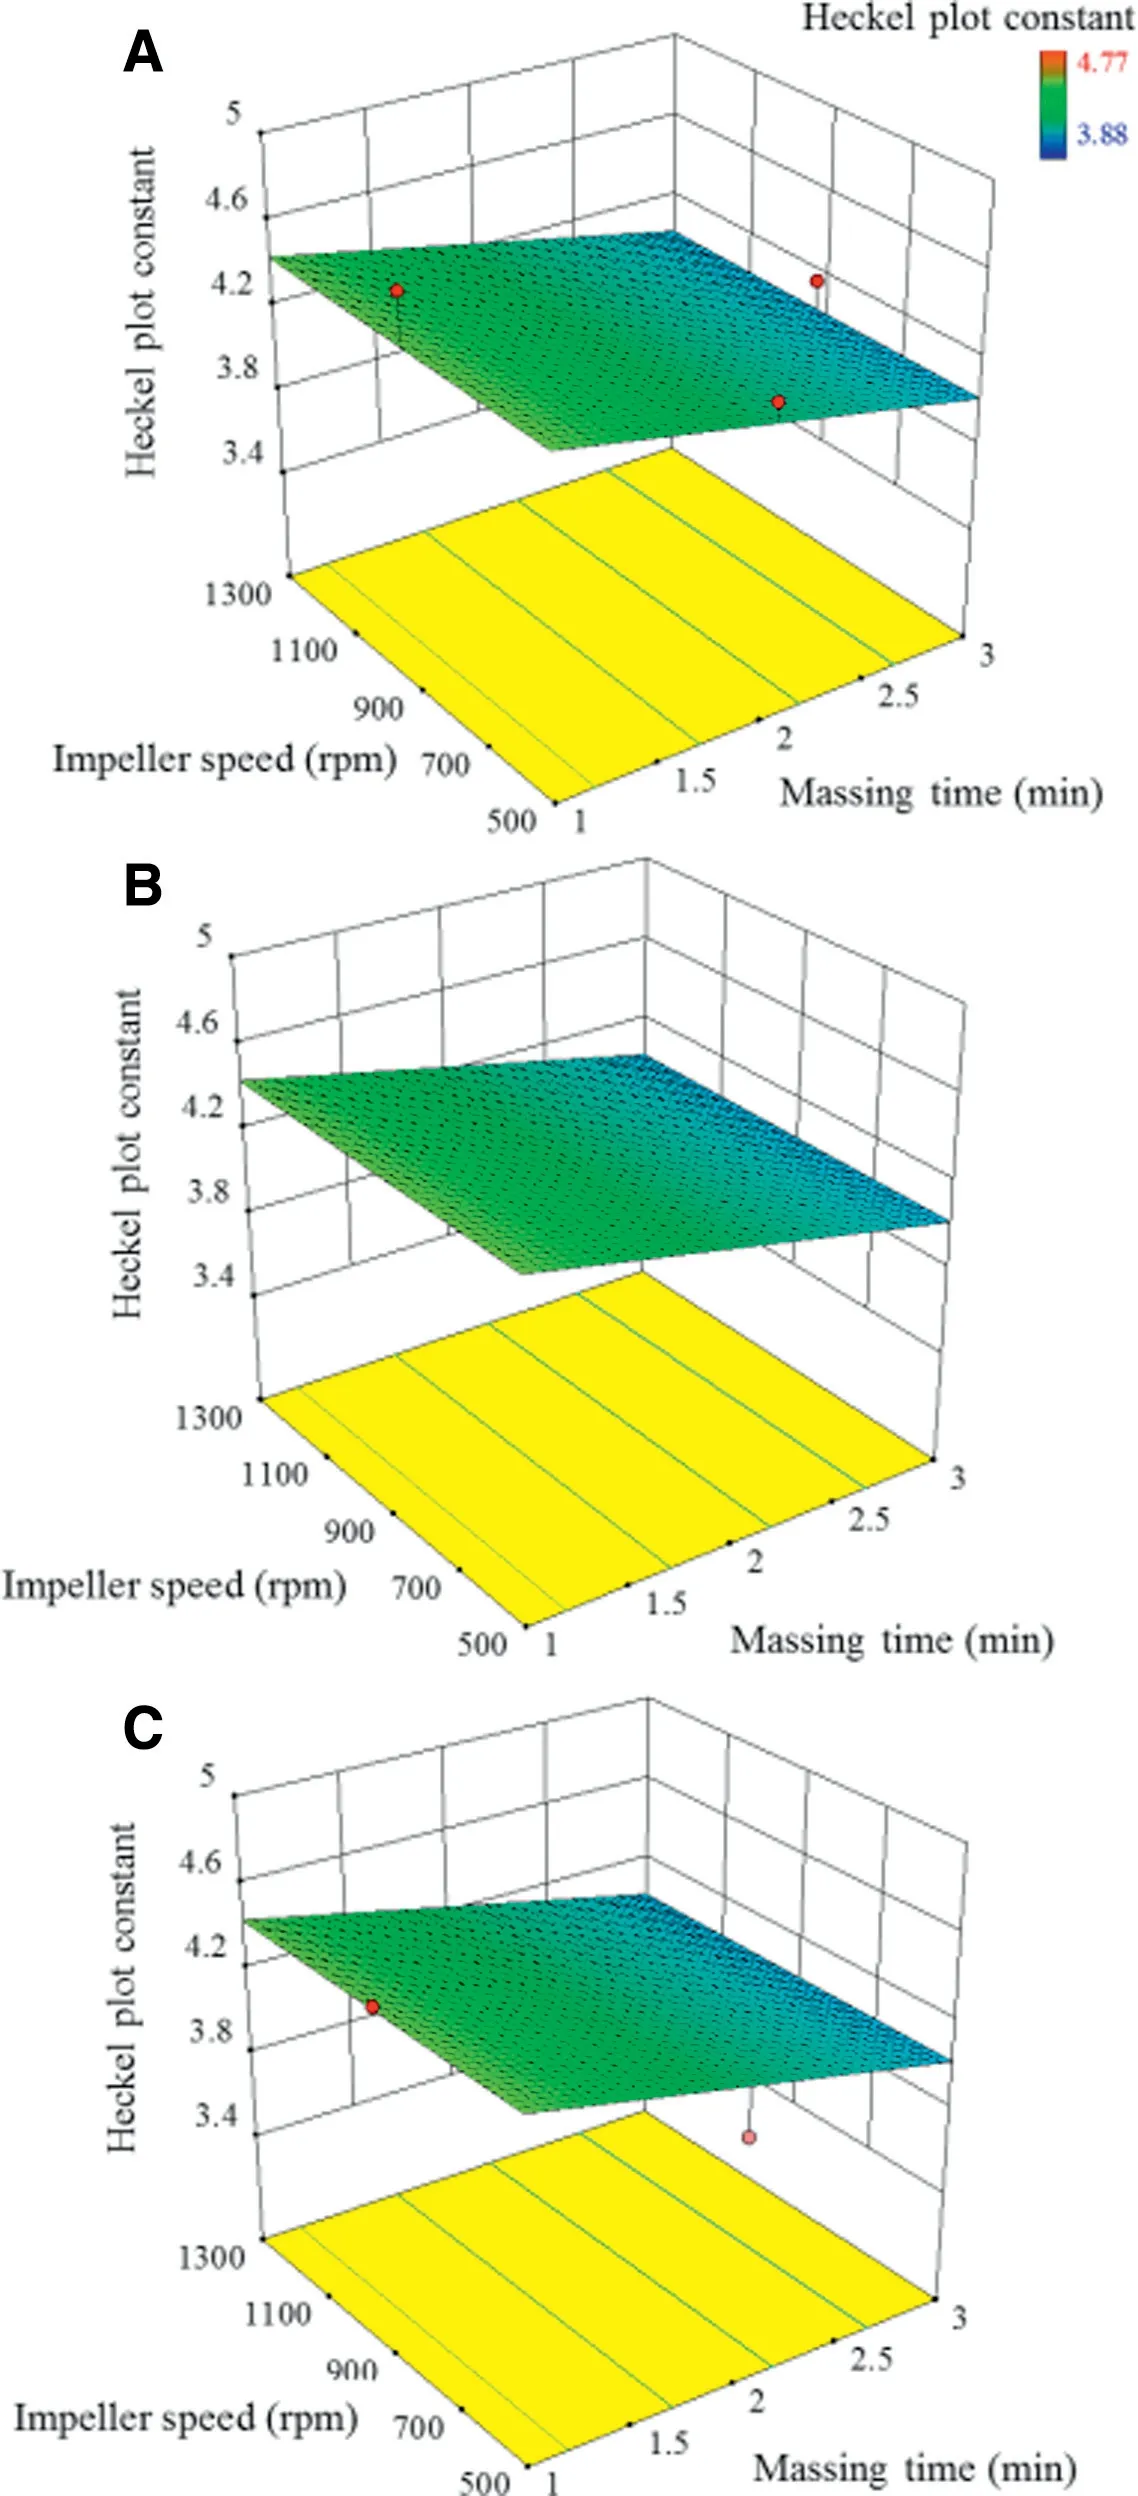
Fig.7.-Response surface plots correlating dependent variable(y5:Heckel plot constant)with independent variables(x1:impeller speed and x3:massing time).Independent variable(x2:spray rate)was presented with(A)3.7 ml/min,(B)5.2 ml/min,and(C)6.7 ml/min.

Fig.8.-Response surface plots correlating dependent variable(y6:tablet tensile strength)with independent variables(x1:impeller speed and x3:massing time).Independent variable(x2:spray rate)was presented with(A)3.7 ml/min,(B)5.2 ml/min,and(C)6.7 ml/min.
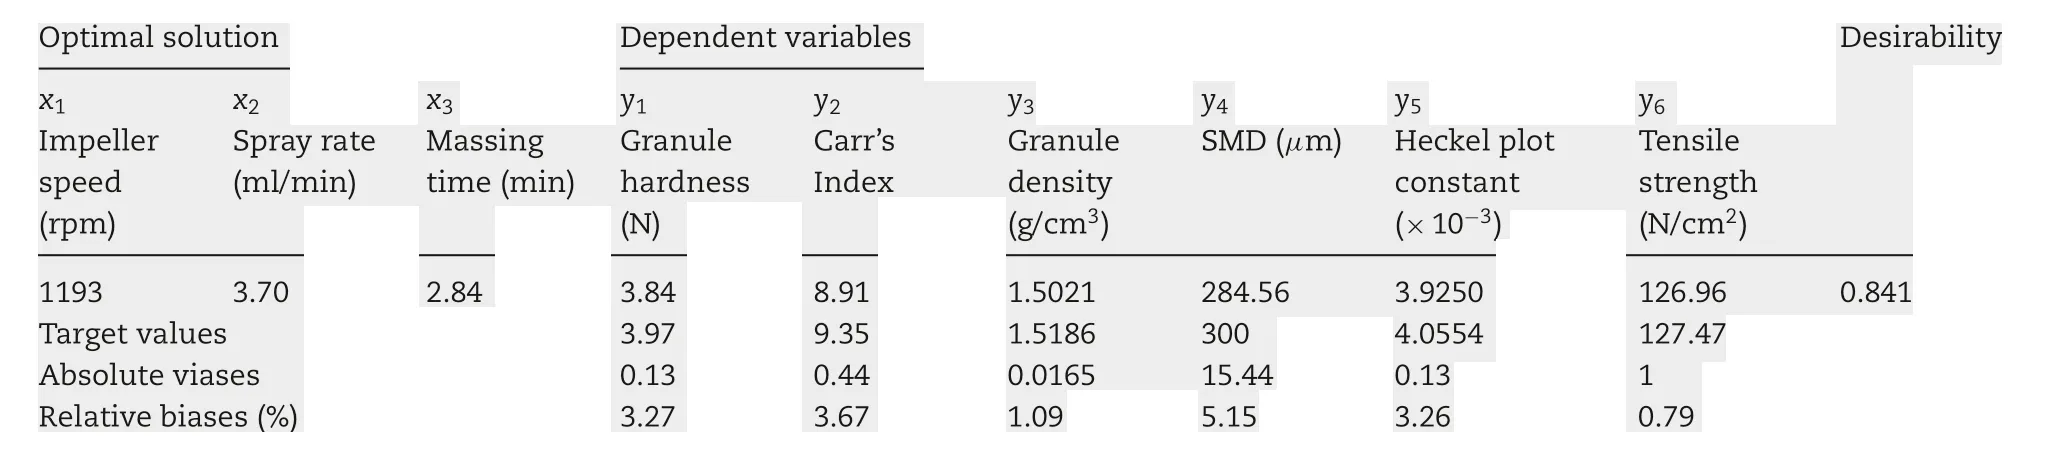
Table 5.-Optimal solution,target values,and experimental results for the dependent variables.
3.4. Optimization of granulation process parameter
The purpose of optimizing granulation parameter is to determine the best values of variables for the production of granules and tablets with desirable characteristics [45,46]. After generating statistically validated models to interpret the relationship between independent and response variables,granulation process can be optimized to give the most desirable response values.The granule hardness,tablet tensile strength,and SMD are maximized while CI was minimized. Likewise,the target values of Heckel plot and true density were 4.0552 and 1.5186,respectively.The result of optimal settings of process parameter based on the target of responses is shown in Table 5. Overall desirability was 0.84 suggesting that the target responses variables met experimental values.Biases and relative bias percentages between the optimal solutions and the target values were very similar showing target values of response were well predicted under optimized process condition.
Moreover,to compare the effects of model drug,sildenafil citrate (SC),on granule attributes and tablet tensile strength,SC granules were prepared using the same process parameters. The granules hardness of SC was 4.09±0.08 N, tablet tensile strength was 121±4.5 N/cm2,CI value was 9.08±0.08,and SMD was 290±8.4 μm.These results were very similar to the formulation of optimized process parameter without drug(Table 5).This might indicate that addition of SC did not significantly affect granule and tablet properties, even though the SC replaced the amount from lactose monohydrate. As shown in Fig.9,dissolution profiles of SC tablet and SC itself were not so different and the SC was completely dissolved in 15 min.
3.5. Morphology of granules

Fig.9.-In vitro dissolution studies of sildenafil citrate tablet of optimized granulation process parameter and pureSildenafil Citrate in simulated gastric fluid(pH 1.2).
SEM images of granules at different impeller speed (500,900,and 1300 rpm)and SC granules of optimized granulation process parameter are shown in Fig. 10. Granules prepared at 1300 rpm impeller and optimized impeller speed (impeller speed 1193) showed smooth surface and spherical shape.However, at lower and intermediate impeller speed i.e., 500 and 900 rpm, granules had rough surface texture with irregular shape. Moreover, the SEM images supported that granule formation at higher impeller speed might be dependent on layering mechanism. However, both layering and collision mechanism might favor the granule formation at lower impeller speed. This might suggest that granule formation is governed by different mechanism depending on impeller speed. Previous work have reported elongated rod shaped granules at lower impeller speed and spherical granules at higher impeller speed[3],which is consistent with the current study.
3.6. Multivariate data analysis
Multivariate data analysis helps understand the relationship between variables in complex data sets [47-49]. It might be helpful to classify the process variable according to the contribution of individual property. The PC1 versus PC2 score plot (Fig. 11A) showed the relationship between the different experimental runs (R1-R15). The model explained total variation of 74% (45% and 29% for PC1 and PC2,respectively).Moreover, it can visualize that runs which had similar characteristics were clustered,while runs that were markedly different are located on the opposite side. Likewise, score plot of PC1 versus PC3 showed relationship between the different experimental runs(Fig.11B).The model explained total variation of 64%(45%and 19%for PC1 and PC3,respectively).Overall,the score plot exhibited that the most important variable should have both high covariance and correlation with regards to respective principal components.

Fig.10.-SEM image of granules at impeller speeds.(A)500 rpm,(B)900 rpm and(C)1300 rpm and(D)SC granules of optimized granulation parameter.

Fig.11.-Score plot(A)PC1 vs PC2 and(B)PC1 vs PC3,Loading plot of(C)PC1 vs PC2 and(D)PC1 vs PC3 of 15 different experimental runs.
The loading plots help to visualize whether variables are correlated or anti-correlated with regards to respective principal components [30]. Fig. 11C showed loading plot of PC1 and PC3 which accounted total variation of 64% (45% and 19% for PC1 and PC3, respectively). Physical properties of tablet and granules such as true density, granules hardness,SMD of granules and tablet hardness had strong positive PC1 loading values. CI, however, had strong negative PC1 loading values located on the left side of plot. All the properties with strongly positive or negative PC1 loading values were known to be related to physical properties of granules.Moreover,loading plot exhibited opposite correlation between CI value and granules.As expected,increased in granule hardness, granules size, and true density of granules, resulted in decrease of CI, which indicated granules of better flow properties. Evaluation of PC3 showed that Kawakita_b and Heckel plot had good correlation while they were inversely correlated. Likewise, for PC2 (Fig. 11D), it was observed that the Heckel_a_p plot is anti-correlated with Heckel plot.
Partial least square (PLS) model was used to analyze the most important factors influencing variability among the granules as well as to determine their mutual relationships[50]. Fig. 12A shows the correlation loading plot of process parameters and critical attributes and provides valuable information about the relationship between process parameter of high shear granulator and responses.When analysing the Factor 1,the loading indicated strong positive correlation between impeller speed and tablet and granules hardness, followed by true density of granules.However,it showed that impeller speed was anti-correlated with CI.Similarly,for Factor 2, wet massing and liquid spray rate were closely correlated with Heckel plot indicating these process parameters could have influenced on compression properties of granules.However,wet massing and spray rate has inversely correlated with Heckel_a_p followed by Kawakita_b.
The model developed for granule hardness was successfully validated using PLS model as shown in Fig.12B.The blue points represented calibration,whereas and red points represented validation data set.The predicted vs 参考文献 of granule hardness of all experimental runs showed strong correlation i.e. R2values of predicted and 参考文献 were 0.9082 and 0.8467,respectively.Since there is not much variability between the R2values of predicted and 参考文献,the model can adequately define the granule hardness.
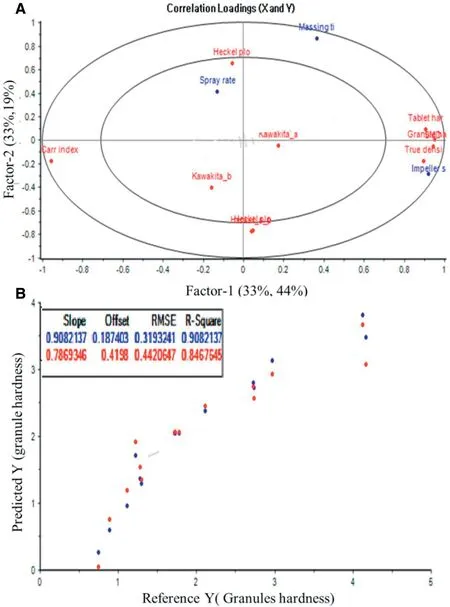
Fig.12.-(A)Correlation loading plot of granulation process parameter and granules and tablet properties,(B)Correlation between Predicted vs 参考文献 of granules hardness.
4. Conclusion
In this study, granules were prepared using laboratory scale high shear granulator and their physical properties were evaluated.The BBD was used to obtained optimal granules using three process parameters;impeller speed,liquid addition rate,and wet massing time.Different mathematical model was developed to predict granule strength, tablet tensile strength,Carr’s index and SMD of granules, true density of granules and Heckel constant plot. The quantitative effects of different levels of process variables on the response variables were accurately predicted using polynomial equations, with high linearity observed between the predicted and actual values of the response variables.The optimized process variables were obtained using a numeric optimization technique. Moreover,PCA and PLS tools were applied to interpret relation between process parameters on granules and tablet properties.Overall,combination of experimental design concepts and multivariate data analysis can be applied to optimize the granulation parameters that could affect the granule attribute (hardness,surface mean diameter,and Carr’s Index)and tensile strength of tablets.
Conflict of interest
The authors declare that there is no conflict of interest.
Acknowledgments
This work was supported by the National Research Foundation of Korea (NRF) grant, funded by the Korean government (MSIT) (2015R1A1A1A05000942) and the National Research Foundation of Korea (NRF) grant funded by the Korea government(MSIT)(NRF-2018R1A5A2023127).
猜你喜欢
杂志排行

Asian Journal of Pharmacentical Sciences的其它文章
- Recent strategies on targeted delivery of thrombolytics
- Cellulose based polymers in development of amorphous solid dispersions
- Phyto-phospholipid complexes(phytosomes):A novel strategy to improve the bioavailability of active constituents
- MSNCs and MgO-MSNCs as drug delivery systems to control the adsorption kinetics and release rate of indometacin
- Percutaneous absorption and brain distribution facilitation of borneol on tetramethylpyrazine in a microemulsion-based transdermal therapeutic system
- Formulation of a film-coated dutasteride tablet bioequivalent to a soft gelatin capsule(Avodart®):Effect of γ-cyclodextrin and solubilizers