Study on Accumulation and Dynamic Changes of Three Carbohydrates in Jerusalem Artichoke in Natural Habitats
2019-09-10LihuiWANGXuemeiSUNLongTANYiLI
Lihui WANG Xuemei SUN Long TAN Yi LI
Abstract Two varieties of Jerusalem artichoke (early maturing variety Qingyu No. 1 and middle maturing variety Qingyu No. 2), which were bred independently by Research and Development Center of Jerusalem Artichoke, Qinghai Academy of Agriculture and Forestry, were used as materials, and the content and dynamic changes of three kinds of carbohydrates (sucrose, glucose and fructose) in various organs of Jerusalem artichoke in different periods in two natural habitats (water plain and low hill dry land) were studied. The results showed that the content of the three kinds of carbohydrates in Qingyu No. 1 and Qingyu No. 2 in the water plain and low hill dry land was relatively high in late June and late August. The total content of the three carbohydrates in Qingyu No. 1 peaked earlier than that of Qingyu No. 2. The total content of the three carbohydrates in the water plain peaked earlier than that of the low hill dry land. In the whole growth period, the total content of the three carbohydrates in the stems and roots of Jerusalem artichoke was higher than that of the leaves. In the leaves, fructose accumulation was relatively obvious in the whole growth period, and the content was high, followed by glucose. In the stems and roots, fructose content was high, followed by sucrose. In the tubers, glucose accumulation was obvious, and sucrose content was lower than glucose and fructose content. When the tubers were harvested, fructose content was high.
Key words Jerusalem artichoke; Carbohydrates; Sucrose; Glucose; Fructose; Dynamic changes
Jerusalem artichoke (Helianthus tuberosus L.), commonly known as sunchoke, is a perennial herb of the genus Helianthus, the family Compositae. It is native to North America and is introduced into China via Europe. Its tuber is edible. Jerusalem artichoke has been widely used in food, medicine, energy and chemical industry, animal husbandry and ecological protection. The tuber of Jerusalem artichoke is rich in linear chain fructan and is an excellent raw material of inulin products, so it has been widely applied in food, beverage, feed, medicine and other industries. Jerusalem artichoke can be fermented to produce fuel alcohol and biodiesel and is one of the four major energy crops. It is high in yield and rich in nutrients, so it is an excellent forage plant. Its stems and leaves can be dried to make hay or be used as silage, so it is a kind of high quality forage grass with complete nutrition. Meanwhile, Jerusalem artichoke has become a high quality choice for ecological protection due to its strong stress resistance. It can be planted in dry, alpine, and saline and alkaline land to improve soil and ecology. It is getting more and more peoples attention because of its strong stress resistance, remarkable health effects and wide uses. The comprehensive research on Jerusalem artichoke is gradually conducted. In addition to being rich in fructan, it also contains carbohydrates and other sugars. In this paper, based on the research on accumulation and distribution of fructan from Jerusalem artichoke and effects of drought stress on the metabolism of fructan from Jerusalem artichoke, the content of sucrose, glucose and fructose in Jerusalem artichoke and their dynamic changes were studied to further explore the dynamic changes of carbohydrates in Jerusalem artichoke and the relationship between the metabolism of fructan and other carbohydrates from Jerusalem artichoke.
Materials and Methods
Test materials
Two varieties of Jerusalem artichoke (early maturing variety Qingyu No. 1 and middle maturing variety Qingyu No. 2), which were bred independently by Research and Development Center of Jerusalem Artichoke, Qinghai Academy of Agriculture and Forestry, were used as materials.
Test location
The test was conducted in the Longchuan Mountains (low hill dry land, 2 680 m above sea level) in Yuzhong County and Mojiaquan experimental site (water plain, 2 309 m above sea level) in Ershilipu, Chengbei District, Xining City, Qinghai Province.
Investigation method
In the five key periods of growth and development of Jerusalem artichoke: seedling stage (0-30 d after emergence of seedlings), rapid growth period of plants (30-75 d), tuber formation stage (75-100 d), flowering stage (100-120 d) and tuber expansion stage (120-155 d), samples were collected, and three plants were sampled in each period.
Test methods
Sample treatment
The fresh stems, leaves, roots and tubers were weighed firstly. The representative fresh samples at the same parts were weighed and dried to a constant weight to weigh dry weight. After the samples were ground, a certain amount of distilled water was added to each of the dried samples, and the samples were heated in water bath at 80 ℃ for 20 min. They were centrifuged to take the supernatant, and distilled water was added to the residue. Extraction was performed three times according to the above process. After all of the supernatant was merged and evaporated , distilled water was added to the residue to dissolve it. Each sample was repeatedly tested three times.
Determination of carbohydrate content
The content of total soluble sugar was determined by the indolone method[1]. The contents of glucose, fructose and sucrose were determined by HPLC[2]. The Shimadzu LC20A analysis system was used, which was equipped with LC10A refractive index detector and Shim pack SCR 101 C (7.9 mm×30 cm) dedicated column for sugar analysis. The mobile phase was ultrapure water with a flow rate of 1 ml/min , and the column temperature was 80 ℃. The samples were filtered through a microporous membrane and injected, and the injection volume was 20 μl.
Results and Analysis
Dynamic changes in the total content of three kinds of carbohydrates in Jerusalem artichoke in the whole growth period
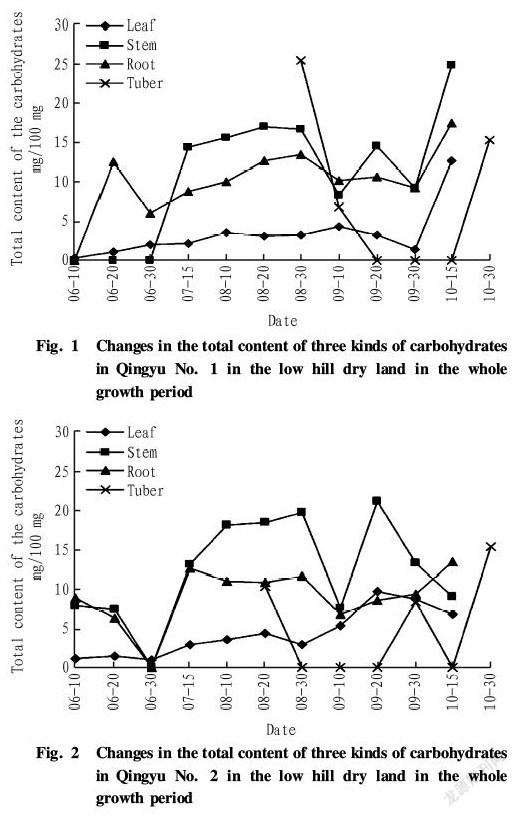
As shown in Fig. 1, in the low hill dry land, dynamic changes in the total content of three kinds of carbohydrates in the roots, stems and leaves of Qingyu No. 1 in the whole growth period were different. In the growth period of plants, the total content of three kinds of carbohydrates in the leaves was low, ranging from 2 to 4 mg/100 mg. In the tuber swelling period from late September to middle October, the total content in the leaves increased rapidly until it peaked in middle October (up to 12.66 mg/100 mg). The total content of three kinds of carbohydrates in the stems did not increase at the seedling stage in June and then rose fast in July when the plants grew rapidly, being maintained at around 15 mg/100 mg. The content changed greatly in August and September and then peaked in middle October (up to 24.78 mg/100 mg). The total content of three kinds of carbohydrates in the roots increased from 0 to 12.88 mg/100 mg rapidly in early and middle June, then fluctuated within a certain range, and peaked in middle October (up to 17.33 mg/100 mg). In addition, the tubers of Qingyu No. 1 began to form in late August, and the total content of three kinds of carbohydrates in the tubers peaked, up to 25.32 mg/100 mg. Afterwards, the content dropped rapidly, and there was no accumulation of the carbohydrates in the tuber swelling period from mid to late September to middle October. The content in the tubers rose again in the harvesting period of the tubers.
Seen from Fig. 2, similar to Qingyu No. 1, the total content of three kinds of carbohydrates in the leaves of Qingyu No. 2 in the low hill dry land in the whole growth period was low and changed slightly. It reached the maximum (9.66 mg/100 mg) in middle September and then declined after late September. The content in the stems changed greatly, there was accumulation of the carbohydrates in the stems in early and middle June, but it decreased to 0 in late June. Afterwards, it rose rapidly and reached a high level (20 mg/100 mg) in July and August. It dropped and then increased fast in early September, peaking in middle September (up to 21.12 mg/100 mg). Then the content reduced gradually. The total content of three kinds of carbohydrates in the roots started to decrease from 8.23 mg/100 mg at the seedling stage to 0 in late June. Afterwards, it rose rapidly but was lower than that of the stems, peaking in middle October (up to 13.40 mg/100 mg). In the low hill dry land, the tubers of Qingyu No. 2 formed about 10 d earlier than that of Qingyu No.1, and the change of the content in the tubers of Qingyu No. 2 was similar to that of Qingyu No. 1, namely decreasing from a high value to 0 rapidly. In the harvesting period of the tubers, the content in the tubers increased to the maximum 15.37 mg/100 mg.
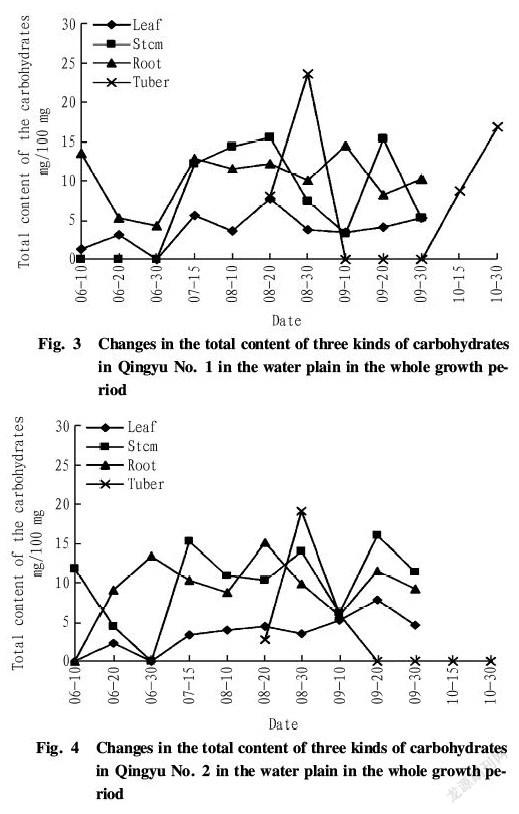
According to Fig. 3, in the water plain, the three kinds of carbohydrates in the leaves of Qingyu No. 1 began to accumulate at the seedling stage, and the total content of the carbohydrates was maintained at a low level like the hill dry land. It reached the maximum 7.71 mg/100 mg in middle August and then reduced to around 5 mg/100 mg. There was no accumulation of the carbohydrates in the stems of Qingyu No. 1 at the seedling stage in June. The content in the stems began to rise fast in July and peaked in middle August (up to 15.48 mg/100 mg). Afterwards, it fluctuated greatly and decreased to 0 in late September. The total content of the carbohydrates in the roots of Qingyu No. 1 at the seedling stage was high, up to 13.68 mg/100 mg. It declined in middle and late June and increased from July to August, ranging from 10 to 13 mg/100 mg. It reached to the maximum 14.55 mg/100 mg in early September and then decreased. There was no accumulation of the carbohydrates in the roots since October. The tubers of Qingyu No. 1 in the water plain formed about 10 d earlier than that of the low hill dry land. The total content of the carbohydrates in the tubers increased rapidly and peaked in late August (up to 24.41 mg/100 mg). Afterwards, like the low hill dry land, there was no accumulation of the carbohydrates in the tubers in September. In the harvesting period of the tubers, the total content of the carbohydrates in the tubers increased to a high level.
As shown in Fig. 4, the three kinds of carbohydrates in the leaves of Qingyu No. 2 in the water plain was low and reached the maximum 7.78 mg/100 mg in middle September. Afterwards, it decreased gradually. The total content in the stems tended to decrease in June, increased in July and then fluctuated. It peaked in middle September (up to 16.00 mg/100 mg) and began to reduce in late September. The content in the roots started to increase fast at the seedling stage in early June and was maintained at a high level in July and August. It reached the maximum 15.12 mg/100 mg in middle August and then tended to reduce on the whole. There was no accumulation of the carbohydrates in the roots since October. Similar to Qingyu No. 1 in the water plain, the total content of the carbohydrates in the tubers increased rapidly in the tuber formation period and reached the maximum 19.13 mg/100 mg in late August. Afterwards, it decreased to 0 gradually.
Dynamic changes of various carbohydrates in different organs of Jerusalem artichoke
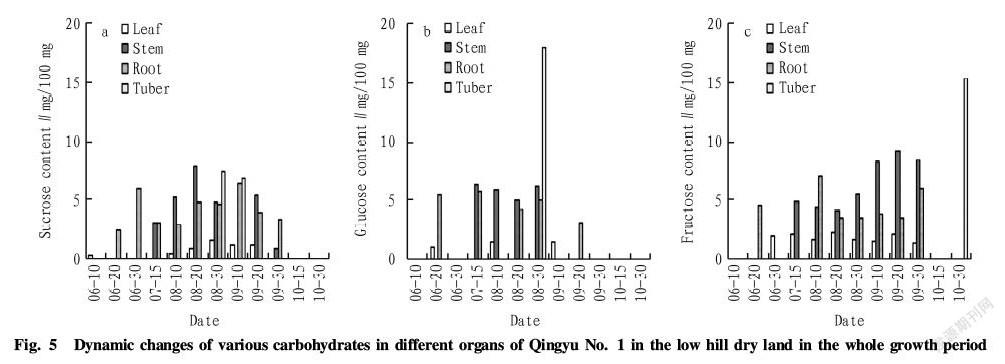
Seen from Fig. 5, sucrose content in the leaves of Qingyu No. 1 in the low hill dry land was not high in the whole growth period, lower than 2 mg/100 mg. In early June, only the leaves contained sucrose. In middle and late June, only the roots contained sucrose, and sucrose content ranged from 2 to 6 mg/100 mg. Sucrose in the stems began to accumulate in July, and the stems were withered after September. In the whole growth period, sucrose content increased firstly and then decreased. The maximum appeared in middle August, up to 7.81 mg/100 mg. In the whole growth period, sucrose in the tubers accumulated only from late August to early September, and the content was about 7 mg/100 mg.
There were differences between various organs of Qingyu No. 1 in the low hill dry land in respect of glucose content in the whole growth period. Moreover, glucose in the leaves accumulated only in middle June, early August and early September, and the content changed from 1.1 to 1.5 mg/100 mg. In the stems, glucose began to accumulate in July, and there was no glucose in the stems after late August. The content ranged from 5.0 to 6.3 mg/100 mg. In the roots, there existed glucose in middle June, July late August and middle September, and the content varied from 3.2 to 5.7 mg/100 mg, while it was the minimum in late September (only 3.2 mg/100 mg). In the tubers, there existed glucose only in late August, and the content was relatively high, up to 18.0 mg/100 mg.
Fructose in the leaves of Qingyu No. 1 in the low hill dry land accumulated from late June to late September, and there was no obvious change in fructose content, namely ranging from 1.3 to 2.2 mg/100 mg. In the stems, fructose began to accumulate in middle July, and fructose content reduced firstly to a certain degree, but the change was small. It increased in late August and reached the maximum (9.2 mg/100 mg) in middle September. It decreased to 8.4 mg/100 mg in late September, and then there was no fructose in the stems. In the roosts, fructose content reached the maximum (7.1 mg/100 mg) in middle August. In the tubers, fructose accumulated only in the picking period in late October, and the content was 15.2 mg/100 mg.
Seen from Fig. 5, the fructose content in the roots, stems, leaves and tubers of Qingyu No. 1 in the low hill dry land was higher than sucrose and glucose content in the whole growth period. In the stems, sucrose content was high in middle August, and glucose content was high in middle July. Fructose content was high in September and higher than sucrose and glucose content. In the tubers, both sucrose and glucose content were high in the early period of tuber formation, and glucose content was significantly higher than sucrose content. When the tubers picked, fructose content was high.
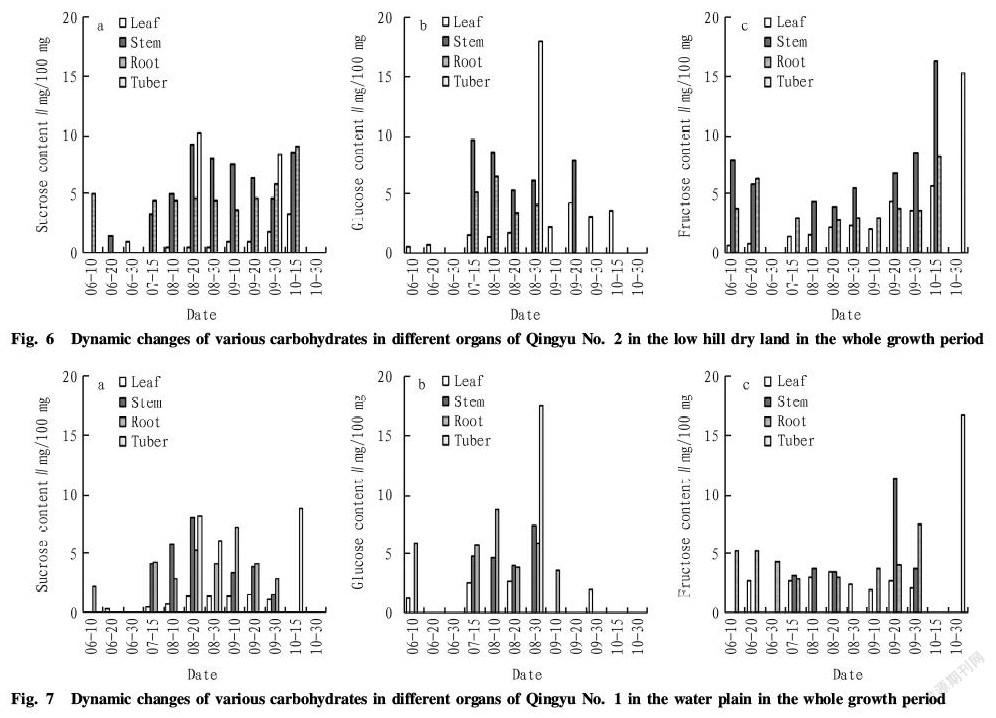
According to Fig. 6, sucrose content in the leaves of Qingyu No. 2 in the low hill dry land was not high in the whole growth period, about 1.0 mg/100 mg. In the stems, sucrose began to accumulate in late June, and the content increased firstly and then decreased in the whole growth period. Moreover, it peaked in middle August, up to 9.2 mg/100 mg, and then it reduced. It increased to 8.5 mg/100 mg in middle October. In the roots, there was no obvious change in sucrose content from July to late September, and sucrose content was 3.5-5.9 mg/100 mg. It increased rapidly to the maximum (9.1 mg/100 mg) in middle October. In the tubers, sucrose accumulated only in middle August and late September, and sucrose content was relatively high, ranging from 8.4 to 10.3 mg/100 mg.
In the low hill dry land, there were certain differences between various organs of Qingyu No. 2 in respect of glucose content in the whole growth period. On the whole, glucose content in the tubers was higher than that of the stems, and it was high in the roots and low in the leaves (less than 5 mg/100 mg). In the leaves, glucose content tended to increase in the whole growth period. In the stems, glucose content began to reduce in July and decreased to the minimum in middle August. Afterwards, it rose and then reduced to 0 after middle September. In the roots, glucose content was 5.1 mg/100 mg in middle July and decreased to 4.1 mg/100 mg in late August. In the tubers, there existed glucose only in late August, and the content was 18 mg/100 mg.
In the low hill dry land, fructose in the leaves of Qingyu No. 2 accumulated from late June to middle October, and there was no obvious change in fructose content in early and middle June, less than 1.0 mg/100 mg. In the leaves, fructose content ranged from 1.4 to 2.4 mg/100 mg from middle July to early September, and increased to 3.7-5.6 mg/100 mg after late September, peaking in middle October. In the stems, fructose content reduced firstly and then rose in the whole growth period. There was no fructose in the stems in late June and early July, and the minimum appeared in middle August. Afterwards, it increased and peaked in middle October (up to 16.2 mg/100 mg). Finally, there was no fructose in the stems. In the roots, fructose content increased in early and middle June and changed from 2.8 to 3.6 mg/100 mg from middle July to late September . It reached the maximum in middle October, up to 8.2 mg/100 mg. In the tubers, fructose accumulated only in the picking period in late October, and the content was 15.3 mg/100 mg.
Seen from Fig. 6, the changing rules of sucrose, fructose and glucose content in the roots, stems, leaves and tubers of Qingyu No. 2 in the low hill dry land in the whole growth period were similar to that of Qingyu No. 1, and fructose content was higher than sucrose and glucose content. Sucrose and glucose content in the tubers were high in the early period of tuber formation, and glucose content was significantly higher than sucrose content. When the tubers were picked, fructose content was high. The difference of the two varieties was that only the peaks of different sugar content were different. Sucrose content in the stems of the two varieties was the highest in middle August. Glucose content in the stems of Qingyu No. 1 peaked in middle July, while that of Qingyu No. 2 was high from middle July to early August. In the stems, fructose content of Qingyu No. 1 peaked in September, while that of Qingyu No. 2 peaked in early October, because the growth period of Qingyu No. 2 was later than that of Qingyu No. 1.
As shown in Fig. 7, sucrose in the leaves of Qingyu No. 1 in the water plain began to accumulate in June, and there was no sucrose in the leaves after late September. Moreover, sucrose content changed from 0.5 to 1.5 mg/100 mg in the whole growth period. In the stems, sucrose started to accumulate in July, and there was no sucrose after late September. Sucrose content in the stems increased firstly and then decreased in the whole growth period. The maximum appeared in middle August, up to 8.0 mg/100 mg. In the roots, sucrose content varied from 2.8 to 7.2 mg/100 mg and peaked in early September (up to 7.2 mg/100 mg). In the tubers, sucrose content was relatively high, ranging from 6.1 to 8.7 mg/100 mg , but it existed in middle and late August and middle October. The maximum 8.7 mg/100 mg appeared in middle October.
In early June, there existed glucose only in the leaves and roots of Qingyu No. 1 in the water plain, and glucose content in the roots was obviously higher than that of the leaves. Since middle July, glucose content in the leaves ranged from 2.5 to 2.8 mg/100 mg. In the stems, glucose content reduced firstly, and the minimum appeared in middle August. It increased to the maximum 7.5 mg/100 mg in late August. In the roots, glucose content rose firstly and then reduced, and the maximum appeared in early August. In the tubers, there existed glucose in late August, and the content was 17.5 mg/100 mg.
In the water plain, fructose in the leaves of Qingyu No. 1 accumulated from middle June and late September, ranging from 2.0 to 3.5 mg/100 mg. The maximum 3.5 mg/100 mg appeared in middle August, and there was no fructose in the leaves after late September. In the stems, fructose content was 3.1 mg/100 mg in middle July and then changed gently. It was 3.5 mg/100 mg in middle August, and then there was no fructose. Fructose accumulated in middle and late September, and the maximum 11.4 mg/100 mg appeared in middle September, while there was no fructose in the stems since October. In the roots, fructose content changed gently in early and middle June and began to reduce in late June. There was no fructose in the roots in late August, and the content increased from early September. It peaked in late September, up to 7.5 mg/100 mg, and then there was no fructose in the roots. In the tubers, fructose accumulated only in the picking period in late October, and the content was high, up to 16.9 mg/100 mg.
Seen from Fig. 7, fructose content in the leaves of Qingyu No. 1 in the water plain was higher than sucrose and glucose content in the whole growth period. Sucrose content was the highest in middle August, and glucose content was high from middle July to middle August. In the stems, sucrose content was high in early August, and glucose content was the highest from middle July to late August. Fructose content was the highest in middle September. Among the three kinds of carbohydrates, fructose content was the highest, followed by sucrose content. In the roots, sucrose content was high in August, and glucose content was high from middle July to late August, while fructose content was high in June and late September. In the tubers, both sucrose and glucose content were high in the tuber formation period in middle August, and glucose content was significantly higher than sucrose content. When the tubers were mature, fructose content was high.
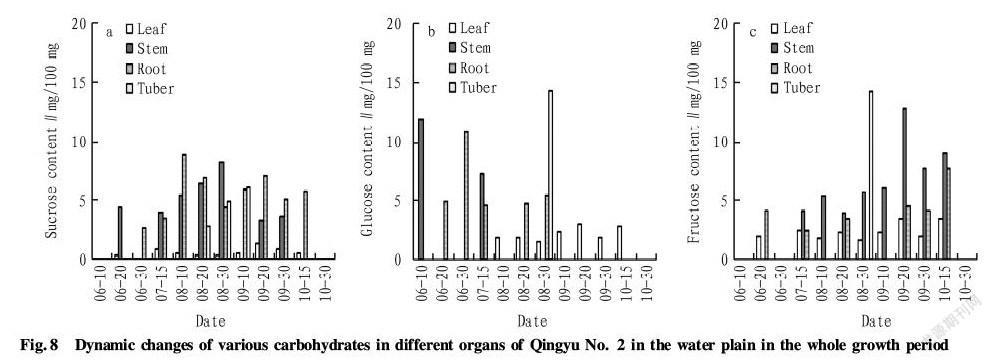
According to Fig.8, sucrose content in the leaves of Qingyu No. 2 in the water plain was less than 1.5 mg/100 mg in the whole growth period. In the stems, sucrose accumulated since middle June until late September when the stems were withered. In the whole growth period, sucrose content in the stems rose firstly and then reduced, and the maximum 8.2 mg/100 mg appeared in late August. In the roots, sucrose accumulated since late June until middle October. In the whole growth period, sucrose content in the roots increased firstly and then declined, and the maximum 8.5 mg/100 mg appeared in early August. It rose again in early September and then reduced in late September. In the tubers, sucrose accumulated only in the tuber formation period, and the content tended to increase, peaking in early September (up to 6.0 mg/100 mg).
In the water plain, glucose in the leaves of Qingyu No. 2 accumulated from early August, and there was no glucose in the leaves after middle October. Glucose content in the leaves changed slightly in the whole growth period, ranging from 1.5 to 3.0 mg/100 mg. In the stems, glucose accumulated only in early June and middle July, and the content was high in early June, up to 11.8 mg/100 mg. In the roots, glucose accumulated from middle June to late August. Glucose content increased firstly and then reduced, and the maximum 10.8 mg/100 mg appeared in late June. In the tubers, glucose accumulated in late August, and the content was 14.2 mg/100 mg.
In the water plain, there were certain differences between various organs of Qingyu No. 2 in respect of fructose content in the whole growth period. In the leaves, fructose accumulated in middle June and from middle July to middle October, and the maximum 3.5 mg/100 mg appeared in middle September. There was no fructose in the leaves after middle October. In the stems, fructose began to accumulate in middle July, and fructose content increased firstly and then decreased in the whole period. The maximum 12.8 mg/100 mg appeared in middle September, and there was no fructose in the stems after middle October. In the roots, fructose content changed greatly and was 4.1 mg/100 mg in middle June. There was no fructose in the roots in late June, and fructose content was 2.4-3.5 mg/100 mg in middle July and middle August. The content increased after middle September and peaked in middle October (7.7 mg/100 mg). Afterwards, there was no fructose in the roots. In the tubers, fructose accumulated in the early period of tuber formation, and fructose content was 14.2 mg/100 mg. In other periods, there was no fructose in the tubers.
Seen from Fig.8, the changing rules of sucrose, fructose and glucose content in different organs of Qingyu No. 2 in the water plain in the whole growth period were similar to that of Qingyu No. 1. The difference of the two varieties was that only the peaks of different sugar content were different. In the stems of Qingyu No. 1 in the whole growth period, sucrose content was high in early August, and glucose content was the highest in middle July and middle August, while fructose content was the highest in middle September. In the stems of Qingyu No. 2 in the whole growth period, sucrose content was the highest in early and middle August, and glucose content was the highest in early June, while fructose content was the highest in middle and late September. In the tubers, sucrose, fructose and glucose content were the highest in late August, and sucrose content was significantly lower than glucose and fructose content.
Conclusions and Discussion
Carbohydrates are important energy sources for plants to carry out various life activities, and play an important role in supporting plant regeneration and tolerance to external environmental stress[3]. Carbohydrates are the main products of plant photosynthesis. According to the form of carbohydrates, they can be divided into structural carbohydrates and non structural carbohydrates. The former includes lignin, cellulose and hemicellulose, which are mainly used for morphogenesis of plants; the latter includes glucose, fructose, starch, sucrose, fructan and mannitol, which are important reactants for plant life activities and participate in the metabolism of plants[4]. Jerusalem artichoke synthesizes and accumulates a large amount of water soluble carbohydrates during growth and development and stores them in its tubers. The main components are sucrose, fructose, glucose, and fructan with different degrees of polymerization (DP), of which fructan content is the highest, accounting for more than 80% of dry weight of the tubers[5]. Fructan is a polymer in which sucrose is linked to one or more fructose. Fructose is an important metabolite of Jerusalem artichoke. After the formation of fructose, it continues to produce fructan, which is then quickly stored in the tubers. Sucrose is a kind of soluble sugar and plays a role in regulating cell osmotic pressure under drought stress. Plants can convert sucrose into fructose under stress and then combine fructan to improve the resistance to stress[6]. Glucose is an important assimilation product and can further synthesize other oligosaccharides and polysaccharides in cells, playing an important physiological role. Jerusalem artichoke synthesizes and accumulates a large amount of fructan based carbohydrates during growth and development and transports them in various organs. Based on the research on accumulation and distribution characteristics of fructan from different organs of Jerusalem artichoke[7-8] and effects of drought stress on the growth of Jerusalem artichoke at the seedling stage and the metabolism of fructan[9-10], the content of sucrose, glucose and fructose in Jerusalem artichoke and their dynamic changes were studied to further explore the dynamic changes of carbohydrates in Jerusalem artichoke and the relationship between the metabolism of fructan and other carbohydrates from Jerusalem artichoke.
References
[1] ZOU Q. Guidance on plant physiological and biochemical test[M]. Beijing: China Agricultural Press, 2000: 173-174. (in Chinese).
[2] YU SL. High performance liquid chromatography method and its application (2nd edition) [M]. Beijing: Chemical Industry Press, 2005. (in Chinese).
[3] GAO YZ, WANG YH, WANG JT, et al. Research advances in the responses of carbohydrates in grassland plants to environmental stress[J]. Chinese Journal of Applied Ecology, 2009, 20(11): 2827-2831. (in Chinese).
[4] PAN QM, HAN XG, BAI YF, et al. Advances in physiology and ecology studies on stored non structure carbohydrates in plants[J]. Chinese Bulletin of Botany, 2002, 19(1): 30-38. (in Chinese).
[5] SUN XM, WANG LH, ZHONG QW. Study on change of the carbohydrates content of Jerusalem artichoke during storage[J]. Northern Horticulture, 2012(11): 131-134. (in Chinese).
[6] YANG XH, CHEN XY. The effect of fructan on the ability of plants resisting stress and correlative gene engineering[J]. Acta Agriculturae Boreali Sinica, 2006, 21(S):6-11. (in Chinese).
[7] SUN XM, LI L. Study on Carbohydrates Metabolism of Jerusalem artichoke in different altitude[J]. Southwest China Journal of Agricultural Sciences, 2011(4):1309-1312. (in Chinese).
[8] ZHONG QW, WANG LH,LI Yi, LI Y, et al. Jerusalem artichoke fructan accumulation and distribution characteristics in different organs of the whole growth[J]. Northern Horticulture, 2012(17):1-4. (in Chinese).
[9] LI W, HUANG GF, SUN XM. Effect of drought stress on the growth of Jerusalem artichoke seedlings[J]. Jiangsu Agricultural Sciences, 2012(10):75-77. (in Chinese).
[10] ZHONG QW, LI Y, SUN XM, et al. Study on sugar metabolism response on drought stress in seedling of Jerusalem artichoke[J]. Southwest China Journal of Agricultural Sciences, 2012(4):1238-1241. (in Chinese).
杂志排行
农业生物技术(英文版)的其它文章
- Study on Chemical Composition of the Ethyl Acetate Extract of Pratia
- Effects of Different Selenium Fertilizer Types on Selenium Content and Quality of “Lingfeng” Grapes
- Protoplast Culture and Its Application in Fruit Breeding
- Indexes of Tree Structure of Cylindrical Pear Orchards at the Sapling Stage
- Carbon Storage and Distribution of the Mature Pinus massoniana Plantation in Northwest Guangxi
- Pollution and Quality Control of Mycotoxins in Foods and Feeds