A Multi-Objective Decision-Making Approach for the Optimal Location of Electric Vehicle Charging Facilities
2019-08-13WeiweiLiuYangTangFeiYangYiDouandJinWang
Weiwei Liu,Yang Tang,Fei Yang,Yi Dou and Jin Wang
Abstract:Electric vehicles (EVs) are recognized as one of the most promising technologies worldwide to address the fossil fuel energy resource crisis and environmental pollution.As the initial work of EV charging station (EVCS) construction,site selection plays a vital role in its whole life cycle.In this paper,a multi-objective optimization model for the location layout of EVCSs is established when considering various factors such as user demand,investment cost,soil locations,the emergency charging mileage limit,the actual road condition and service network reliability.The model takes the minimum investment cost and the minimum user charging cost as the dual objectives.On the basis of satisfying the user’s charging demand and the capacity constraints of EVCSs,the redundant design of the charging pile and station is considered to ensure the reliability of the service network.In the allocation of user charging demand,in this paper,two factors of time and distance are considered,and the equal time load distance method is adopted to distribute traffic flow under the limitation of emergency charging mileage.When calculating the average travel speed of a road section,an accounting method based on the land price level is proposed considering the congestion.Then,the linear weighting method is applied to normalizing the multi-objective function,and the genetic algorithm is employed to solve the problem.Finally,a computational experiment is presented to demonstrate the applicability and effectiveness of the proposed approach.The results show that the proposed approach is a useful,practical,and effective way to find the optimal location of EVCSs.
Keywords:Electric vehicle charging stations (EVCS),multi-objective decision making,location optimization,genetic algorithm.
1 Introduction
As a new type of energy-saving transport,electric vehicles (EVs) have gradually become the focus of world attention and the inevitable trend of auto industry development[Dharmakeerthi and Saha (2012)].With the rapid growth of the number of EVs,the backward charging infrastructure has been unable to meet the charging needs of EVs.The construction of public electric vehicle charging stations (EVCSs) has become an important guarantee for the long-term development of the EV industry.Therefore,it is necessary to fully consider the charging demand,improve the service level,and plan the scientific locations of charging infrastructure,which will be one of the key factors for EVs to replace traditional fuel vehicles.
As the construction of China's EVCSs has just started,a scientific and theoretical system has not yet been formed in the location and layout of charging facilities.Actual planning can only rely on the general guidelines and relevant experience presented in the relevant standard documents [Liu,Wang and Wang (2018)].When some cities implement the EVCS promotion goal,they over-emphasize the increase in the number of infrastructures for improving the service capacity of the EVCS network that ignores the consistency of the location of the infrastructure and the distribution of charging requirements.Therefore,it is urgent to carry out optimization approaches to the location layout of charging facilities for enhancing the construction of the EVCS network and promoting the further popularization of EVs.
There are two main approaches namely the spatial approach and the flow-based approach in the literature to simulating the optimal location of EVCSs.The spatial approach is an adaptation of well-known models such as p-median [Toregas,Swain and Revelle (1971);Campbell (1996);An,Zeng and Zhang(2014)] and coverage problems[Chen,Shi,Chen et al.(2015) ;Wang,Ju,Gao et al.(2018) ;Liu,Yang,Zhou et al.(2019)] used for thefacility location [Wang,Gao,Sherratt et al.(2018);Wang,Gao,Liu et al.(2019)].The P-median problem is based on the minimum demand point and the average distance from the service station.It is assumed that the supply station is located near the vehicle fuel exhaustion and was first proposed by Hakimi [Hakimi (1964)].Goodchile et al.[Goodchile and Noronha(1987)] proposed a model combining long-distance and short-distance transportation through the extension of the basic P-median model.Linhave et al.[Lin,Ogden,Fan et al.(2008)] put forward an improved P-median model of reentry into refueling by assuming that any point in the path may become a demand point.The coverage problem is to meet the needs of customers concerning covering all demand points,and the total number of stations or construction costs of the service station is the minimum planning target.It is first proposed by Toregas et al.[Toregas,Swain,Revelle et al.(1971)],and is often used to solve the site selection problem of emergency service facilities.Church et al.[Church and Revelle (1974)] first found the problem of the maximum coverage location.Under the limited number of construction service facilities,the most demanding points were covered.Current et al.[Current,Revelle and Cohon (1985)] first proposed the maximum coverage/shortest path problem to cover as many demand points as possible,and the shortest path from the demand point to the service facility.Besides,Melaina et al.[Melaina and Bremson (2008)] put forward a high-level maximum coverage requirement to meet the fueling needs of the total urban population.
Compared with the spatial approach,the flow-based approach can better fit people’s travel behavior,or in other words,charging consumers are less likely to travel in order to receive services.Instead,they usually tend to receive services by the way [Kitamura and Sperling(1987)].The flow-based approach is an adaptation of 3 kinds of models such as the Flow Capturing location Model (FCLM),the Flow Refueling Location Model (FRLM),and the Capacitated Flow Refueling Location Model (CFRLM).The FCLM proposed by Hodgson in 1990 is the basis of the flow demand model.Hodgson et al.[Hodgson,Rosing and Storrier (1996)] used the model for the morning peak traffic study in Edmonton,Canada,to show that even a simple greedy algorithm can be employed to solve practical problems,and an effective,robust solution can be given.However,the FCLM model still has two major shortcomings.Firstly,the travel O-D data required for the model is difficult to obtain.Secondly,it is only suitable for short-distance travel,and it is difficult to adapt to the case,where the EV may be charged multiple times.For the FCLM model,to ignore the mileage limitation under the energy storage constraints,Kubv et al.[Kuby and Lim (2005)]comprehensively considered the mileage parameters and established the FRLM model.Due to the limitation of mileage,the FRLM model is more complex,but more realistic.Therefore,in many studies,it has been applied to the study of actual road networks [Lee and Han (2017);He,Yang,Tang et al.(2018)].Related studies have shown that the FRLM model can give a more stable and continuous optimization layout [Upchurch and Kuby(2010)].Although the FRLM model is closer to reality,it can only solve the problem of no capacity limitation.The space and energy supply capacity of the supply station is unlimited,and it can serve all vehicles passing through the site at the same time.In response to the capacity limitation of the supply station,Upchurch et al.[Upchurch,Kuby and Lim (2009)]considered the limited capacity factor for correcting the type,and thus the Capacitated Flow Refueling Location Model was obtained.
The various models mentioned above are all single-objective.However,the optimal location of EVCSs is an essentially multi-objective problem [Bapna,Thakur and Nair(2002)].The construction cost of the EVCSs is high,and the capital investment is limited.At the same time,certain service capabilities must be guaranteed to promote the development of EVs.Therefore,multi-objective optimization is also an inevitable choice in the research of the charging station layout.Since the construction of EVCSs in China is often first invested by enterprises,the multi-objective optimization model for the location of EVCSs is very concerned about cost.In this context,in this paper,considering investment cost and user time cost,a multi-objective decision-making approach is proposed.In addition to that,the calculation and calibration methods of the relevant parameters are studied when combined with the user's charging behavior characteristics.The research can provide some theoretical support and technical references for the optimization of the EVCS location layout,which will further enhance the construction of EV charging infrastructure.
Our work contributes to the literature as follows:(1) Establishing a multi-objective optimization model with a full consideration of land cost,construction cost,operation cost as well as other influencing factors like user demands,land locations,emergency mileage limits,actual road conditions and service network reliability;(2) Using the Monte Carlo method to characterize the distribution regularities of EV users’ charging demand;(3)Scientifically quantifying the differentiation of land prices at different candidate sites;(4)Redundant design considering not only charging piles but also charging stations.
The rest of this paper is organized as follows.In Section 2,the formulation of the proposed model is laid down.Then,the simulation environment is described in Section3.In Section 4,computational experiments are discussed,and obtained results are also analyzed.Finally,the conclusion is given in Section5.
2 The system model
2.1 Basic assumptions
In this paper,the optimization of the fast charging facility location is mainly studied in order to meet the emergency charging requirements of urban EVs in the early stage,and when the demand for charging is known,the set of charging demand points has been determined,and the set of candidate EVCSs is known.There are some assumptions of building a mathematical model,as shown below.
(1) Abstract the virtual road network intersection as a demand point,and the number of demand points represents the charging demand;
(2) Each candidate EVCS only provides a fast charging mode,and the upper limit of the number of fast charging piles in their own EVCS is known;
(3) The impact of user-seeking behavior caused by charging demand on the surrounding traffic flow is neglected;
(4) The impact on the same amount of remaining electricity is negligible because of different driving habits and road conditions,and the remaining electricity of the EV is linearly and positively correlated with the remaining history;
(5) There is no capacity limit for the number of parking spaces around each candidate site;(6) The users arrive only within the time when the EVCS provides the service,while the probability is independent of the time,and the arrival situation is independent;
(7) The user arrival time coincides with the service time provided by the EVCS.The charging service is accepted once the EVCS is found,or in other words,there is no possibility of secondary station hunting and station queuing loss.
(8) The users are familiar with the surrounding EVCS location,the road network,the traffic condition,etc.,and can find the shortest path within the reachable range.
2.2 Model constraints
The optimization of the EVCS location can be realized with a multi-objective optimal model,in which 3 constraints,namely ① to meet the user’s fast charging demands;②to meet the EVCS capacity constraints and ③ to ensure the reliability of the service network should be considered.
To ensure the reliability of the service network,the existing researches only consider whether here is a surplus of charging pile capacity that can still meet the charging demand when a small amount of equipment fails.However,there is no solution to the problem that a charging station stops working,which will have a huge impact on the entire charging service network.Therefore,the innovative proposal of this paper not only considers the design of the fast charging pile in one EVCS,but also gives a solution to the redundant design of the entire EVCS networks.
1) To meet the user's charging demands
The primary goal of EVCS location selection is to meet the user’s charging demands.Therefore,we must find a corresponding method to obtain the distribution regularities of those charging demands and set up the prediction model by adopting Monte Carlo and other methods to characterize the distribution of users’ demands.
a.The time probability distribution of EVs’ charging time
According to the survey of household vehicles in Shanghai,the time probability density distribution curve of the EVs that start to charge is obtained by adopting the maximum likelihood estimation method,as shown in Fig.1.

Figure1:The probability density distribution curve of the EV charging time
b.The probability distribution of daily mileage
The distribution regularities of EVs’ daily mileage can be obtained by normalizing the survey data on the daily mileage of private cars (Fig.2).No more than 86% of EVs travel more than 60 km per day.
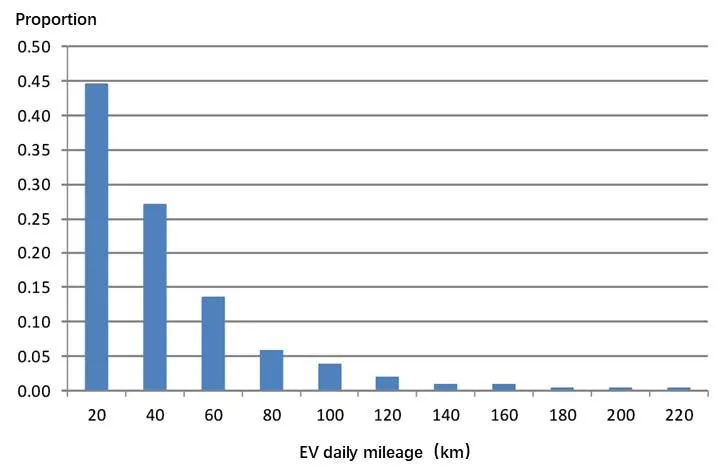
Figure2:The distribution regularities of EVs’ daily mileage
c.The distribution of continuous charging time
Assuming that an EV consumes 15 kWh/100 km,then W=1.609∗15 kWh=24.140 kWh.If charging with power Pcm=8 kw,and setting the charging efficiency to 0.9,the distribution regularities of the continuous charging time can be obtained in the figure.As can be seen from Fig.3,the continuous charging time is mainly distributed within 0-2 hours.

Figure3:The EV’s distribution regularities of continuous charging time
d.The expectation of charging load for a single EV
Using the Monte Carlo method to repeat the simulation experiment several times,the distribution regularities of the expected value concerning the charging load for a single EV are shown in Fig.4.It can be seen that the charging load value reaches the maximum at around 15:00.

Figure4:The one-day distribution of fast charging load expectation
Based on the distribution regularities of the above charging requirements,the user’s charging demands should be satisfied from the following 3 aspects:
(1) Users can only receive charging services when an EVCS is available at one candidate site.

where yijindicates the ratio of receiving service from demand point i at EVCS j.The value ranges from 0 to 1;Zjindicates whether EVCS j is established (Zj=1) or not(Zj=0).
(2) Users can only receive charging services within the reach of emergency charging miles.

where dijdenotes the travel length from demand point i to EVCS j (km);dmaxrefers to the emergency charging mileage (km).
(3) All users’ charging demands can be satisfied.

where yijdenotes the ratio of receiving service from demand point i at EVCS j.
2) To meet the EVCS capacity limit
(1) Conditional restrictions for deploying fast charging piles

where,mjindicates the number of charging piles in candidate EVCS j;Zjindicates whether EVCS j is established (Zj=1) or not (Zj=0).
When the EVCS is not built at point j,that is,Zj=0,mjcan only take a value of 0 if the inequality is established.Therefore,it can satisfy the constraint that the fast charging piles can only be deployed at the selected candidate EVCSs.
(2) The number range of fast charging piles
According to the “EVCS Design StandardGB50966-2014”,one EVCS should be equipped with at least 3 charging devices.However,the concentrated charging can cause great pressure on the local power grid.At the same time,more charging piles will increase investment cost accordingly.Therefore,in one EVCS there is an upper limit value nj.

(3) Charging service capacity in a single EVCS
The maximum charging service capacity should exceed all charging demands for the number of charging piles is limited.

where ωiindicates charging demands of point i;μjrepresents the average service capacity per unit time in EVCS j (pcu/h),and tcis the time of service provided by EVCS within one day (h).
3) To ensure the reliability of the service network
According to the above analysis,not only the redundant design of the charging pile but also the redundant design of the entire charging station is taken into account innovatively in this paper.
(1) Charging pile surplus design
If the charging pile fails,that is,the user’s charging demands cannot be fully satisfied,a redundant design with a parameter of σ is set for each EVCS to provide additionalcharging service capabilities.

where σ denotes the surplus level of the charging station capacity,and other parameters are defined above.
(2) Charging station surplus design
When there is something wrong with the power grid or during the maintenance of large facilities,the entire EVCS will not be able to provide charging services.In order to ensure that the rest of the stations can make it,set δ serves as the EVCS collection in the layout scheme (δ ∈ J),and δφis the set after removing the station φ (φ is a sequence of positive integers,and the maximum value is the total number of EVCS in δ).Then ∀φ must be satisfied.

2.3 Charging station location layout optimization model
This paper aims to establish a multi-optimization model for the optimal location layout of candidate EVCSs,with the dual objectives of the minimum investment cost and the minimum user time cost.
1)Minimum investment cost
Minimizing the investment cost is one of the objective functions of candidate EVCSs optimization.The accounting of the investment cost mainly includes the land cost,the construction cost and the operation cost.The differences in land prices of different candidate sites will be scientifically quantified,which is one of the major innovations in the paper.
a.Land cost accounting
In the occupation of urban land resources to construct EVCSs,the land cost accounts for a large proportion.The land prices vary because of locations and the degree of prosperity.Therefore,it is necessary to differentially calculate the land price of each candidate site based on its location.In accordance with the “Urban Land Valuation Regulations(GB/T18508-2014)”,the actual land price is revised at a certain benchmark land price.The Formula 9 for the calculation is as follows.

in which j denotes the number of candidate stations;Cj1denotes the land cost for the candidate station j (ten thousand yuan);sjdenotes the floor space of the station j;Vjdenotes the land benchmark land price (ten thousand yuan/m2);kjadenotes the land parcel price correction factor;kjβdenotes other correction factors such as the land valuation date,the floor area ratio,and the land use period;Djdenotes the land development intensity correction factor.b.Construction and operation cost
The construction cost Cj2mainly includes the cost of purchasing charging piles and supporting construction.It is linearly positively correlated with the number of charging piles in the station.The more the number of charging piles mjis,the higher the construction cost Cj2is,as shown in Eq.(10).The operation cost Cj3mainly includes the cost of equipment consumption,maintenance labor and equipment maintenance,which are calculated according to a certain conversion factor γ as shown in Formula (11).

Because the land cost and the construction cost are fairly large and the operation period generally lasts as long as 10 years,the actual value of cash flow varies greatly.Therefore,the conversion coefficient T should be taken into consideration in the calculation by introducing the concept of the discount rate r0,and the operating life n to the model.

Combined with Formulas 9-12,the minimum objective function of the annual total investment cost is as follows.

2)Minimum user time cost
The user time cost consists of two parts:the travel time cost on the road and the waiting time cost in the station.Firstly,according to the emergency charging mileage,the set of EVCSs that can reach each demand point is divided,and then the time load distance method is employed for traffic distribution,that is,the probability that the user selects an EVCS is inversely proportional to the time of the arrival at the station.a.travel time on the road
The travel time on road refers to the total time taken by the user from looking for the charging station to reaching the EVCS.It is assumed that the road conditions and the average traveling speed are the same,that is,the shortest travel time matrix is obtained without considering the congestion effect.

where Tlis the total travel time spent by all users looking for an EVCS (hour);tijis the travel time from i to j (hour);ωiindicates charging demands of point I,and yijis the ratio of receiving services.
b.waiting time in the station
The EVCS can be regarded as a queuing system,and the expected queuing time of the charging station j can be calculated by using the M/M/c/∞ queuing system theory.
User arrival frequency:

The average service capacity per hour:

The service intensity of the queuing system:

The probability that all charging piles are idle:

The expected queuing time:

The total time that all users spend waiting to receive services can be calculated according to the following formula.

where tcis the time of service provided by the EVCS within one day (hour);tfis the average charging time per car (hour/car),and mjis the number of charging piles in EVCS j.Combined with Formulas 14-20,the minimum objective function of the total user time cost is as follows:

in which,clis the user’s unit travel time cost (ten thousand yuan/hour)
3) Multi-objective optimization model
Two objective functions are proposed in this paper,namely,the minimum investment cost and the minimum user time cost,which can be combined into a bi-objective programming function.The Formulas 22-31 constitute an optimization model for the location layout of EVCSs.
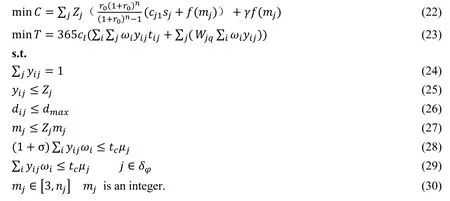

Zjindicates whether EVCS j is established (Zj=1) or not (Zj=0).
3 Simulation environment
3.1 EVCS floor space (sj)
The floor space of an EVCS is mainly related to the form of its spatial layout and the number of related facilities.This paper draws on the relevant provisions of the “Electric Vehicle Charging Station Design Standard (GB 50966-2014)”,and the floor space is calculated according to the layout form in Fig.5.

Figure5:The EVCS layout form from GB 50966-2014
a) The EVCS spatial layout;b) Dimensional calibration (unit:m)
The floor space of the charging zone:

The charging parking spaces are symmetrically arranged in a single row,and therefore the number of charging piles mjis an even number.The upward integer function is introduced,and the area of the charging zone contains the number (2 mj/2) of charging spaces.The size of each charging space is 2.5×6=15 m2.
The total area of the charging zone in an EVCS is sj1.sj1=15 × 2 mj/2
According to the size calibration in the figure,the floor space of the carriageway in the EVCS is sj2.

The EVCS is composed of a charging zone,an in-station carriageway and a supporting facility area in which the area sj3is about 350 m2.A total EVCS floor space sjcan be calculated as follows.

3.2 Emergency charging mileage (dmαx)
The state of charge (SOC) is variouswhen different users recharge.A statistical analysis of users purchasing EVs shows that more than 96% of users will choose to charge when SOC is more than 20%.Therefore,the value of emergency charging mileage is based on a 20% SOC.Assuming a linear positive correlation between SOC and the remaining mileage,the formula for calculating the emergency charging mileage is shown in Eq.(35):

in which,drangedenotes EV’s cruising range (km).
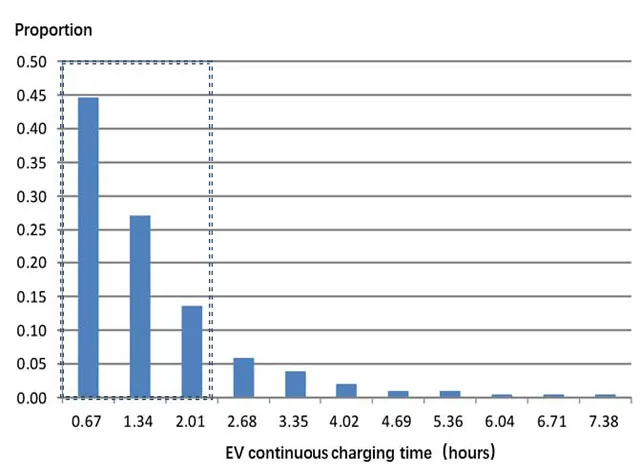
Figure6:SOC distribution at the charging start time
3.3 Maximum number of fast charging piles at candidate EVCSs (nj)
The large current transmission at a time and in one space can put a lot of pressure on the local power grid.Therefore,it is necessary to determine how many fast charging piles should be set based on the grid limit and surrounding land utilization.The number of charging piles of 25 EVCSs was investigated in Shanghai.The distribution and cumulative frequency are statistically analyzed in Fig.7,in which the number of fast charging piles in more than 90% of charging stations does not exceed 10.Therefore,the reasonable maximum number of fast charging piles for candidate EVCSs was set to 10,that is,the value of njis 10.
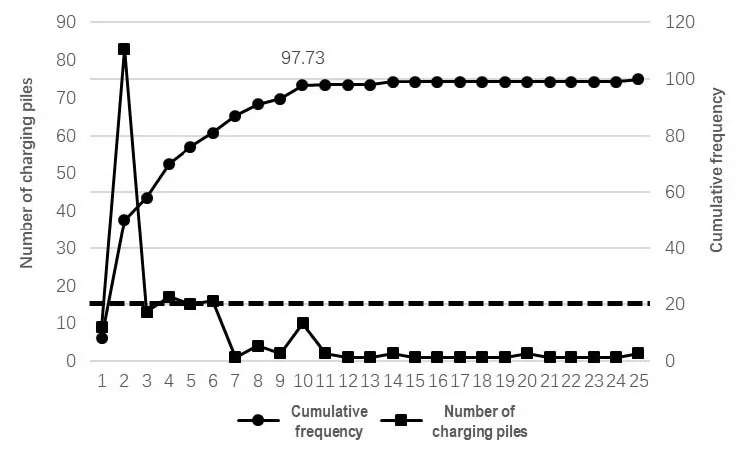
Figure7:The distribution and cumulative frequency of fast charging piles
4 The computational experiment
4.1 Test networks
The actual road network features are expressed in mathematical language:the edges in the topology map represent road segments,and the points represent the intersections.The candidate EVCSs are mainly laid out on the arterial roads.This computational experiment is mainly designed to verify the feasibility and effectiveness of the multi-objective optimization model.

Figure8:Demand points and candidate EVCSs’ locations in the road network topology In Fig.8,the solid dots in the above figure represent 30 EV charging demand points,while the solid squares represent the locations of 10 candidate EVCSs.The quantity demands of 30 EV charging demand points are shown in the table below.
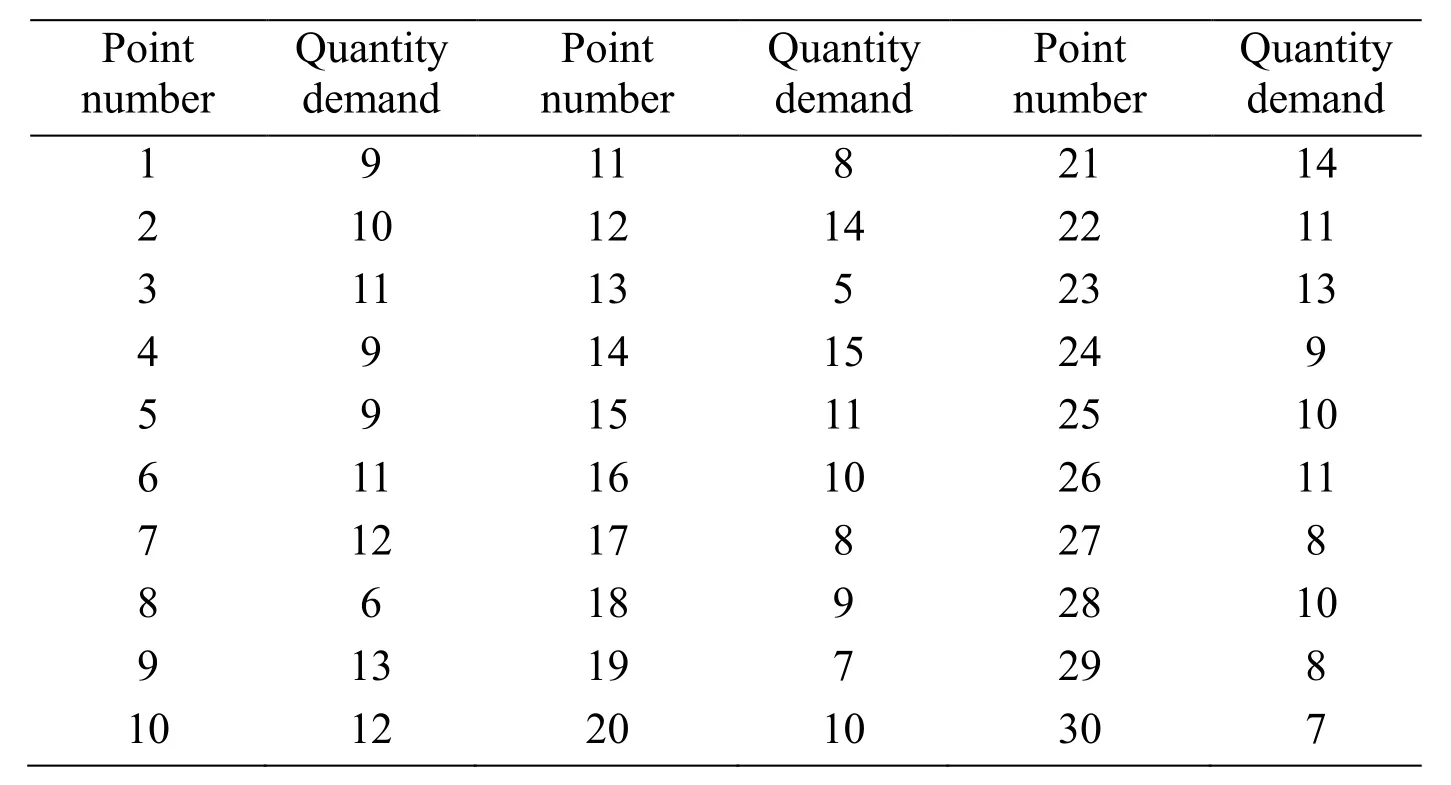
Table1:The quantity demands of 30 EV charging demand points
4.2 Parameter analysis
1) Land price per unit area
The reality is that the closer the land to the city center,the higher the level of land development and the better the infrastructure.The case area is divided into six levels,as shown in Fig.9,and the benchmark land price for each land level is shown in Tab.2.

Table2:The land level and the unit land price cj1 of each candidate EVCS
The correspondence between the road location and the land price distribution is shown in Fig.9 by combining the road network topology and the land level division map.

Figure9:The correspondence between the road location and the land price distribution
There are two principles in determining the land level to which each road segment belongs.
① When the road section locates at the boundary of two land levels,the level of this section should follow the higher one.② When the road section spans several land levels,if it crosses the core area,it is calculated according to the highest land level;if not,according to the one with the highest proportion in the section.
2) travel time from demand points to candidate EVCSs
According to the above principle,the average travel speed of each road section can be determined in Tab.3.For the description,the first and last node numbers of the road segments are used for explanation.
The adjacency matrix of the link length is obtained by batch measurement of the road network topology.In combination with the road speedometer 5,the ratio of the length to the speed is the travel time of each road segment.The shortest path assignment is performed based on the adjacency matrix of the link length and the time matrix.The shortest travel time from demand points to candidate EVCSs is shown in Tab.4.
4.3 Solutionmethodforthemodel
Since the EVCS location problem is the NP-hard problem,a heuristic algorithm instead of an exact algorithm was adopted.A generic solution to the multi-objective optimization problem is the genetic algorithm [Wang,David,Ochoa et al.(2011)].Genetic algorithms generate solutions to optimization complex problems using techniques inspired by natural evolution,such as inheritance,mutation,selection,and crossover [Chen,Kockelman and Khan (2012)].In the Matlab programming process,the crossover rate of Pcis 0.6;the mutation rate Pmis 0.1;the population size N is 20,and the maximum number of evolutions T is 200.

Table3:The generic solution step for the optimal EVCS location model
4.4 Discussion
The bi-objective programming function can be converted to a single-objective programming function by a linear weighting method,which will produce three optimal target scenarios (see Tab.4).The total investment cost results obtained by the program are compared with the sum of the cost of each item,which shows that the error is 6.4‰ within an acceptable range.
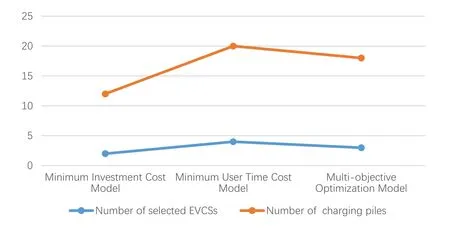
Figure10:Optimal charging facility size in different models

Table4:Results of 3 optimal target scenarios (ten thousand yuan/year)
Tab.6 and Fig.10 illustrates that the optimal charging facility size needs to be the largest with 4 selected EVCSs and 22 charging piles when the objective function is the minimum user time cost.When the investment cost is the lowest,the optimal charging facility size will be reduced to 2 EVCSs and 12 charging piles.The number of charging facilities of multi-objective optimization is intermediate because the above two optimal objectives are considered comprehensively.

Figure11:The layout structure of EVCSs among different optimal objectives
Fig.11 reveals that the layout structure of the charging station changes among different optimal objectives.When the optimal objective is the minimum user time cost,the optimal positions of EVCS (3,4,7,and 9) cover most of the road sections with more charging demands.The optimal goal is that when the investment cost is the lowest,the optimal positions (2,9) are mainly located in the IV and VI areas where the land price is cheaper.In general,the heterogeneity of charging demands and the differences in traffic accessibility makes the layout density of the charging station,especially the charging pile,differ from the service range.As the population density and traffic accessibility decrease,the density of charging stations and piles also decreases,and tends to decrease from downtown to suburbs.
The results of these three optimization models are characterized by good stability,as the candidate points (2) (3) (7) were selected twice,which is exactly the result of the multiobjective optimal model.This indicates that once the multi-objective optimal scheme is implemented,the EVCSs construction in the initial stage can still meet the charging needs in the future with the development of EVs.

Figure12:Comparison of various costs among different optimal objectives
As can be seen from the Fig.12,the minimum investment cost model has the lowest investment cost,but brings a huge increase in the user time cost.While the minimum user time cost model has the highest investment cost,which in turn reduces the time spent by users.Therefore,there is a clear mutual constraint between these two optimal goals.
From the perspective of urban planners,it is necessary to take into account the high construction cost of EVCS,ensure the utilization of the charging piles,and also make the EV users feel convenient and spend as little time as possible.And the EVCS construction should also be forward-looking to meet the needs of the future development.Therefore,the multiobjective optimization model can balance the interests of both users and investors,and more effectively meet the above-mentioned requirements.
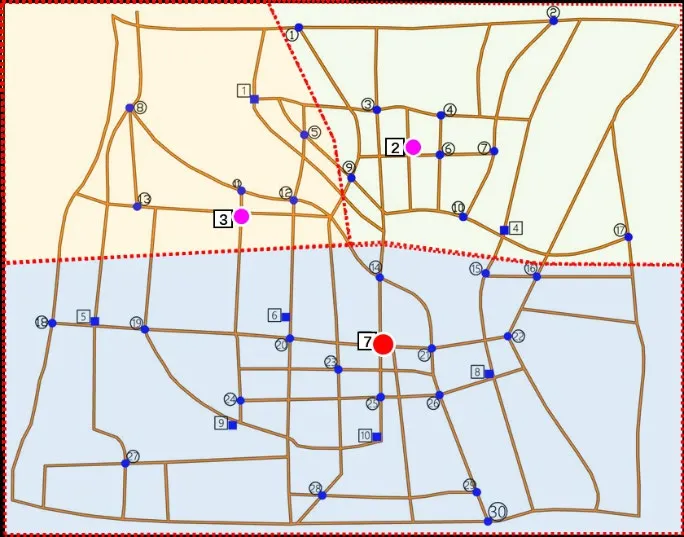
Figure13:The optimal EVCSs layout of the multi-objective optimal model
The multi-objective optimization model is the most ideal solution with 3 selected charging station positions (2,3,and 7).Position 7 can radiate to a large number of demand points because of its central location,and has 10 charging piles,which can be considered as highlevel charging stations.The other two charging station positions (2) and (3) are configured with 5 charging posts,which can be regarded as sub-level charging stations.
This paper simulates the initial stage of EVCS construction where the charging demand is greater than the supply of charging services,and as a result,some customers cannot obtain charging services.In this case,the sub-level charging station can be placed outside the service area of the high-level charging station for more users.
The figure can also reflect the differences in the scope of EVCS services from two aspects.On the one hand,the service range of the EVCS is not a regular hexagon;on the other hand,the service range of the sub-level charging station is limited due to factors such as user bypass distance and battery life.
4.5 Future work
The research content and results can be improved in the future,and our future work will mainly focus on the following aspects.
a.This paper focuses on the initial stage of EV promotion,assuming that the proportion of EVs in total road traffic is quite small.However,as the number of EVs increases,it is necessary to further consider the congestion effect of traffic flow caused by charging demands on road traffic.
b.In order to highlight the research focus,less power factors are considered in this paper.However,when the EVs promotion steps into a mature stage,the charging demand will increase,and the layout of the EVCS will have a relatively significant impact on the local power grid.Therefore,it is imperative to consider the power factor in further research.
5 Conclusion
The location layout model of urban charging facilities constructed in this paper comprehensively considers various factors such as user demand,the investment cost,soil locations,emergency charging mileage and service network reliability,and comprehensively reflects the problems of building charging stations.
Combined with the user's charging behavior characteristics,the calculation and calibration methods for the relevant parameters of the model have been studied.Based on these goals,the mixed integer linear programming model was first employed to determine the constraints and the objective function.Since the placement problem is the NP-hard problem,the heuristic algorithm instead of an exact algorithm was adopted,which did not work for many variables and constraints.Finally,simulation results in the MATLAB demonstrate that the proposed locating method is effective and practical.
At the same time,the solution results of the example also show that the proposed multiobjective programming model can take into account the interests of users and planners,conforms to relevant policy norms,and has strong practical significance.
Acknowledgments:This work was supported by the Natural Science FoundationofChina(51608473,61772454,71871144),the Shanghai philosophy and social science planning project (2017ECK004) and the research fund climbing program of humanistic and social science from University of Shanghai for Science and Technology (SK18PB05).Prof.Jin Wang is the corresponding author.
杂志排行
Computers Materials&Continua的其它文章
- A Capacity Improving Scheme in Multi-RSUs Deployed V2I
- Multi-Rate Polling:Improve the Performance of Energy Harvesting Backscatter Wireless Networks
- A Novel Scene Text Recognition Method Based on Deep Learning
- Fuzzy C-Means Algorithm Automatically Determining Optimal Number of Clusters
- Ab Initio Molecular-Dynamics Simulation Liquid and Amorphous Al94-x Ni6 Lax (x=3-9) Alloys
- Robust Re-Weighted Multi-View Feature Selection
