Characterization of structural transitions and lattice dynamics of hybrid organic-inorganic perovskite CH3NH3PbI3∗
2019-08-06FengJin金峰JianTingJi籍建葶ChaoXie谢超YiMengWang王艺朦ShuNaHe贺淑娜LeiZhang张磊ZhaoRongYang杨昭荣FengYan严锋andQingMingZhang张清明
Feng Jin(金峰), Jian-Ting Ji(籍建葶), Chao Xie(谢超), Yi-Meng Wang(王艺朦), Shu-Na He(贺淑娜),Lei Zhang(张磊), Zhao-Rong Yang(杨昭荣), Feng Yan(严锋), and Qing-Ming Zhang(张清明),5,†
1Department of Physics,Renmin University of China,Beijing 100872,China
2Beijing National Laboratory for Condensed Matter Physics,Institute of Physics,Chinese Academy of Sciences,Beijing 100190,China
3Department of Applied Physics,The Hong Kong Polytechnic University,Hung Hom,Kowloon,Hong Kong,China
4High Magnetic Field Laboratory,Chinese Academy of Sciences,Hefei 230031,China
5School of Physical Science and Technology,Lanzhou University,Lanzhou 730000,China
Keywords: x-ray diffraction,Raman scattering,hybrid organic-inorganic perovskite
1. Introduction
A perovskite(ABX3)is a material that has the same crystal structure as the mineral calcium titanium oxide. In perovskites, the A site cation is at the center of a cube formed by the corner-sharing BX6octahedra. Depending on the atoms/molecules used in the structure, perovskites often display various interesting properties,[1,2]including giant magnetoresistance and superconductivity. These intriguing and unusual physical properties enable the potential applications of perovskites in sensors,memory devices,spintronics,and solar cells.
Recently, the hybrid organic-inorganic perovskite solar cells have attracted tremendous attention due to the incredible device efficiency improvement from 3.8% to 22.1%since 2009.[3,4]Among them, methylammonium lead iodide(MAPbI3, where MA represents the CH3NH+3cation) is the most relevant hybrid halide perovskite for photovoltaic applications due to its many advantages, such as the long carrier diffusion lengths,[5,6]widely-tunable band gap,[7]and lowcost fabrication techniques. The transitions from orthorhombic (T <TO=165 K) to tetragonal (165 K <T <327 K)and then to cubic (T >TC= 327 K) perovskite structures in MAPbI3have been studied by tremendous temperaturedependent[8-11]and time-resolved experiments.[12-14]According to previous studies,the band gap of MAPbI3exhibits a linear blueshift with increasing temperature.[11,15]This counterintuitive blueshift behavior cannot be described by the traditional empirical Varshni,[16]P¨assler,[17]and Bose-Einstein[18]models, which exhibit a redshift with increasing temperature(T)and are commonly used to describe the temperature dependence of the band gap for the conventional semiconductors. It is suggested that this blueshift of the band gap may be related to its negative thermal expansion, which has opposite effects on the band gap energy.[11]
The structure of MAPbI3has been studied by various xray and neutron diffraction measurements.[19-22]In the previous x-ray measurements,[20]the temperature dependence of the lattice parameters had been reported between 300 K and 360 K. However, the T-dependent lattice parameters appear unreliable because the tetragonal distortion parameter is smaller than unityat 300 K), which is inconsistent with the correspondence of the transitions from cubic to tetragonal structures to the elongation of the PbI6octahedra along the c axis. Recently, the temperature dependence of the lattice parameters was reported through neutron diffraction measurements.[22]However,a reliable temperature dependence of the lattice parameters from x-ray measurements is still lacking,and these data will form the basis to understand the blueshift of the band gap and its high conversion efficiency.
In this paper, we performed T-dependent x-ray diffraction (XRD) and Raman scattering to characterize the structure and lattice dynamics of CH3NH3PbI3. The XRD measurements give the temperature dependence of the lattice constants between 15 K and 370 K, which shows the normal positive thermal expansion, except at approximately the tetragonal-orthorhombic and cubic-tetragonal transition temperatures (160 K and 330 K, respectively). The temperature evolution of the lattice constants indicates that the transition at 160 K(330 K)is of the first(second)order type. The Raman measurements uncover three low-frequency modes,which can be ascribed to the vibration of the Pb/I atoms.The temperature evolution of these modes clearly catches the above transitions at 160 K and 330 K and confirms the transition types, which are exactly consistent with the XRD results. The results are the first step to understand the blueshift of the band gap and the high conversion efficiency in CH3NH3PbI3.
2. Experiments and methods
MAPbI3single crystals were grown using the reported method.[23]The temperature-dependent powder XRD measurements were performed on a Rigaku-TTR3 x-ray diffractometer with high-intensity graphite monochromatized Cu Kα radiation. The temperature was varied by using a closed Hegas cycle refrigerator.The diffraction data were processed and fitted using the standard Rietveld techniques with the general structure analysis system(GSAS)program[24]and the crystal structure model given in Ref.[25]. The hydrogen atoms were ignored due to their poor contribution to the scattering.
The Raman spectra were collected with a LABRAM HR800 system, which was equipped with a single grating of 800 mm focus length and liquid-nitrogen-cooled CCD. Approximately 1 mW of laser power at 632.8 nm was focused into a spot with a diameter of ~5 µm on the sample surface.For all of the Raman measurements,the cleaved samples were placed in a UHV crystat with a vacuum of ~10-8mbar.
3. Results and discussion
The low-temperature orthorhombic phase (T <TO=165 K, Pnma) is shown in Fig. 1(a). In this phase, all atoms(including the MA/CH3NH+3cations)are fully ordered.With increasing temperature, MAPbI3experiences a firstorder phase transition to the tetragonal phase (I4/mcm) at approximately 160 K and a second-order phase transition to the cubic phase(Pm¯3m)at approximately 327 K.[20,21]In the tetragonal phase, the MA cations are no longer ordered with each cation having two nonequivalent positions(see Fig.1(b));in the cubic phase, the ordering of the MA cations is further released with each cation having eight nonequivalent positions(see Fig.1(c)).

Fig. 1. Crystal structures of CH3NH3PbI3 in the (a) orthorhombic, (b) tetragonal, and (c) cubic phases. The left and right panels are viewed from the 〈100〉 and 〈001〉 directions, respectively. The powder XRD patterns and final Rietveld refinement profiles for CH3NH3PbI3 in the(d)orthorhombic(100 K),(e)tetragonal(300 K),and(f)cubic(350 K)phases.
To uncover the T-dependence of the lattice parameters, we performed T-dependent XRD measurements on the MAPbI3samples.The XRD patterns and Rietveld refinements for the samples in the orthorhombic phase (100 K), tetragonal phase (300 K), and cubic phase (350 K) are shown in Figs. 1(d)-1(f). No additional peak is observed, which indicates that other impurity phases are negligible in the samples. Through the Rietveld refinements,one can quantitatively obtain the temperature-dependent behavior of the lattice constants.
Figure 2(a) displays the temperature-dependence of the lattice constants across the cubic-tetragonal transition. To compare with the cubic phase,we show the lattice constants in the tetragonal phase with a∗=and c∗=ctet/2, since the tetragonal structure is asupercell expansion of the cubic perovskite unit cell. In the cubic phase, lattice constant a decreases monotonically with decreasing temperature, indicating that MAPbI3has a normal positive thermal expansion. When the crystal transforms into the tetragonal phase, lattice constant a∗along the (100) direction is no longer equal to lattice constant c∗along the(001)direction as constant c∗decreases and constant a∗increases monotonically with increasing temperature. It should be noted that the decrease of the lattice constant c∗should not be related to the band gap blueshift because the blueshift is also observed in the orthorhombic phase where the lattice constant c∗exhibits a normal positive thermal expansion. The nonequivalence of a∗and c∗is reflected by the splitting of the (100) reflection peak(see Fig.2(b)),which exhibits two Bragg peaks of(002)and(110)at the tetragonal phase.
Figure 2(b)shows that the(100)peak continuously splits.To display this continuous behavior, we show c∗-a∗in Fig. 2(c), which can be considered as the order parameter of the cubic-tetragonal transition. The order parameter can be well described by the following relation:
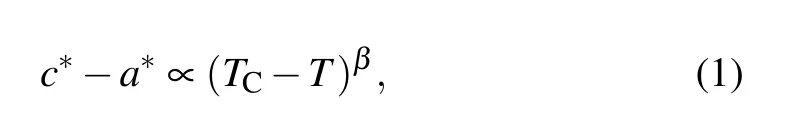
where the fitted transition temperature is 320±12 K,and the exponent is β =0.43±0.09. Moreover, accompanying the cubic-tetragonal transition,the superlattice reflections appear in the tetragonal phase, and the intensity of these peaks can also be considered as the order parameter of the transition.The intensity of the (211) peak, which is sufficiently separated from the expected Bragg reflections in cubic symmetry (see Fig. 2(d)) and is shown in Fig. 2(c), shows a similar T-dependent behavior to that of c∗-a∗. The continuous T-dependent behaviors of c∗-a∗and the intensity of the superlattice reflections indicate that the cubic-tetragonal phase transition is of the second-order type.and c∗=ctet/2. (b)Temperature evolution of the(100)diffraction peak. (c)Temperature dependence of parameters c∗-a∗and the intensity of the(211)peak. The red line is the fitting curve using(TC-T)β. (d)Temperature evolution of the(211)diffraction peak in the XRD pattern.
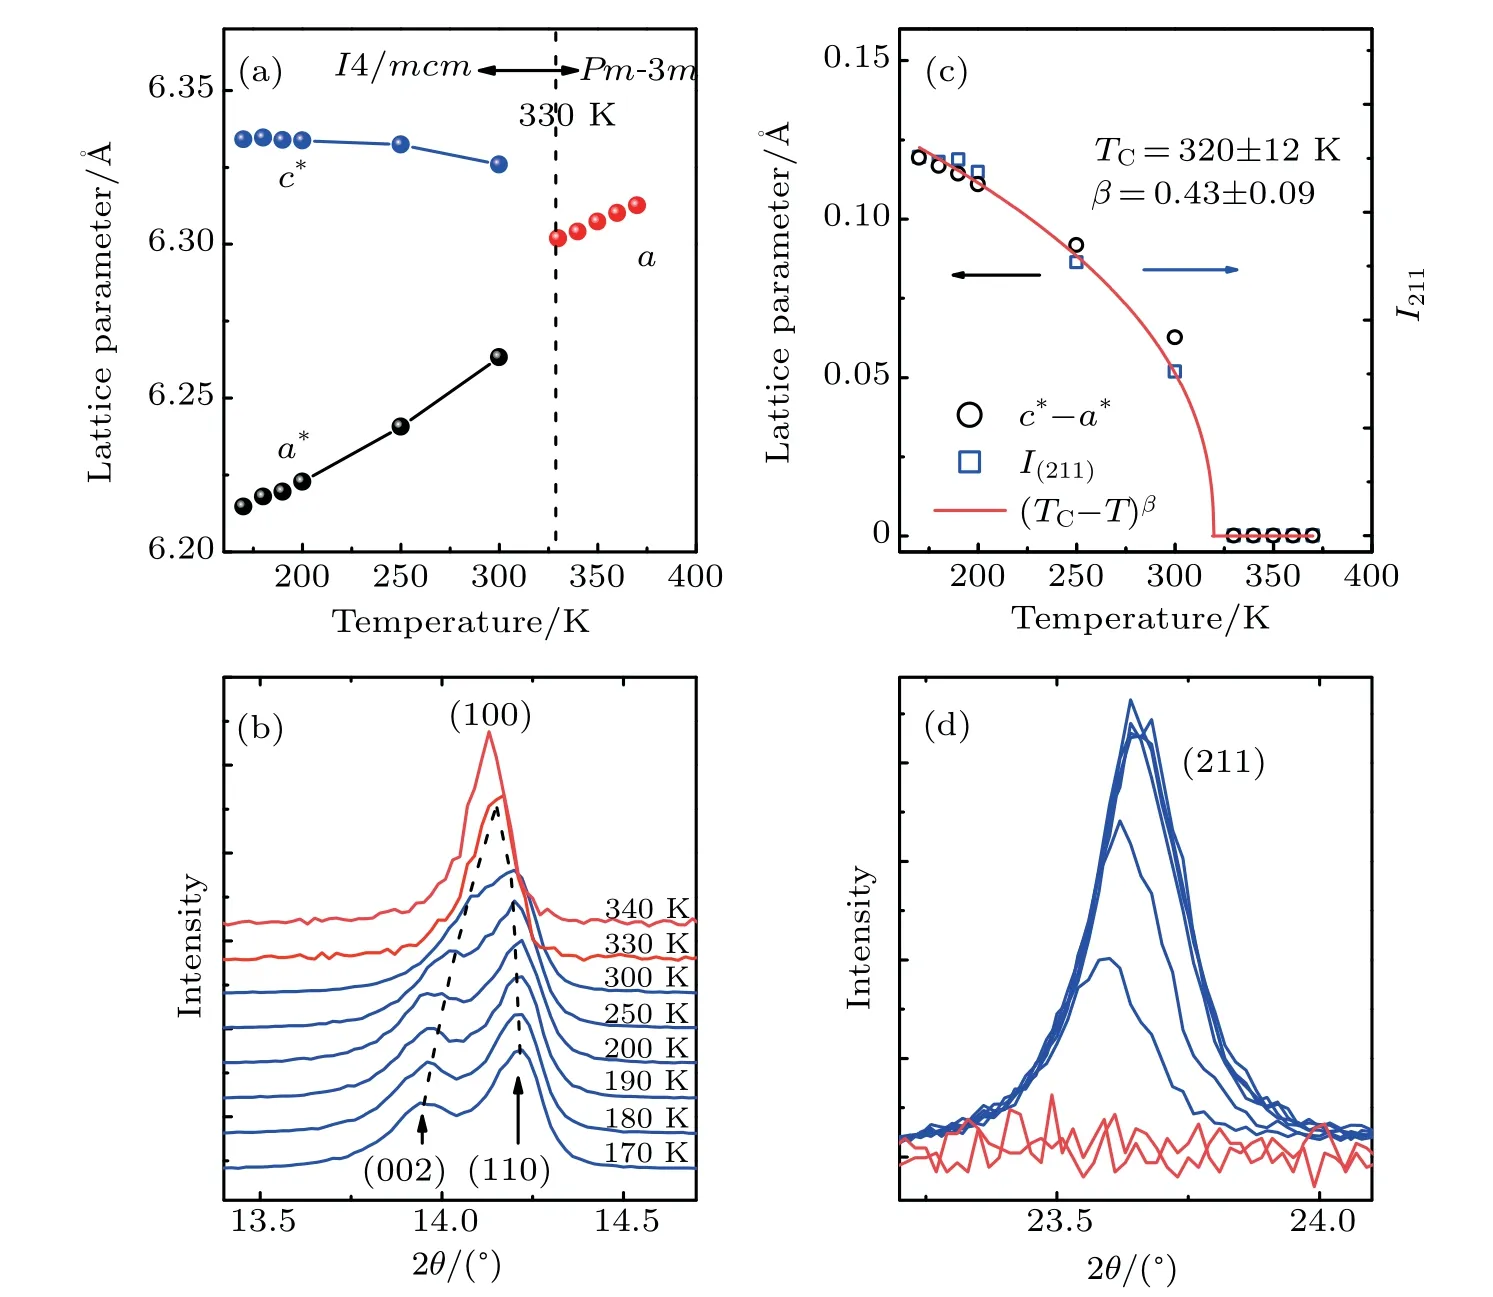
Fig.2. (a)Temperature dependence of the lattice constants across the cubic-tetragonal transition. The lattice constants in the tetragonal phase have been converted to their pseudo-cubic parameters using the relationships a∗=atet/
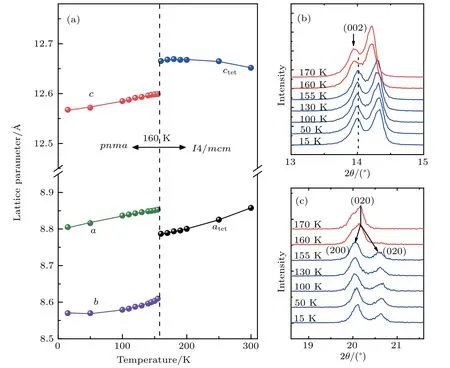
Fig.3. (a)Temperature dependence of the lattice constants across the tetragonal-orthorhombic transition. Temperature evolution of the(b)(002)and(c)(020)diffraction peaks.
The temperature-dependence of the lattice constants across the tetragonal-orthorhombic transition is shown in Fig. 3(a). In the orthorhombic phase, lattice constants a/b/c monotonically increase with increasing temperature,which indicates that MAPbI3has a normal positive thermal expansion.At approximately 160 K, the constants exhibit a sudden shift with constant c upshifting and a and b becoming equivalent.The upshift of c is reflected by the sudden shift of the (002)Bragg reflection across the transition temperature ~160 K(see Fig.3(b)). Meanwhile,the splitting of the lattice constant atetis reflected by the sudden split of the (020) Bragg reflection at approximately 160 K(see Fig.3(c)). The observed sudden change of the lattice constants indicates that the tetragonalorthorhombic phase transition is of the first-order type.
We further performed T-dependent Raman measurements to character the structure phase transition in MAPbI3,the spectra are shown in Fig. 4(a). Since the high-frequency spectra are mainly due to the internal vibration of the MA/CH3NH+3cations,we focus on the low frequency spectra(<100 cm-1)here,which are dominated by the vibration of the Pb/I atoms.At 30 K,at least three strong phonon modes(labeled as P1,P2,and P3) are observed at ~26 cm-1, 32 cm-1, and 48 cm-1,respectively. These modes are ascribed to the vibration of the Pb and I atoms due to their low energies. With increasing temperature and across the transition temperature of 160 K,the P1 and P2 modes merge into one mode(P4), while the P3 mode becomes the P5 mode. These evolutions suggest that the P4 mode is a double-degenerate mode.
To quantitatively obtain the T-dependent behavior of these modes,we made careful Lorentz fitting for these modes and summarize the fitting results in Fig.4(b)and the inset of Fig. 4(a). In the orthorhombic phase (T <160 K), the evolution of the Raman frequency with temperature can be described by the inharmonic phonon decay model. This result suggests that MAPbI3has a normal positive thermal expansion; hence, the blueshift of the band gap is not due to the negative thermal expansion. Crossing the transition temperature of 160 K, the P1 and P2 modes merge into one mode P4, where their linewidth exhibits a huge up-jump (see the inset of Fig. 4(a)). The jump of the linewidth implies an alternative relaxation mechanism and should be ascribed to the order-disorder transition of the MA cations. In the tetragonal phase(T >160 K),the frequency and intensity of the P4 mode rapidly decrease and approach zero with increasing temperature. These evolutions suggest that the P4 mode can be considered as the soft mode of the cubic-tetragonal transition. It is known that the soft mode is a typical mode of the secondorder ferroelectric transition.[27]The observation of the P4 soft mode indicates that the cubic-tetragonal transition is of the second-order type, which is consistent with the above XRD measurements.

Fig.4. (a)Temperature-dependent Raman spectra of MAPbI3. Inset shows the temperature dependence of the linewidth of the P1,P2,and P4 modes. (b)Temperature dependence of the frequencies of the observed phonon modes. The black line is the fitting curve using the inharmonic phonon decay model.[26]
4. Conclusion
In summary, temperature-dependent XRD and Raman scattering studies of CH3NH3PbI3were performed. The temperature evolution of the lattice constants and the lowfrequency Raman modes suggests that the lattice shows a normal positive thermal expansion except at the tetragonalorthorhombic and cubic-tetragonal transition temperatures(160 K and 330 K, respectively). Moreover, the behaviors of the lattice constants and the low-frequency Raman modes across the transition temperatures indicate that the tetragonalorthorhombic(cubic-tetragonal)transition is of first(second)order type. The present study provides an experimental basis to understand the blueshift of the band gap and the high conversion efficiency in CH3NH3PbI3.
猜你喜欢
杂志排行

Chinese Physics B的其它文章
- Coercivity mechanisms in nanostructured permanent magnets∗
- Progress in recycling of Nd-Fe-B sintered magnet wastes∗
- Grain boundary restructuring and La/Ce/Y application in Nd-Fe-B magnets∗
- Topology of triple-point metals∗
- Local evolutions of nodal points in two-dimensional systems with chiral symmetry∗
- Structural,elastic,and electronic properties of topological semimetal WC-type MX family by first-principles calculation∗