Grain boundary restructuring and La/Ce/Y application in Nd-Fe-B magnets∗
2019-08-06MiYan严密JiayingJin金佳莹andTianyuMa马天宇
Mi Yan(严密), Jiaying Jin(金佳莹), and Tianyu Ma(马天宇)
School of Materials Science and Engineering,State Key Laboratory of Silicon Materials,
Key Laboratory of Novel Materials for Information Technology of Zhejiang Province,Zhejiang University,Hangzhou 310027,China
Keywords: grain boundary restructuring,coercivity,corrosion resistance,Dy/Tb,La/Ce/Y
1. Introduction
Nd-Fe-B, the icon of permanent magnetic material, has long served as an indispensable component in household and industrial sectors, given its large maximum energy product(>400 kJ/m3)approaching the theoretical limit.[1-3]The high susceptibility to corrosion attack, however, severely blocks the use of Nd-Fe-B magnets in corrosive environments. Besides, the room-temperature coercivity of ~1.2 T is too low for applications in electric vehicles and wind turbines due to the thermal demagnetization at elevated temperatures.[4]Incorporating scarce heavy rare earth (RE) Dy/Tb into the 2:14:1 lattice can enhance the coercivity, however, it causes inevitable remanence reduction and cost increment. Additionally, the large backlog of high-abundant and inexpensive La/Ce/Y[5-9](by-products of Nd/Pr/Dy/Tb during mineral extraction) due to the inferior magnetic properties of(La/Ce/Y)2Fe14B to Nd2Fe14B[4-18]is another longstanding bottleneck for balanced utilization of RE resources.[19-23]This review aims to present our achievements concerning the four above-mentioned obstacles in 2:14:1-typed Nd-Fe-B magnets.
2. Grain boundary restructuring of Nd-Fe-B sintered magnets
2.1. Fundamentals of grain boundary restructuring
2.1.1. What is grain boundary restructuring
The Nd-Fe-B sintered magnets possess multi-phase morphologies, including the ferromagnetic Nd2Fe14B matrix phase(P42/mnm)and the intergranular Nd-rich grain boundary (GB) phase. The standard electrode potential of the Ndrich phase is much lower than that of the Nd2Fe14B one,being the main driving force for the electrochemical corrosion.[24-28]After a preferential dissolution of the chemically active Ndrich phase, loosened 2:14:1 matrix phase grains detach from the bulk magnets,resulting in poor corrosion resistance of Nd-Fe-B magnets. According to the generally accepted domain reversal mechanism, reversed domains primarily nucleate at Nd-rich GB regions with microstructural defects and locally low anisotropy,[29]i.e.,discontinuous Nd-rich GB phase,nonstoichiometric composition, as well as rough Nd2Fe14B/Ndrich interface.[30,31]Consequently,the practical coercivity Hcjis far below the theoretical value (7.3 T at room temperature,magnetocrystalline anisotropy field HAof the Nd2Fe14B phase[4]).Dy/Tb incorporation merely increases the coercivity to a limited degree as most Dy/Tb concentrates in the RE-rich GB regions, which cannot strengthen the intrinsic HA[32-34]and leads to the low utilization efficiency of scarce Dy/Tb.Upon La/Ce/Y substitution for Nd,the GB regions also suffer complicated chemical and structural transformations, highly affecting the magnetic performance of the RE-Fe-B permanent magnets.
Driven by the principle that the Nd-rich GB phase is critical to the corrosion resistance, coercivity, heavy RE utilization, as well as the high-abundant RE application in Nd-Fe-B magnets, we have devoted intense efforts in modifying the grain boundary.[35-52]The dual-alloy method invented in the 1990s inspired us the possibility of designing a novel GB alloy to replace the traditional Nd-rich phase.A novel approach,named as grain boundary restructuring (GBR), was proposed accordingly.[53]The concept of GBR can be elaborated as follows: focusing on the critical drawbacks of Nd-Fe-B magnets,i.e.,low coercivity,chemical durability,and thermal stability, a new GB alloy is designed manually, fabricated separately,and evolved finally into the required morphology and structure through tuning the processing parameters.As it manifests itself,the restructured GB phase is totally distinct from the naturally Nd-rich phase and exerts a profound effect on the performance of the Nd-Fe-B magnets. The GBR approach affords a rich spectrum of possibilities for fabricating 2:14:1-typed permanent magnets with tuned performance, and it basically does not complicate the fabrication process. From this aspect, the GBR approach is quite promising for the massive applications.
2.1.2. Design guidelines for grain boundary restructuring
After decades of development,we have established welldefined guidelines for designing the new GB alloy. The key points are proposed as follows.
1) According to the thermodynamic theory, the selected elements should hardly diffuse into the Nd2Fe14B matrix phase to guarantee the stable tetragonal structure and high intrinsic hard magnetism.
2) Based on the phase diagram, no soft magnetic phases should occur inside the composition profile of the new alloy to avoid the magnetic dilution effect.
3) From the perspective of magnetic properties, the new GB phase should exhibit a lower melting point than the Nd2Fe14B compound and good wettability with the matrix phase,which are essential for the magnet densification and the structural homogenization during sintering.
4)The corrosion theory indicates that the new GB phase should possess a higher corrosion potential to suppress the electrochemical corrosion and enhance the corrosion resistance.
A series of new GB alloys have been employed to increase the comprehensive performance of 2:14:1-typed magnets. Examples include (Pr,Nd)32.5Fe62.0Cu5.5,[54]Nd64Co36,[55]Nd6Co13Cu,[56]Dy69Ni31,[26]Dy32.5Fe62Cu5.5,[57]DyHx,[58]NdHx,[59]and Dy71.5Fe28.5.[60,61]In the following manuscript, recent developments on the (Pr, Nd)32.5Fe62.0Cu5.5and Dy71.5Fe28.5systems are selected as typical models to unveil the underlying mechanisms on improving the corrosion resistance and magnetic performance via the GBR approach.
2.2. (Pr,Nd)32.5Fe62.0Cu5.5 restructuring: High corrosionresistant Nd-Fe-B
2.2.1. (Pr, Nd)32.5Fe62.0Cu5.5alloy
According to the thermodynamic Miedema’s model,[62]the formation enthalpy for Nd/Fe/B mixing with Cu(-30 kJ/mol, +22 kJ/mol, and +2 kJ/mol, respectively) reveals that Cu hardly enters the 2:14:1 matrix phase. Consequently, the (Pr, Nd)32.5Fe62.0Cu5.5alloy will not destroy the tetragonal structure,which benefits the high intrinsic magnetic properties. Moreover, one can see that Fe and Nd2Fe17soft magnetic phases occur outside of the dark area in the phase diagram of Nd-Fe-Cu(Fig.1),[63]in which the δ-type Nd6Fe13Cu exhibits a higher corrosion stability than NdCu due to the lower Nd content in the former. Besides, this alloy also possesses a low melting point of ~506°C (Fig. 2),which benefits the liquid-phase-sintering of the restructured magnets. Based on the corrosion theory,the higher corrosion potential of about -0.8 V for the (Pr, Nd)32.5Fe62.0Cu5.5alloy contributes to narrowing down the potential difference between the matrix and intergranular phases, hence decreasing the driving force for the GB corrosion. Based on the above analysis, the (Pr, Nd)32.5Fe62.0Cu5.5(close to the component of Nd6Fe13Cu phase) alloy is selected to replace the Nd-rich phase.
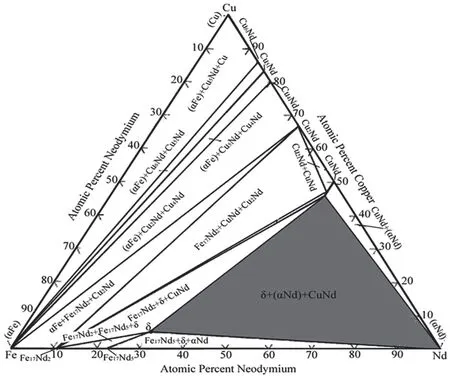
Fig.1. Nd-Fe-Cu isothermal section of phase diagram at 450 °C.[64]
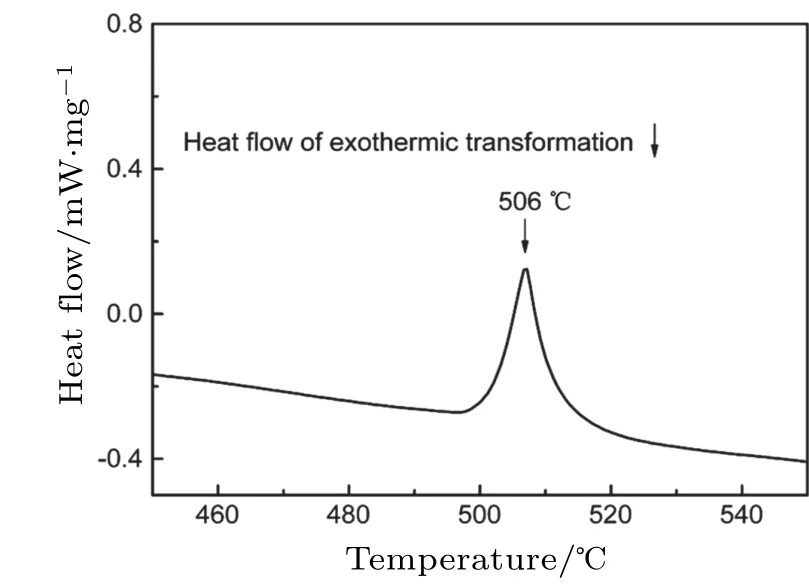
Fig. 2. Differential scanning calorimetry (DSC) curve for the (Pr,Nd)32.5Fe62.5Cu5.5 alloy.
The magnets were fabricated using the GBR method.Master alloy powders with the nominal composition of (Pr,Nd)12.6Fe81.3B6.1(at.%) were prepared by strip casting (SC),hydrogen decrepitating (HD), and jet milling (JM). The average particle size was approximately 3.4 µm. Aiding alloys of(Pr,Nd)32.5Fe62.0Cu5.5were vacuum induction melted and then ground to ~4 µm in an attritor filled with argon. The aiding alloy powders were mixed with the master alloy powders at mass fractions ranging from 0% to 12%, followed by aligning in a perpendicular magnetic field of 1.6 T and isostatically pressing at 200 MPa. The restructured green compacts were sintered at 1090°C for 2 h,and subsequently annealed at 890°C and 500°C.
2.2.2. Corrosion behavior of (Pr, Nd)32.5Fe62.0Cu5.5restructured magnets
The corrosion weight loss curves of the samples exposed in a hot/humid atmosphere (120°C, 2 bar, and 100% relative humid) are plotted in Fig. 3(a). Before 72 h, the (Pr,Nd)32.5Fe62.0Cu5.5restructured magnets exhibit a negligible mass loss. After 96 h exposure, the mass loss increases slightly from 0.6 mg/cm2to 1.0 mg/cm2upon raising the(Pr,Nd)32.5Fe62.0Cu5.5content from 3 wt.% to 12 wt.%. Comparison sample(Pr,Nd)14.5Fe79.5B6.0(hereafter called the unrestructured magnet) with equivalent (Pr, Nd) amount to the 12 wt.%(Pr,Nd)32.5Fe62.0Cu5.5restructured magnet exhibits a high mass loss of 15.7 mg/cm2at 96 h,which is approximately 15 times higher than that of the restructured one. Clearly,the restructured magnet possesses much better corrosion resistance in hot and humid atmosphere.
Figure 3(b) displays the representative potentiodynamic polarization curves measured in 0.005 M H2SO4solutions. Electrochemical parameters including corrosion potential (Ecorr) and corrosion current density (icorr) are calculated from the Tafel plots.[46,64]The samples with increased (Pr,Nd)32.5Fe62.0Cu5.5contents from 0 to 12 wt.% possess more negative Ecorr(from -0.717 V to -0.741 V) and larger icorr(from 182.9 µA/cm2to 287.6 µA/cm2), which can be explained by the presence of more (Pr, Nd) in the intergranular regions. However, the restructured magnet exhibits far more positive Ecorrand lower icorrthan the non-restructured one(Ecorr=-0.776 V and icorr=765.3µA/cm2). It demonstrates that the GBR approach facilitates corrosion resistance in acidic solutions, which is further confirmed by the corroded surface micrographs (see the inset in Fig. 3(b)). A large amount of 2:14:1 matrix phase grains in the un-restructured magnet detach from the surface due to severe GB corrosion,which does not occur in the restructured one.
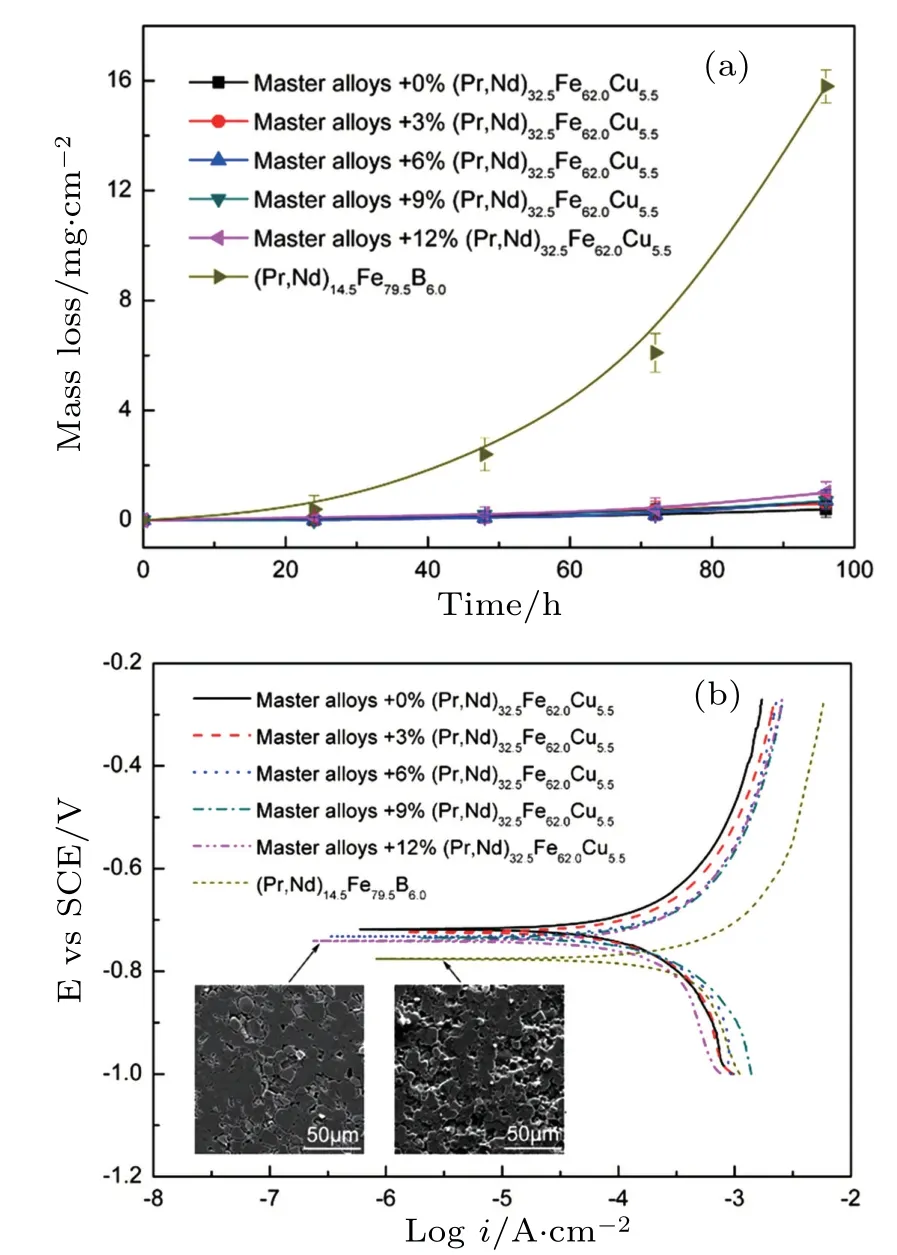
Fig. 3. (a) Mass loss of (Pr, Nd)32.5Fe62.0Cu5.5 restructured magnets and (Pr, Nd)14.5Fe79.5B6.0 in hot and humid atmosphere. The error bar represents the standard deviation obtained from 5 samples. (b)Potentiokinetic polarization curves in 0.005 M H2SO4 aqueous solutions. The insets in(b)are SEM micrographs of the corroded surfaces of (Pr, Nd)14.5Fe79.5B6.0 and 12 wt.% (Pr, Nd)32.5Fe62.0Cu5.5 restructured magnets.[53]
Figure 4 shows the Nyquist plots obtained by electrochemical impedance spectroscopy (EIS) for the 12 wt.% (Pr,Nd)32.5Fe62.0Cu5.5restructured and un-restructured magnets in H2SO4electrolyte. Apparently,the Nyquist plots are composed of capacitive arcs from high to medium frequencies and inductance arcs at low frequencies. After data fitting using ZView program,[46]the equivalent circuit is obtained(inset in Fig. 4). Here, CPE, Rt, Rs, RL, and L represent the interface capacitance, charge transfer resistance, electrolyte resistance,absorption resistance,and absorption inductance,respectively.Compared to Rtand RL,Rsis too small and can be neglected.Rtrelates to the electrochemical reaction at the interface between the intergranular phases and acidic aqueous solutions.RLdepends on the absorption processes of intermediate substances including (MOH)ads(M =Pr, Nd, Fe) on the intergranular phase surface.[65]As listed in Table 1, the Rtvalues less than 86.3 Ω·cm2reveal that there are active reaction channels in the anodic intergranular areas. This fact,coupled with the occurrence of inductance arc in the Nyquist plots,demonstrates that the electrochemical corrosion is controlled by both the formation of reaction channels and the absorption processes of intermediate substances at the electrode system interface. The higher Rt1/Rt2(66.5 Ω·cm2/86.3 Ω·cm2) and RL(190.7 Ω·cm2) values of the restructured magnet suggest the increased resistance against the formation of active reaction channels and the reduced amount of(MOH)ads,compared to the un-restructured one.
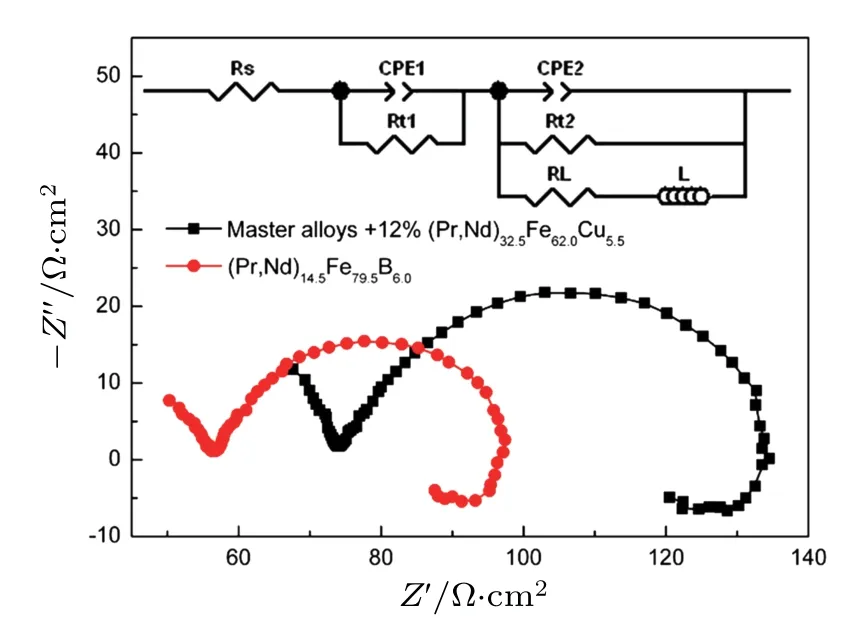
Fig. 4. Nyquist plots of (Pr, Nd)14.5Fe79.5B6.0 and 12 wt.% (Pr,Nd)32.5Fe62.0Cu5.5 restructured magnet in 0.005 M H2SO4 solution.The corresponding equivalent circuit is illustrated as an inset.
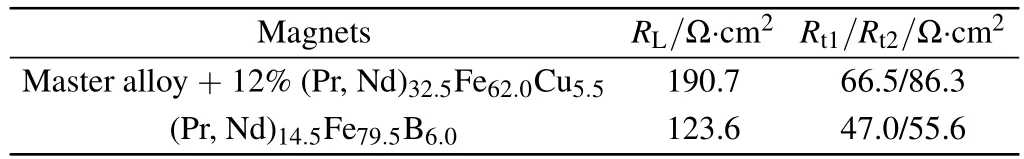
Table 1. Absorption resistance RL and charge transfer resistance Rt of the proposed equivalent circuit models in Fig.4.
2.2.3. Corrosion mechanism of (Pr, Nd)32.5Fe62.0Cu5.5restructured magnets
The backscattered electron image of the 12 wt.% (Pr,Nd)32.5Fe62.0Cu5.5restructured magnets (Fig. 5(a)) shows a typical microstructure with the(Pr,Nd)2Fe14B grains(the dark area)and the intergranular phases(the bright area). As shown in the inset of Fig.5(a),energy dispersive spectrometer(EDS)detection of the intergranular phases at the triple junctions reveals their compositions to be approximate 30 at.% (Pr, Nd),65 at.% Fe, and 5 at.% Cu, which accords well with the (Pr,Nd)6Fe13Cu δ-phase.[66]Figure 5(b) is a scanning transmission electron microscope (STEM) bright field image of the restructured magnet, in which the line scan was performed perpendicular to GB along the bar. EDS results in Fig. 5(c)clearly indicate that the Fe intensity decreases in the GB region while the intensities of Nd, Pr, and Cu increase, which is in accordance with the concentration difference between the(Pr,Nd)2Fe14B and(Pr,Nd)6Fe13Cu phases.
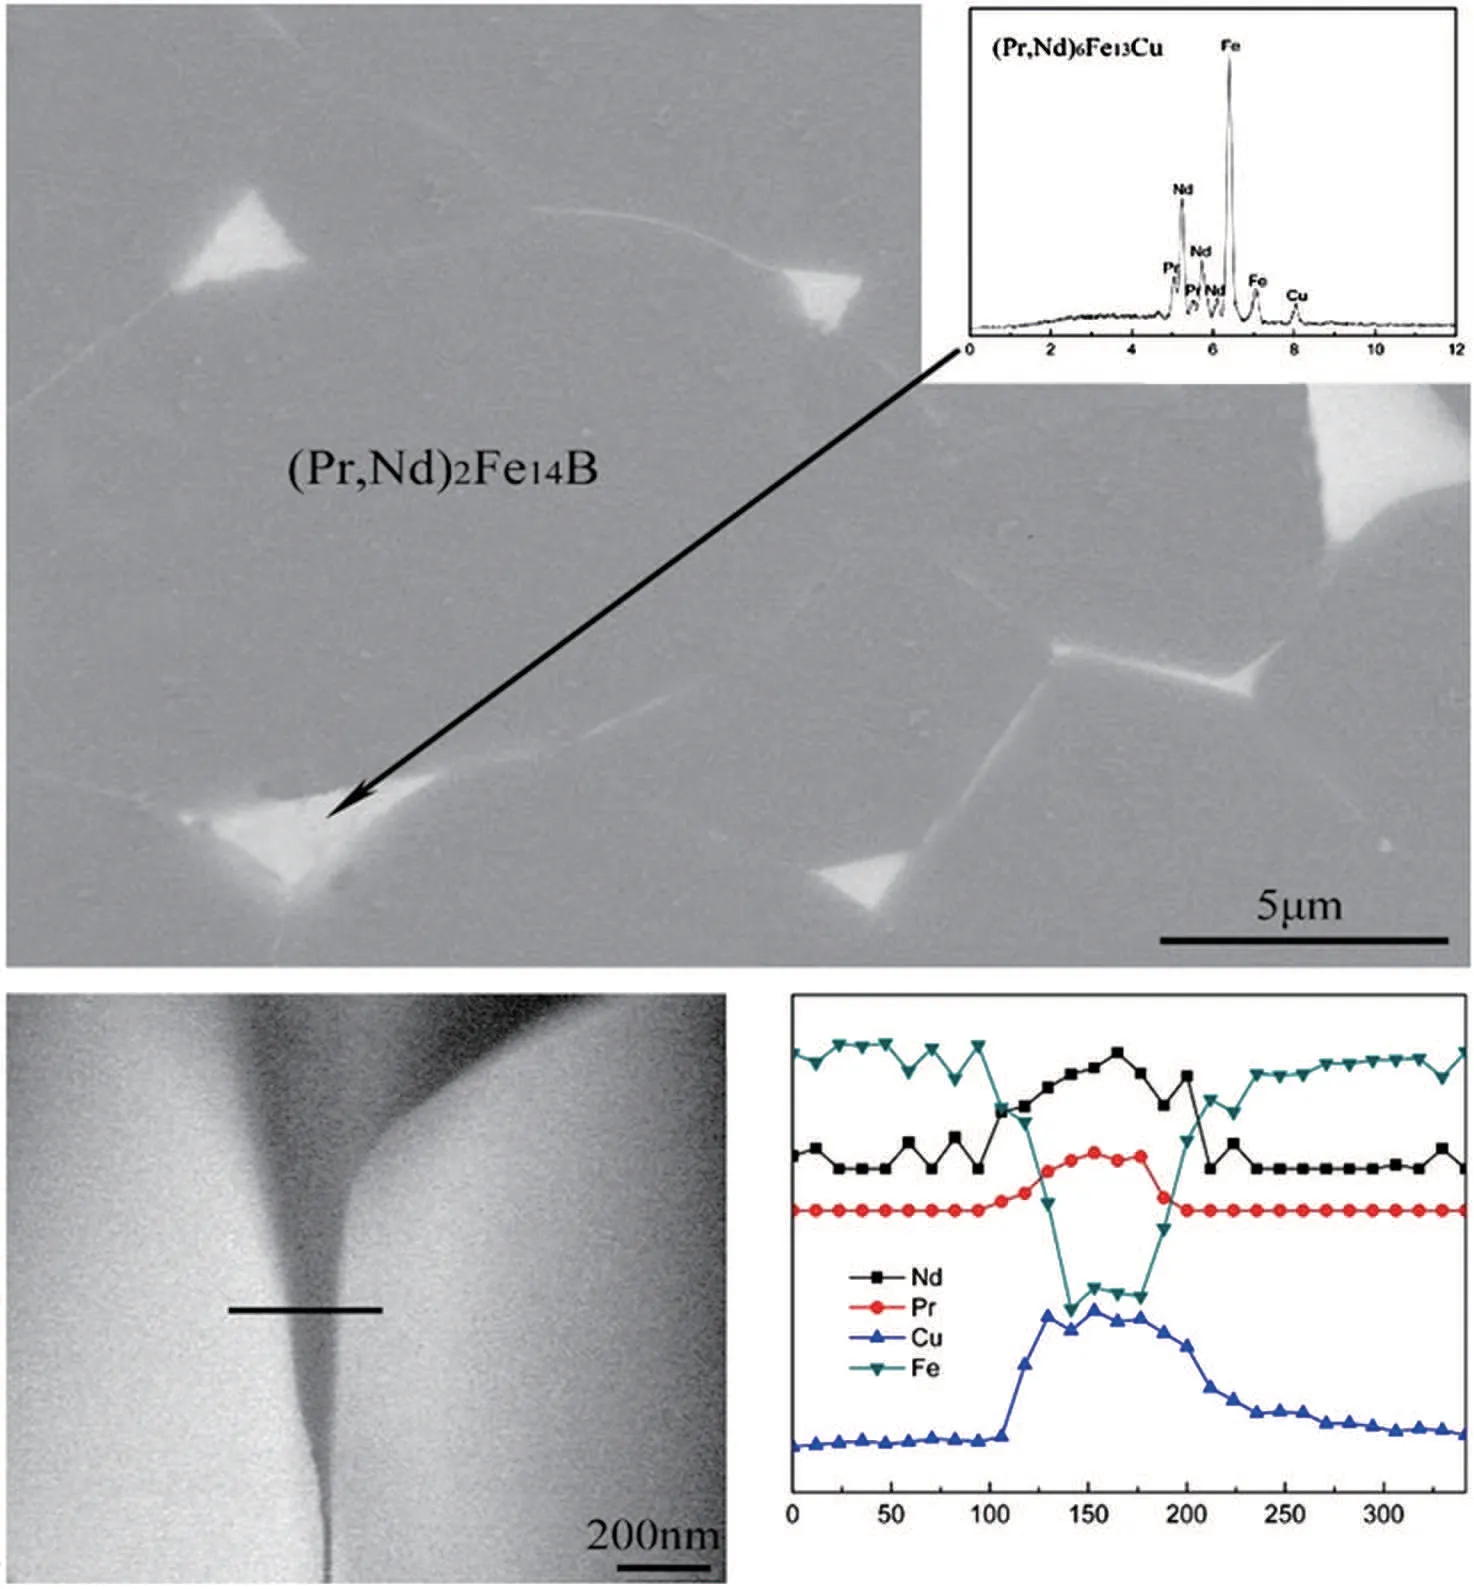
Fig.5.(a)Back-scattered electron image of 12 wt.%(Pr,Nd)32.5Fe62.0Cu5.5 restructured magnet. EDS detection of intergranular phase at triple junction areas is shown as inset. (b)Corresponding STEM image and(c)EDS composition profile along the line shown in(b).[53]
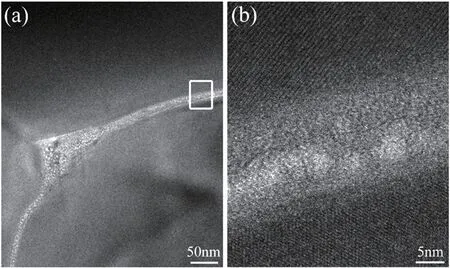
Fig.6. (a)Bright field TEM image of 12 wt.%(Pr,Nd)32.5Fe62.0Cu5.5 restructured magnet. (b)Corresponding HRTEM images of the rectangular region indicated in(a).[53]
Figure 6(a)is the bright field TEM image of the restructured magnet,where the(Pr,Nd)6Fe13Cu phase distributes as noodles or junctions among the neighboring (Pr, Nd)2Fe14B grains. High-resolution TEM (HRTEM) image (Fig. 6(b))taken from the rectangular region in Fig.6(a)depicts the amorphous phase with a thickness of ~15 nm. The amorphous phase with decreased microstructural defects might be beneficial for the corrosion resistance of the GB phases.[67]Moreover, the 15 nm width of GBs, which is longer than the exchange length of the Nd2Fe14B phase (2.0 nm),[68]can substantially decouple the exchange interaction among the magnetically hard (Pr, Nd)2Fe14B grains. Therefore, the coercivity Hcjincreases from 522 kA/m for the master alloys to 960 kA/m for the 12 wt.% (Pr, Nd)32.5Fe62.0Cu5.5restructured magnet. The homogeneous distribution of intergranular phases (Fig. 7) also benefits the increased rectangularity(Hk/iHc) and maximum energy product (BH)max. As shown in Fig.8, the(BH)maxcan reach 384 kJ/m3(48 MGOe)with 3 wt.%(Pr,Nd)32.5Fe62.0Cu5.5addition,which is comparable to that of N48-type commercial Nd-Fe-B magnets.
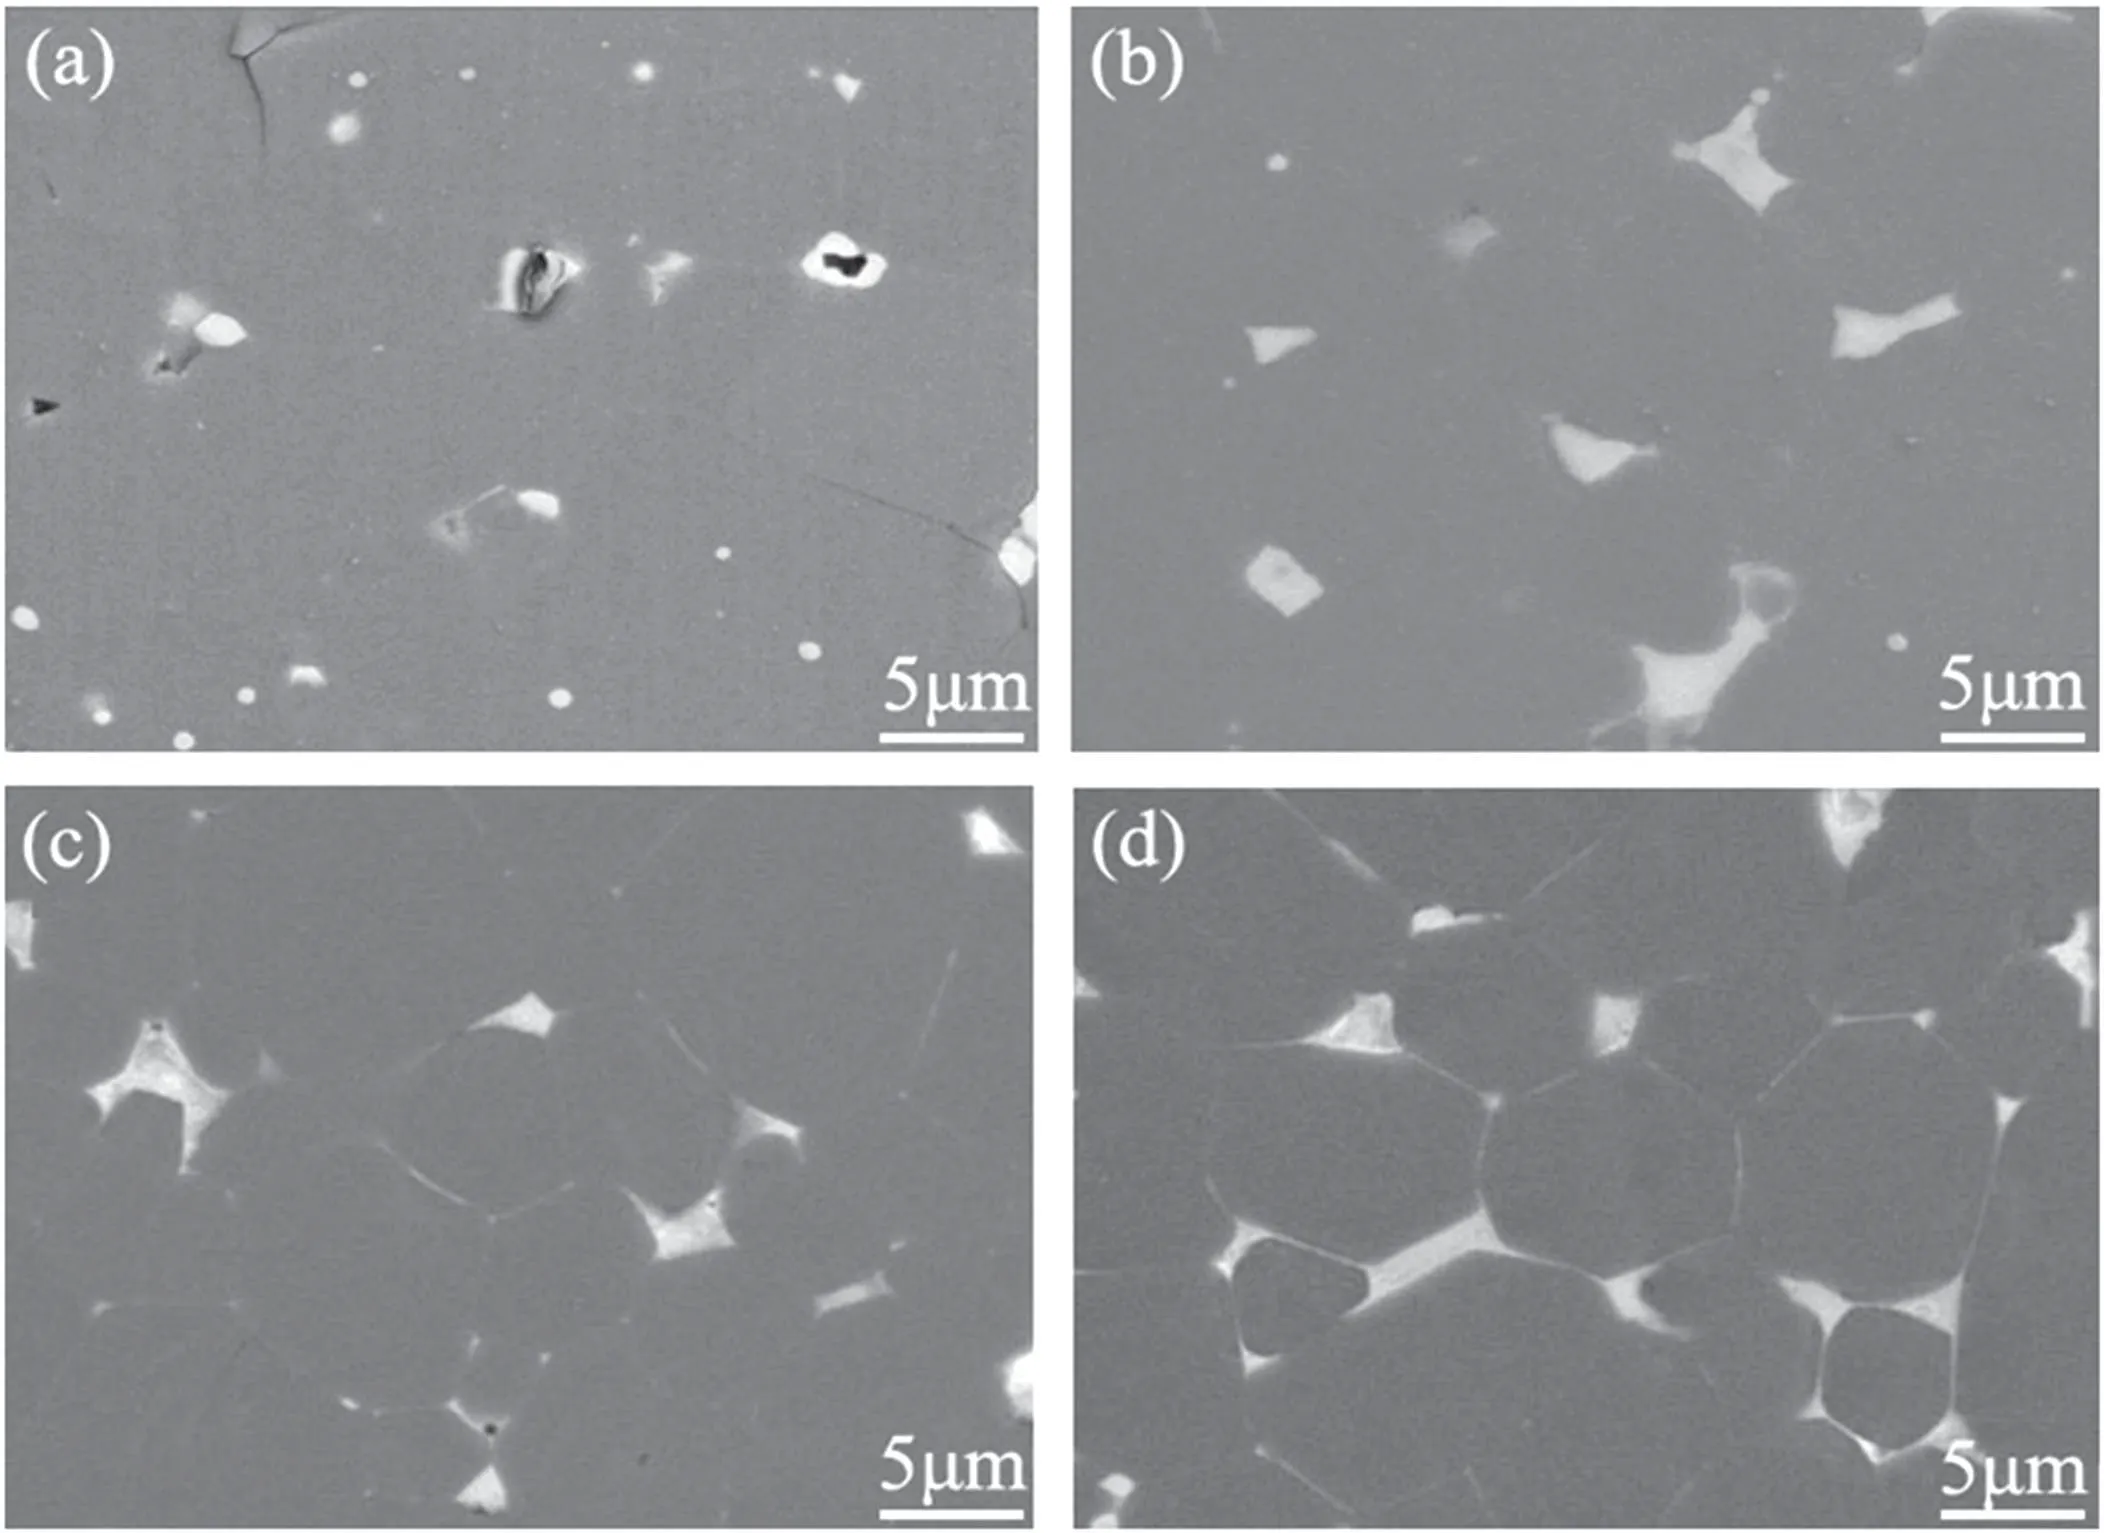
Fig.7. Back-scattered electron images of(a)the master alloy and magnets with(b)3 wt.%,(c)6 wt.%,(d)9 wt.%(Pr,Nd)32.5Fe62.0Cu5.5.[54]
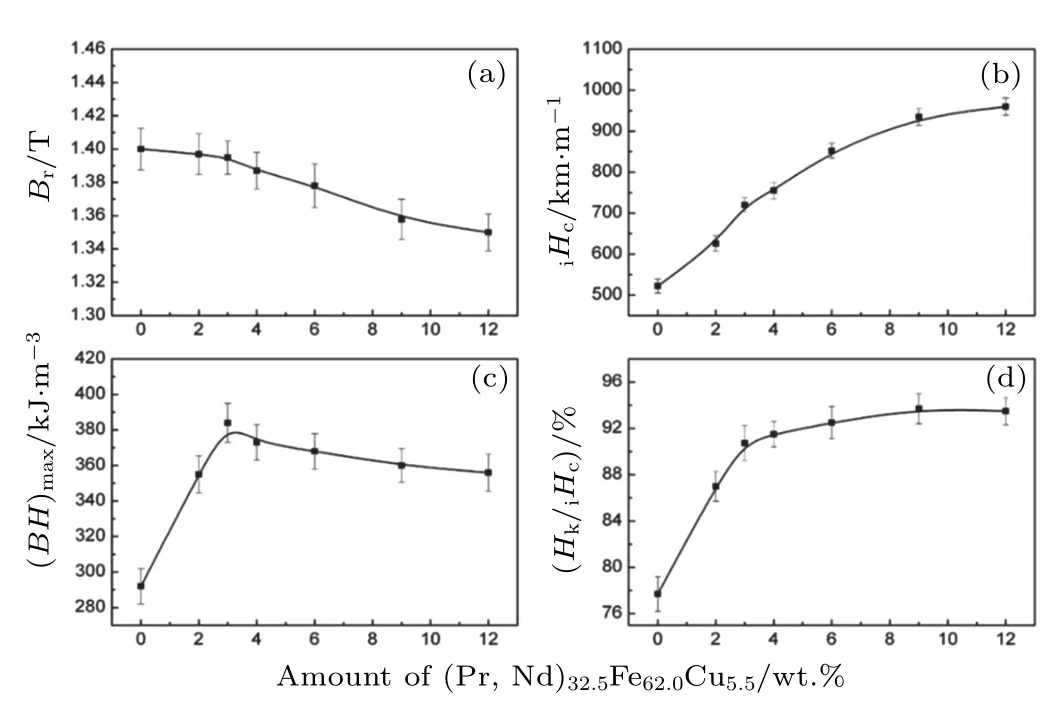
Fig.8. Variations of the remanence,intrinsic coercivity,maximum energy product,and rectangularity of demagnetization curve with the(Pr,Nd)32.5Fe62.0Cu5.5 content. The error bar represents the standard deviation obtained from 5 samples.[54]
For the restructured magnet,the δ-phase(Pr,Nd)6Fe13Cu possesses an electrochemical potential of -0.806 V in 0.005 M H2SO4solutions with respect to a saturated calomel electrode, which is substantially higher than that of the (Pr, Nd)-rich phase ((Pr, Nd)4Fe, -0.870 V). As a result, the δ phase has a far lower corrosion rate than the (Pr, Nd)-rich phase.Corrosion measurements of(Pr,Nd)6Fe13Cu alloys after 96 h exposure in hot/humid atmosphere show that their mass loss is 0.1 mg/cm2, which is quite similar to that of the (Pr,Nd)2Fe14B matrix phase, suggesting that they hardly react with H2O.The(Pr,Nd)-rich phase,however,is very sensitive to the water and exhibits a large mass loss of 256.8 mg/cm2in hot/humid environments for only 24 h.[44]Thus, the replacement of (Pr, Nd)-rich phase by (Pr, Nd)6Fe13Cu can drastically reduce the sensitiveness of Nd-Fe-B magnets to H2O,being responsible for far better corrosion resistance of the restructured magnet against hot/humid atmosphere than the unrestructured one.
It is well established that the GBR approach can be applied to fabricate high corrosion-resistant(Pr, Nd)-Fe-B sintered magnets through replacing the intergranular(Pr,Nd)-rich phase by a(Pr, Nd)6Fe13Cu one. These restructured magnets exhibit the maximum energy products of 356.0-384.0 kJ/m3(45-48 MGOe) and low mass losses of 0.3-1.0 mg/cm2after exposing in hot/humid atmosphere for 96 h. The better corrosion resistance can be ascribed to the closer corrosion potential of the δ-type(Pr,Nd)6Fe13Cu GB phase to the(Pr, Nd)2Fe14B matrix phase. It reduces the potential difference between the cathodic matrix phase and the anodic GB phases,leading to the decreased driving force for the electrochemical corrosion. This fact, coupled with the amorphous structure and homogeneous distribution of intergranular GB phase, decreases the corrosion current density and thus improves the corrosion resistance. The enhanced corrosion resistance in both hot/humidity and acidic environments, and outstanding magnetic performance together indicate that the GBR approach is appealing to developing high corrosion-resistant Nd-Fe-B sintered magnets for mass production.
2.3. Dy71.5Fe28.5 restructuring: High-coercivity Nd-Fe-B
2.3.1. Dy71.5Fe28.5alloy
According to the magnetism of RE2Fe14B compounds and the phase diagram, the Dy71.5Fe28.5aiding alloy is designed and introduced into the slightly off-stoichiometric Nd2Fe14B starting magnet through GBR approach. With a lower melting point of 874.5°C(Fig.9)than the sintering temperature, the aiding alloy Dy71.5Fe28.5can melt into liquid to increase the volume fraction of liquid phase and improve the wettability between the GB phase and the 2:14:1 phase during sintering,accelerating the densification and modifying the distribution of the GB phase.On the other hand,HAof Dy2Fe14B(15 T)is higher than that of Nd2Fe14B(7.3 T).Diffusing Dy into the surface region of 2:14:1 phase grains to replace Nd can improve the local HA,enlarging the nucleation field of the reversed domains. Finally,since there are no nonmagnetic elements which can heavily diffuse into the 2:14:1 phase grains in this adding alloy, remanence reduction resulting from the magnetic dilution can be avoided.
Master alloy powders with the composition of (Pr,Nd)12.3FebalB6.1were prepared by induction melting,SC,HD,and JM.The average particle size was approximately 3.4µm.The aiding alloy Dy71.5Fe28.5(at.%) was prepared by arc melting. The ingot was mechanically crushed and refined to~1.7 µm by ball milling. The two kinds of powders were blended homogenously, followed by aligning under a magnetic field of 1.6 T and compacting under 200 MPa. The green
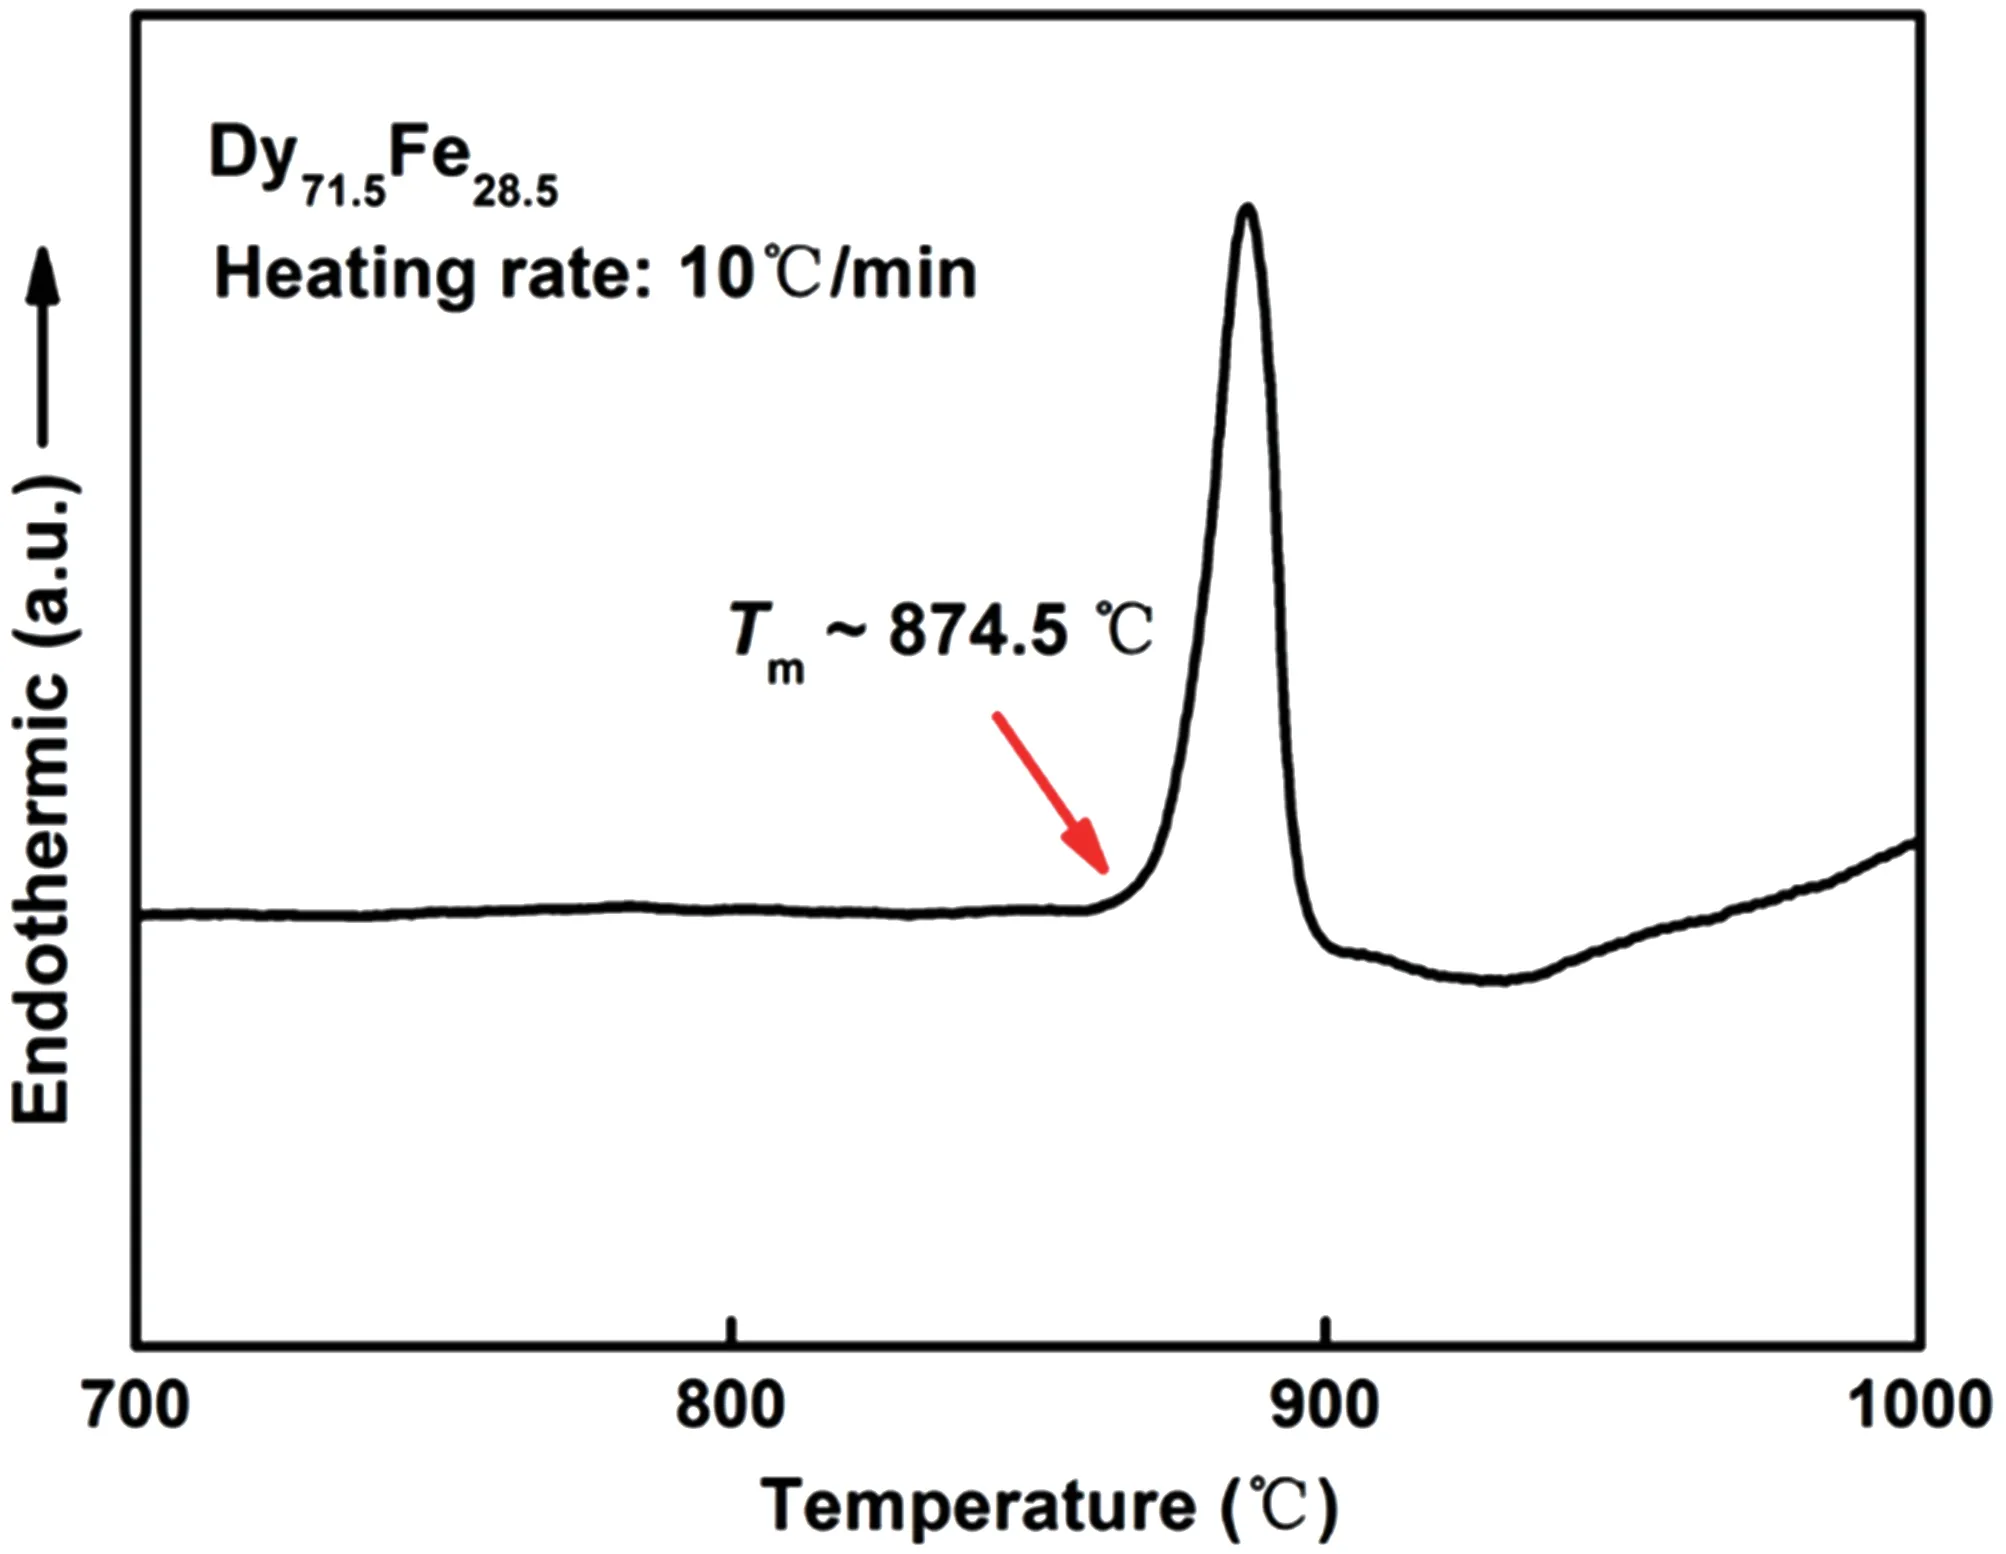
Fig.9. DSC curve of the Dy71.5Fe28.5 eutectic alloy.[61]
2.3.2. Magnetic performance of Dy71.5Fe28.5restructured magnets
Figure 10 shows the demagnetization curves of the magnets with different Dy71.5Fe28.5additions. The sintered master alloy with only 12.3 at.% total RE (TRE) content exhibits a low magnet density of 7.45 g/cm3and poor magnetic performance of(BH)max=35.6 MGOe,Hcj=9.6 kOe,and squareness factor Q=35.6%, indicating that such low TRE content cannot ensure sufficient densification and good isolation of ferromagnetic 2:14:1 phase grains. With 1 wt.%Dy71.5Fe28.5addition(TRE=12.6 at.%),better densification can be obtained(magnet density 7.53 g/cm3). Accordingly,the magnetic performance is improved significantly,where Q increases drastically to 96.3%,(BH)maxto 48.8 MGOe,and Hcjto 12.2 kOe.Further increasing the Dy71.5Fe28.5content to 2 wt.%, both the magnet density and magnetic performance can be continuously enhanced,especially with the coercivity Hcjincreased to 14.5 kOe. 3 wt.% Dy71.5Fe28.5addition enhances the Hcjgradually to 15.8 kOe with the remanence slightly decreased to 1.36 T.It should be noted that the TRE content in the 2 wt.%Dy71.5Fe28.5restructured magnet is 12.92 at.%,merely 1.16%higher than that in the stoichiometric Nd2Fe14B compound.
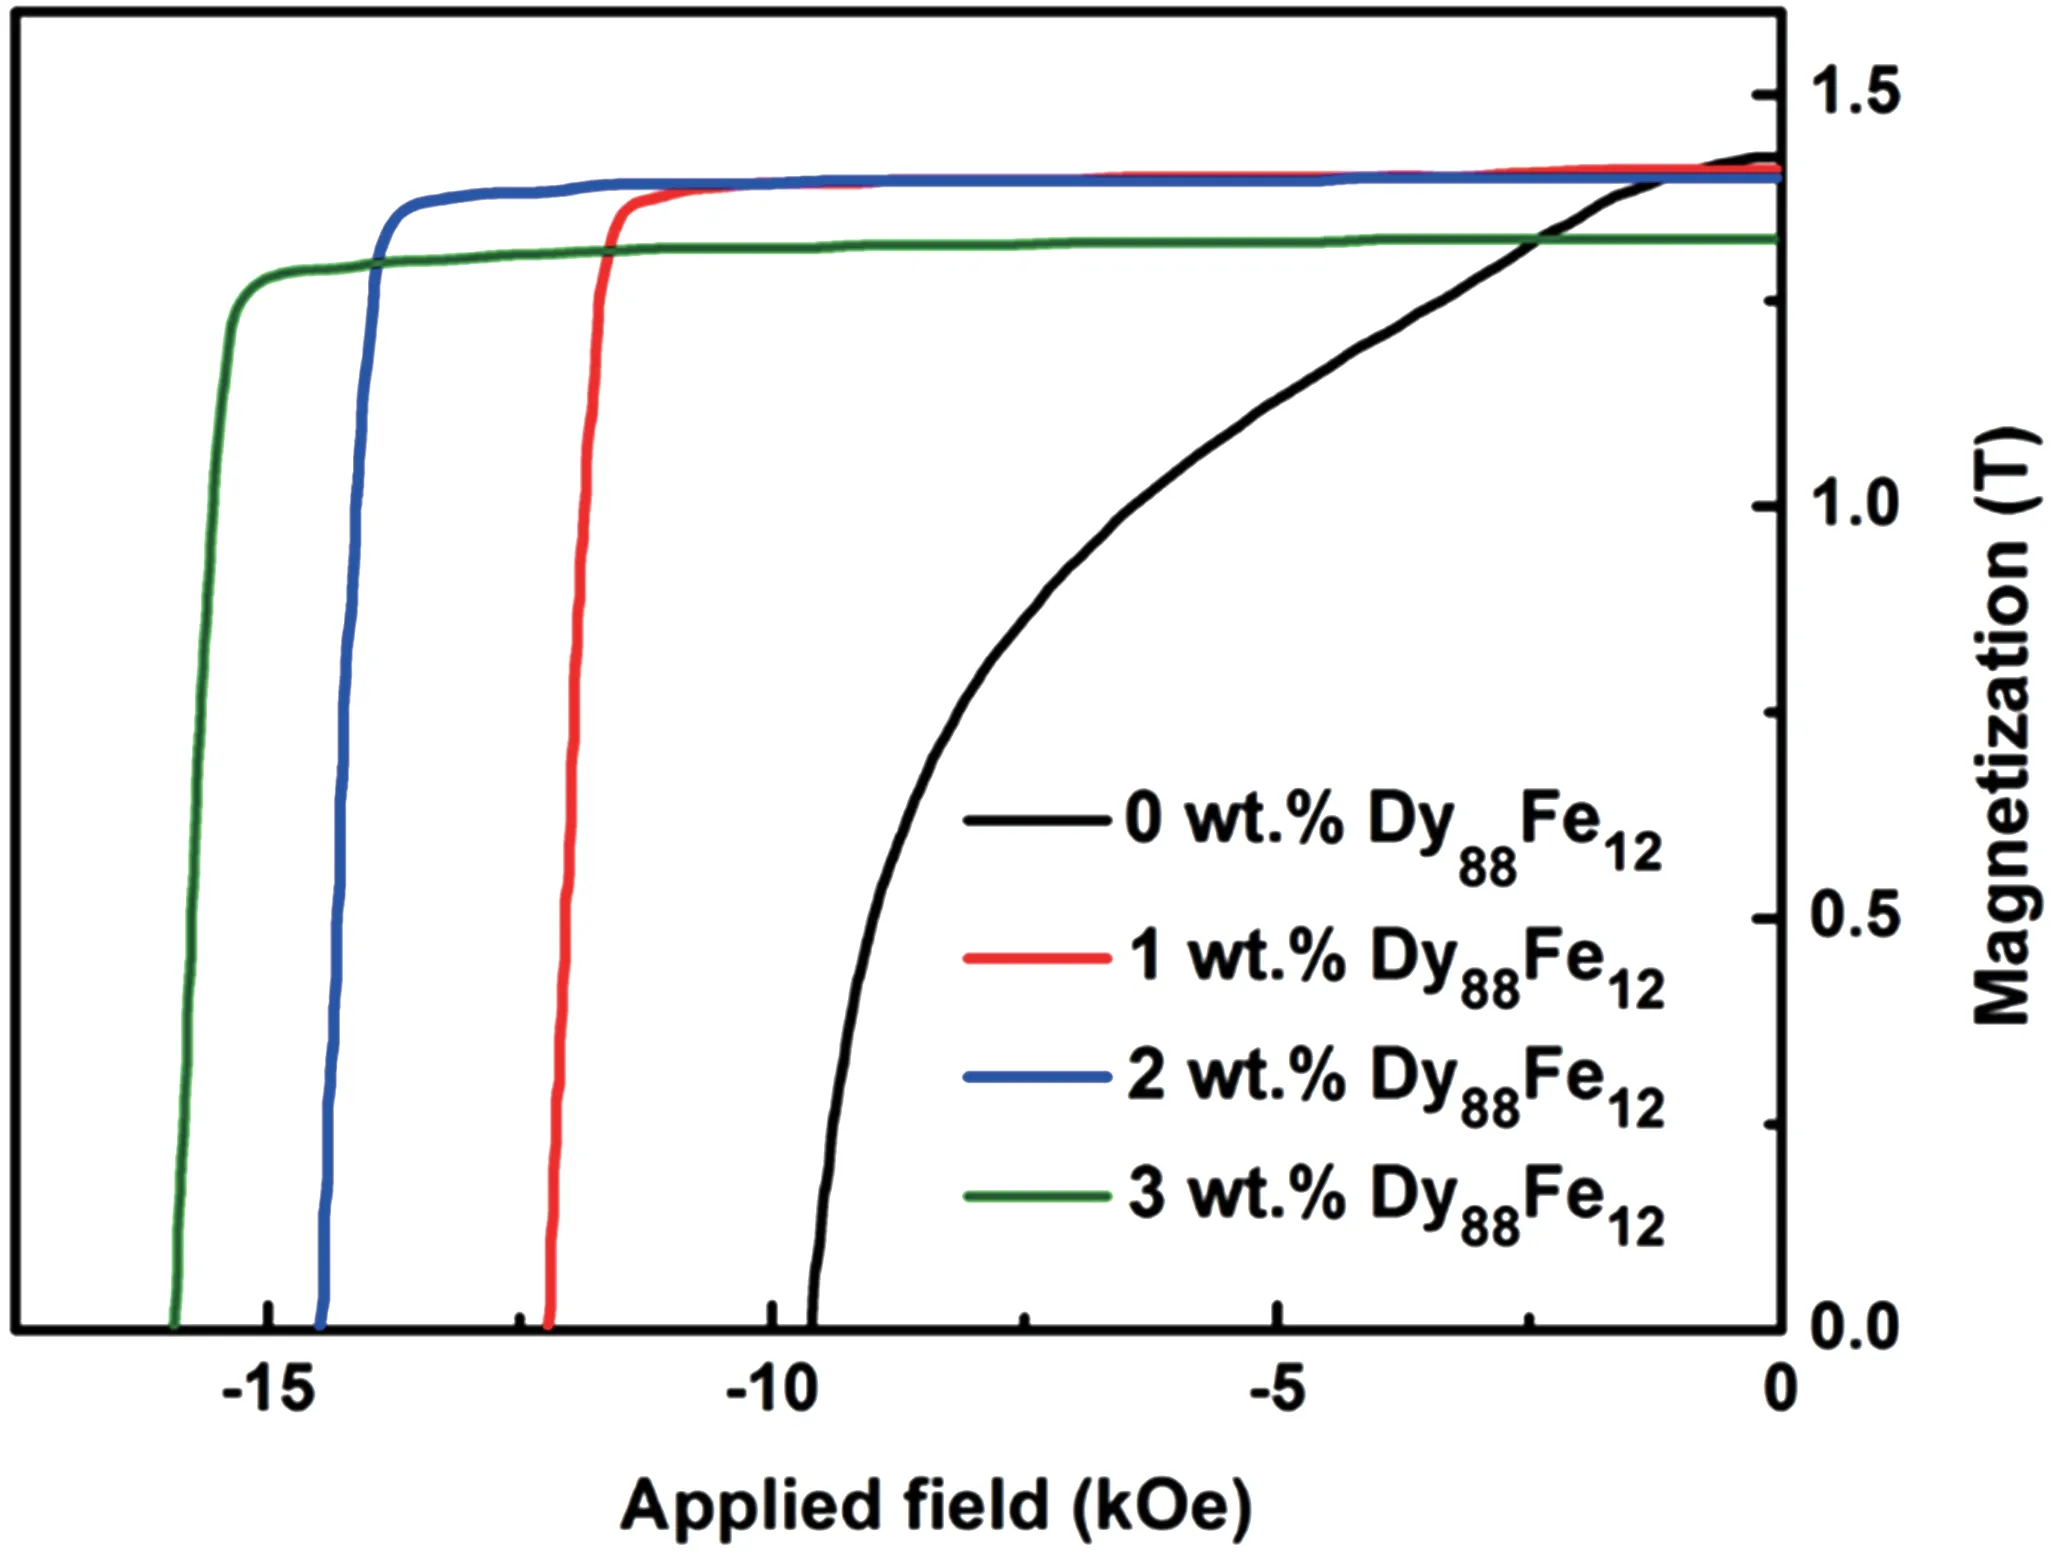
Fig.10. Demagnetization curves for Dy71.5Fe28.5 restructured magnets.
2.3.3. Coercivity mechanism of Dy71.5Fe28.5restructured magnets
The Dy71.5Fe28.5additives help densify the magnets and optimize the microstructure,as reflected by the back-scattered scanning electron microscope (SEM) micrographs (Fig. 11),where the dark region corresponds to the 2:14:1 matrix phase grains and the bright region refers to the RE-rich phase. For the sintered master alloy, round-shaped RE-rich phases are aggregated in the triple junctions, while a relatively small amount of GBs form between neighboring 2:14:1 phase grains(Fig. 11(a)). Besides, there are many holes within the 2:14:1 phase grains and triple junctions, in agreement with the low magnet density (7.45 g/cm3). With 1 wt.% Dy71.5Fe28.5addition (TRE = 12.6 at.%), more RE-rich GBs surrounding the matrix phase form and the holes decrease gradually(Fig. 11(b)). Upon higher Dy71.5Fe28.5addition, RE-rich phases in the triple junctions turn from round-shaped to striplike, suggesting a better wettability within the 2:14:1 phase grains. As a result, most 2:14:1 phase grains are surrounded by smooth and continuous RE-rich phase GBs(Fig.11(c)),ensuring better isolation and decoupling effect. However, upon excessive Dy71.5Fe28.5addition (3 wt.%), the volume fraction of RE-rich phases in the triple junctions increases greatly(Fig.11(d)),leading to the magnetic dilution effect(slight decreased(BH)maxand Br).
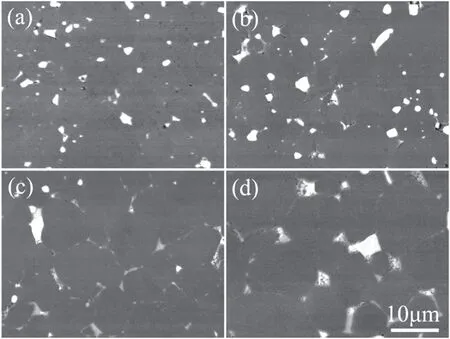
Fig.11.Back-scattered SEM micrographs of(Pr,Nd)12.3FebalB6.1 master alloy with(a)0,(b)1 wt.%,(c)2 wt.%,and(d)3 wt.%Dy71.5Fe28.5.
It should be stressed that when the Dy71.5Fe28.5addition is below 2 wt.%,i.e.,the TRE content is less than 12.92 at.%,the coercivity is significantly enhanced without remanence deterioration. For Nd-Fe-B sintered magnets,both the continuous GBs and the hardening shell in the surface region of 2:14:1 phase grains are necessary for obtaining high coercivity. Elemental distributions for the 2 wt.% Dy71.5Fe28.5restructured magnets are shown in Fig.12. Note that the Dy concentration compacts were sintered at 1070°C for 3 h, subsequently annealed at 890°C for 2 h and 520°C for 4 h.in the intergranular GBs and triple junctions is higher than that in the center of the 2:14:1 phase grains,as shown in Fig.12(c).There is a thin layer(approximately 0.7-1.0µm)at the interface between the 2:14:1 phase and the RE-rich phase,depicting an obvious Dy segregation, which is expected to form a(Nd, Dy)2Fe14B shell.[59,69,70]Since Dy2Fe14B has a larger anisotropy field of 15.0 T than that of Nd2Fe14B (7.3 T), the formation of (Nd, Dy)2Fe14B results in higher HAat the surface region of the 2:14:1 phase grains,strengthening the nucleation field of the reversed domain.[71,72]Therefore, enlarged coercivity is realized. Meanwhile,the Dy segregation distance at the surface of the 2:14:1 phase grains is much smaller than the grain size, the magnet remanence can be maintained via avoiding the antiferromagnetic coupling between Dy and Fe.
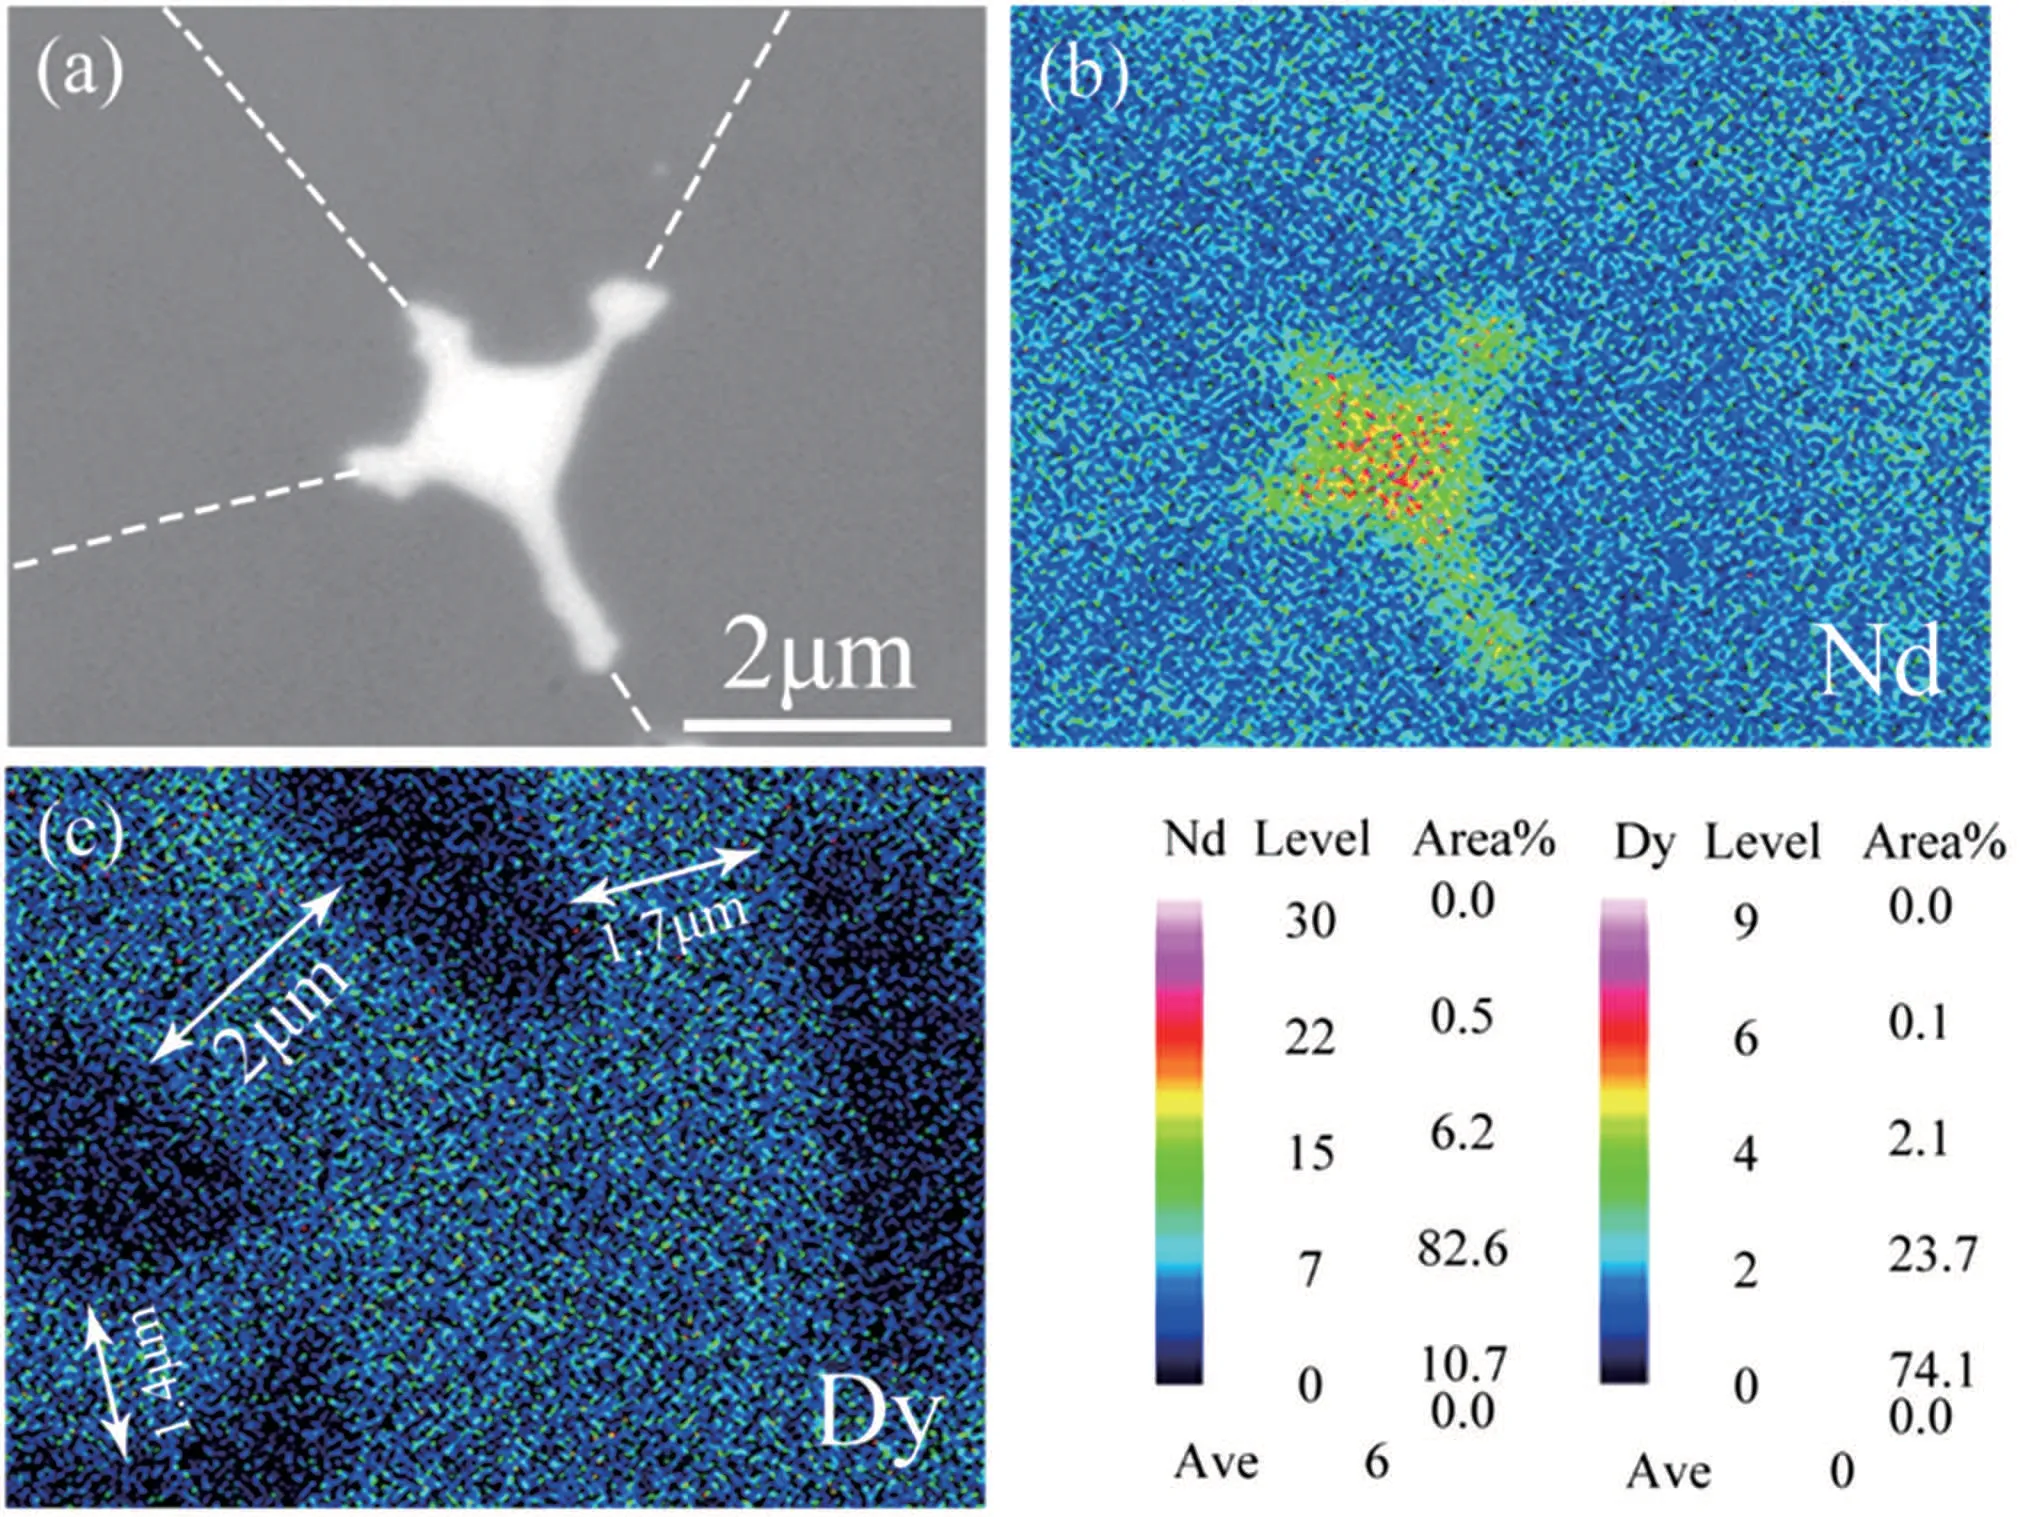
Fig.12. Nd and Dy mapping in GBs and 2:14:1 phase grains of 2 wt.%Dy71.5Fe28.5-restructured magnet.[60]
A comparison between our low TRE-content magnets and the reported 48BH magnets fabricated by different approaches is illustrated in Fig. 13(a). For the one prepared by the conventional single alloy approach,the required TRE content is as high as 14.06 at.%.[73]The binary-alloy approach is effective to reduce the TRE content to 13.52-13.6 at.%by introducing Pr or Cu aiding alloys.[74,75]In our work, we can further decrease the TRE content to only 12.92 at.%via the novel GBR method. In addition,the GBR approach is also competitive in magnetic performance compared to those with such low TRE content,as shown in Fig.13(b). Magnetic performance of the(Nd, Dy)12.99FebalB5.9magnet prepared by the conventional single alloy approach is(BH)max=34.5 MGOe,Br=1.40 T,Hcj=6.6 kOe.[76]Even blended with 1 at.%Dy(melting point of 1412°C),the magnetic performance of a Nd13FebalCoNbB7magnet can only be slightly improved to Hcj= 7.2 kOe,(BH)max=24.5 MGOe,and Br=1.11 T.[77]It indicates that if the melting point of aiding alloys is much higher than the sintering temperature(1030-1100°C),the magnetic performance cannot be improved via the binary-alloy approach. The introduction of low-melting-point Dy71.5Fe28.5aiding alloy not only leads to good densification but also forms a magnetic hardening(Nd,Dy)2Fe14B shell surrounding the 2:14:1 phase grains,thus making it obtainable of reduced TRE content and improved magnetic performance simultaneously.
The GBR approach has been proved to be effective in fabricating high-performance magnets with low TRE content of 12.6-12.92 at.%. With the low-melting-point Dy71.5Fe28.5additives, there are two main microstructural modifications in(Pr, Nd)12.3FebalB6.1master alloys. Firstly, the high magnet density contributes to enhanced (BH)maxand Br. Secondly,efficient Dy/Tb utilization by constructing a Dy/Tb-rich hardening shell surrounding the Nd2Fe14B core and uniform GB layer isolating the magnetically hard 2:14:1 matrix grains can strengthen the Hcjsubstantially.Via this GBR approach,lower TRE content of only 12.92 at.%is employed for 48BH magnet.Meanwhile,the magnets exhibit better magnetic performance than reported ones with the same TRE content level.
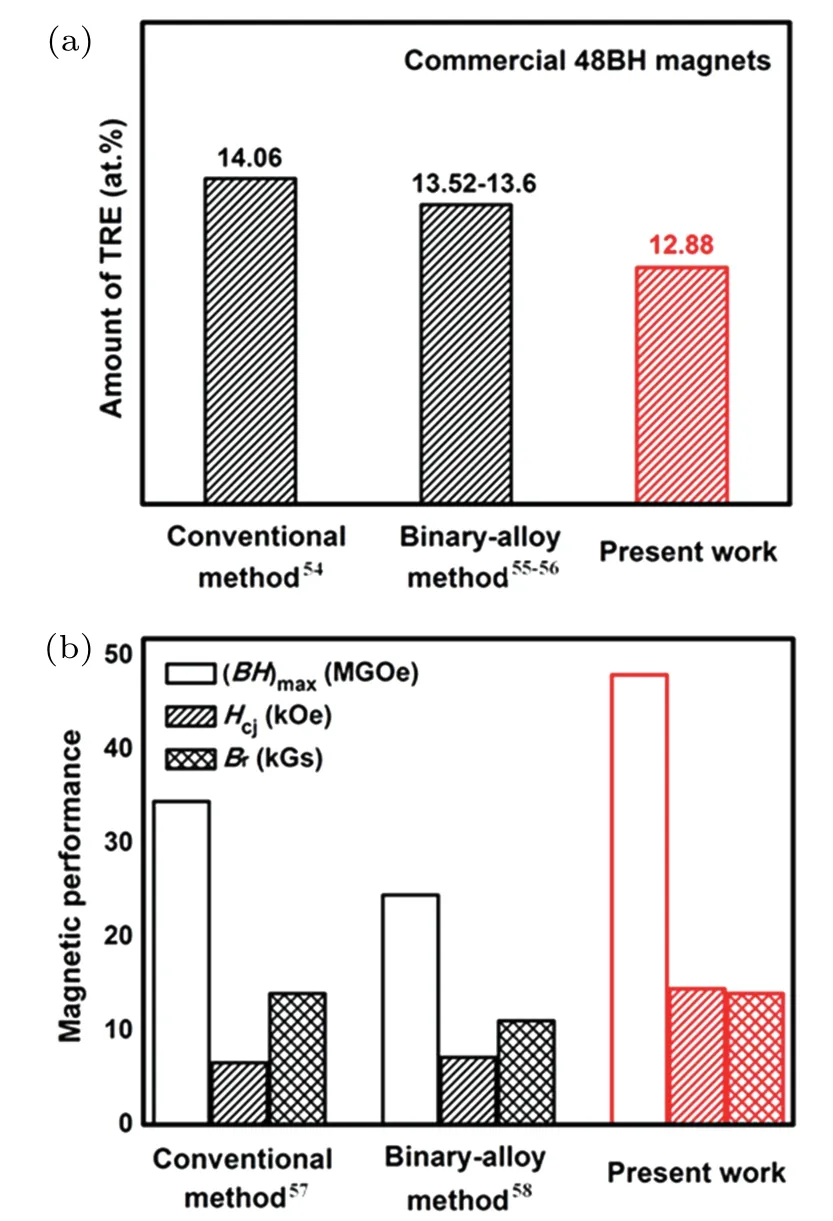
Fig.13. A comparison of(a)TRE content of commercial 48BH magnets, and (b) magnetic performance of the magnets with similar TRE content.
Based on the above analysis,the GBR magnets generally exhibit the following features(Fig.14).
1)The GBR approach focuses on the manually designed GB phase,being distinct from the traditional Nd-rich phase.
2)The new GB phase with higher electrode potential can decrease the driving force for the electrochemical reactions between the matrix and intergranular phases,succeeding in fabricating high corrosion-resistant Nd-Fe-B magnets.
3) Through adding low-melting-point Dy-containing alloys,a magnetic hardening shell with higher HAand continuous GBs are formed,contributing to the enhanced coercivity.
4) Coercivity increment by per unit Dy addition can be effectively enhanced through the GBR approach,without sacrificing the remanence and energy product.
5) By blending these new GB alloys with low melting points into near-stoichiometric Nd2Fe14B main alloys,the total rare earth consumption can be reduced significantly,being promising for mass production.
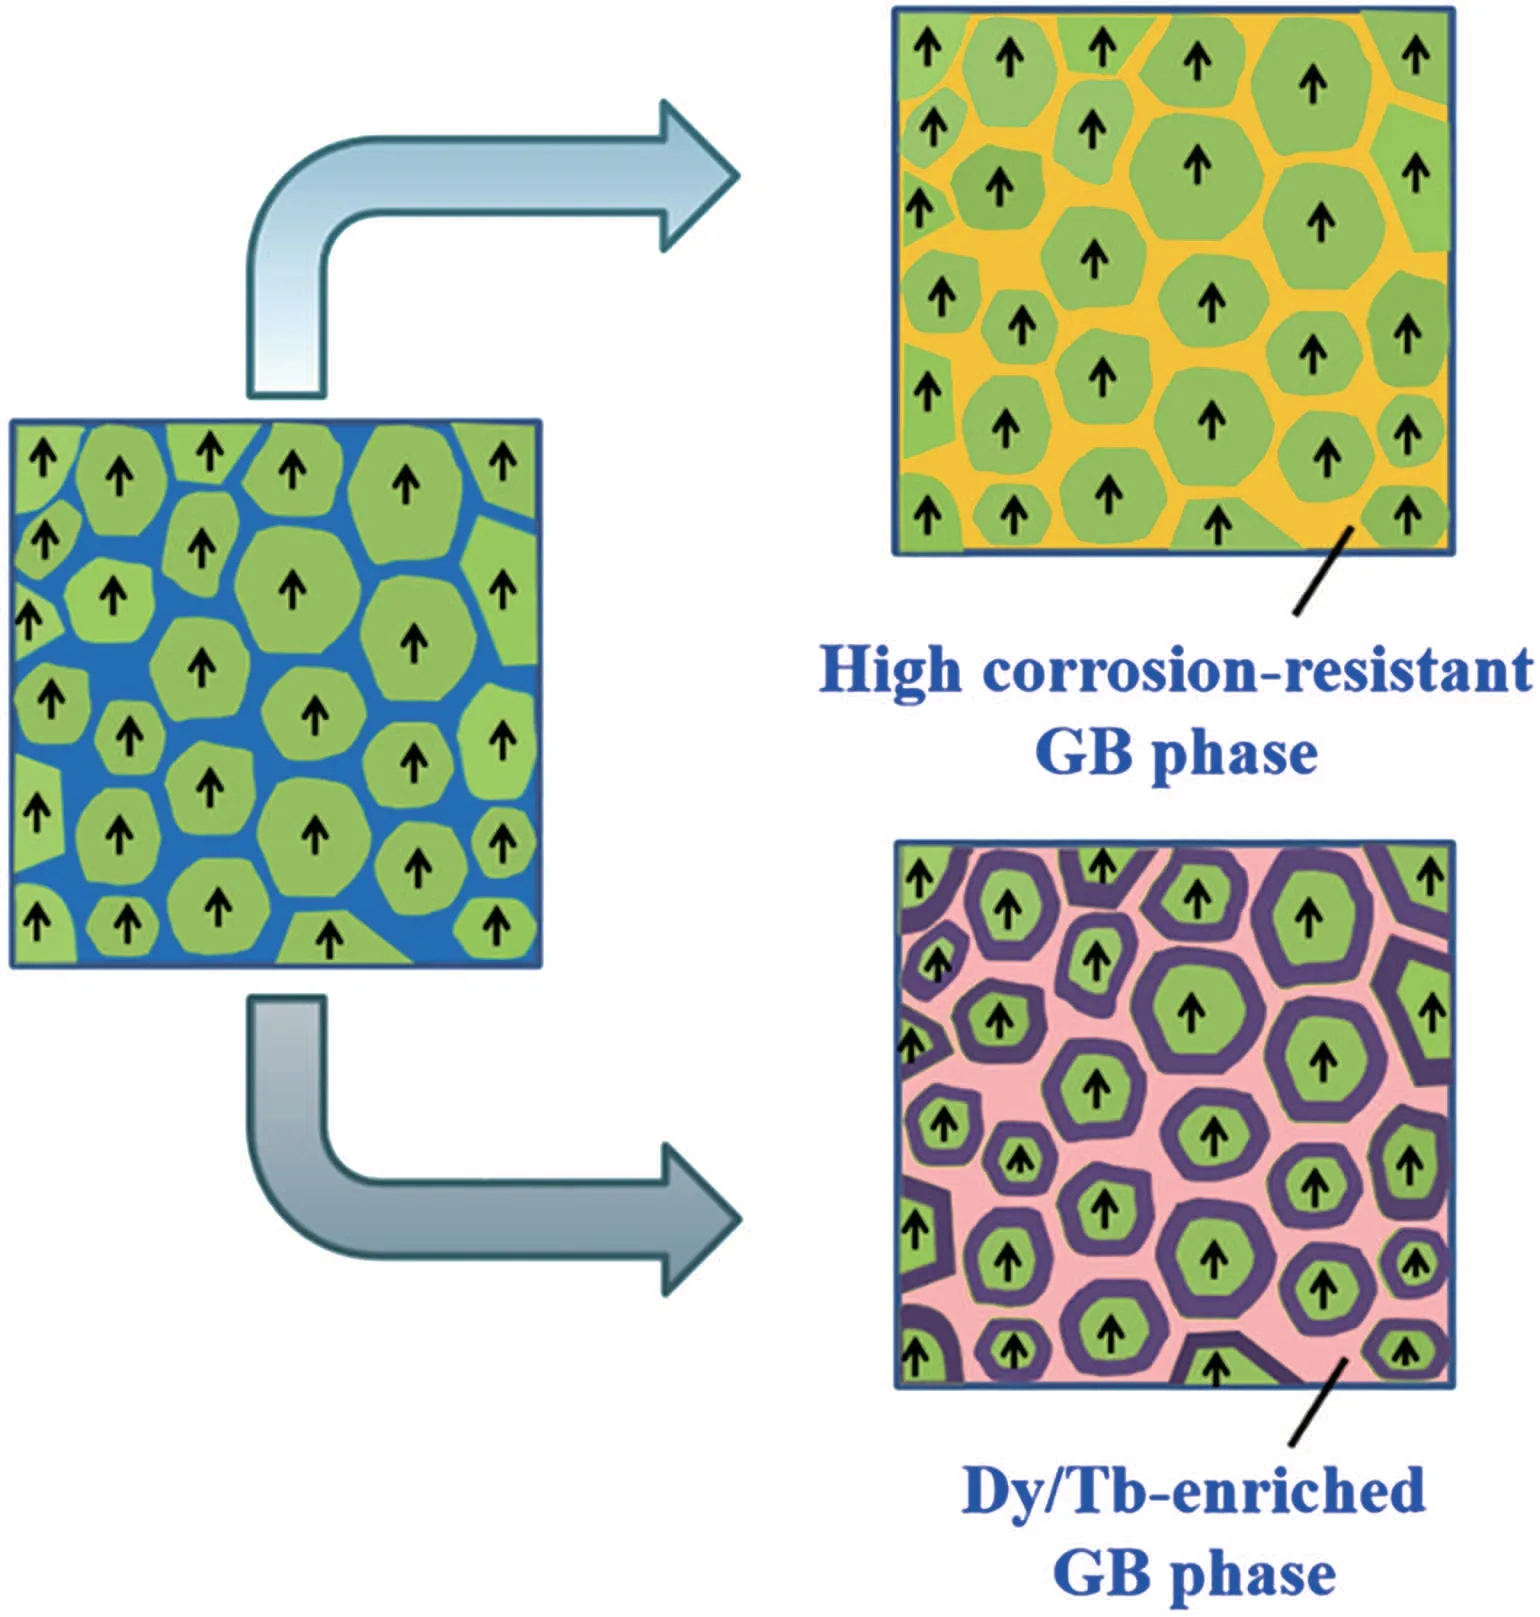
Fig.14. Schematics for GBR approach.
3. Application of high-abundant La/Y/Ce in Nd-Fe-B magnets
Rare-earths, the natural gems with unique chemical and physical properties, are indispensable components in many emerging and critical technologies.[19-23]In China, the main RE supplier, ~40 wt.% of such strategic sources are consumed by the 2:14:1-typed Nd-Fe-B magnets.[22]However,continually growing demand for Nd-Fe-B magnets and insecure supply for those closely-relied Nd/Pr/Dy/Tb due to geologic scarcity, extraction difficulties, and political volatility have caused severe concerns about REs availability, which may exert spill-over effects on global economy and security in the case of defense or military sectors.[20,78]Meanwhile,high-abundant and inexpensive La/Ce/Y[5-9](by-products of Nd/Pr/Dy/Tb during mineral extraction) are rarely used due to the inferior magnetic properties of (La/Ce/Y)2Fe14B to Nd2Fe14B.[4-18]
Recently, significant progress has been achieved that the binary main phase approach, i.e., sintering the mixture of 2:14:1-type Ce-free and Ce-containing powders,can suppress the magnetic dilution effect and induce preferable magnetic performance of (Nd, Ce)-Fe-B magnets. As a result, the Ce substitution level in Nd-Fe-B magnets has been significantly increased. Magnetic properties of (BH)max= 43.3 MGOe,Br=13.6 kG, and Hcj=9.26 kOe have been obtained with 30 wt.%Ce substitution for Nd.[7]The application of La and Y,however, is still a big challenge for balanced utilization of RE resources.[19-23]
3.1. La-Ce co-substitution
Stable 2:14:1-type tetragonal structure is the prerequisite for affording high intrinsic magnetic properties. However, under the circumstance of sole La substitution, unstable La2Fe14B phase tends to transform into α-Fe and La-B upon annealing at elevated temperatures in both as-cast and melt-spun La-Fe-B systems due to the large atomic radius of La.[18]Consequently, high La substitution for Nd in the (Nd,La)2Fe14B compounds has long been limited.[80]In our work,a new prototype of La-Ce co-substitution was proposed.[23]La of larger atomic radius expands the 2:14:1 phase lattice,induces the Ce valence shift towards +3 configuration, and strengthens the magnetization. Consequently, La and Ce can be utilized simultaneously,which not only guarantees the stability of La-containing 2:14:1 tetragonal phase, but also enhances the intrinsic magnetism of the Ce-rich 2:14:1 compounds.
3.1.1. La-Ce co-substituted RE2Fe14B compounds
Alloys with the nominal composition of[(Pr,Nd)1-x(La,Ce)x]2.14Fe14B (x=0, 0.1, 0.2, 0.3, 0.4, and 0.5) were prepared by induction melting and subsequent strip-casting at a copper wheel velocity of 1-4 m/s,which is commonly used for mass production of Nd-Fe-B sintered magnets.The raw materials include high-purity(above 99.5%)La-Ce alloy(35 wt.%La,65 wt.%Ce),Pr-Nd alloy(20 wt.%Pr,80 wt.%Nd),Fe-B(81.5 wt.%Fe,18.5 wt.%B)alloy,and Fe metal.
3.1.2. Crystallography anomaly
Figure 15 displays the step-scanned x-ray diffraction(XRD) patterns for [(Pr, Nd)1-x(La, Ce)x]2.14Fe14B (x=0-0.5) powders. The 2:14:1 tetragonal phase is formed for all samples with the characteristic reflections corresponding to those of RE2Fe14B (space group P42/mnm). To identify the structural changes and lattice parameters of the 2:14:1 tetragonal phase in La-Ce co-doped specimens concretely,Rietveld refinements of experimental XRD profiles(black colors)have been performed. The optimized theoretical fits (red colors)and differences (blue colors) are also plotted. The difference pattern in each curve indicates a good matching between the calculated and experimental values. The refined structural parameters a, c, and V (unit cell volume), and R factors are summarized in Table 2. Besides the matrix RE2Fe14B phase,small fractions of Fe and Nd phases (space group Im¯3m and P63/mmc, respectively) are also identified. Meanwhile, for specimens with high La-Ce content (x ≥0.3), REFe2phase(space group Fd¯3m) also appears, as verified by the appearance of additional reflection(220)at 2θ ≈34.6°(Fig.16(a)).Thermomagnetic characterizations for the sample with x=0.3 in Fig. 16(b) further confirm the existence of REFe2phase,whose Curie temperature corresponds to the observed phase transition peak at ~229.1 K.
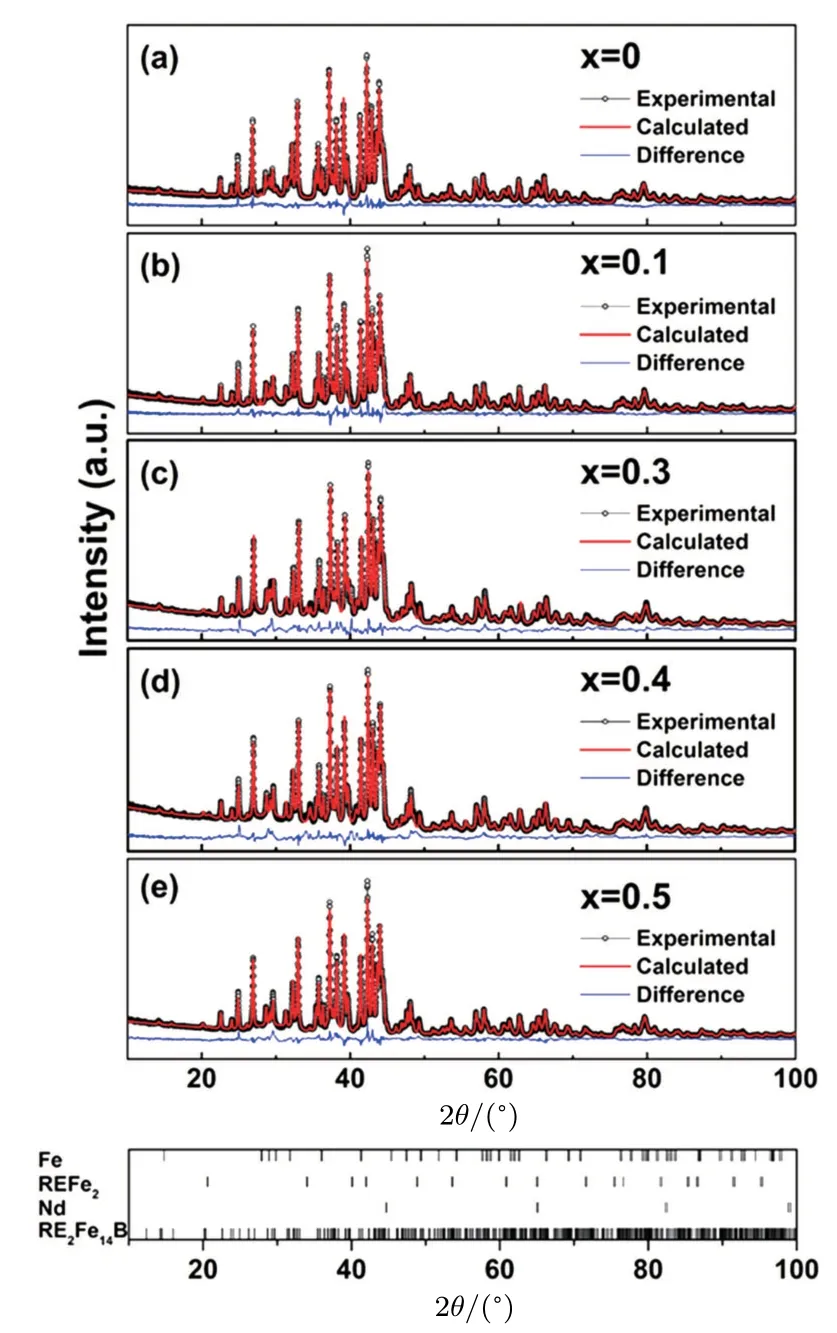
Fig. 15. Rietveld refinement of step-scanned XRD patterns of [(Pr,Nd)1-x(La, Ce)x]2.14Fe14B powders for (a) x = 0, (b) x = 0.1, (c)x=0.3,(d)x=0.4,and(e)x=0.5 at room temperature. Experimental pattern,calculated pattern,and their differences are shown in black,red,and blue colors,respectively. Bottom ticks mark the characteristic Bragg positions of RE2Fe14B,Nd,REFe2,and Fe phases,and serve as a guide to the eye.[23]
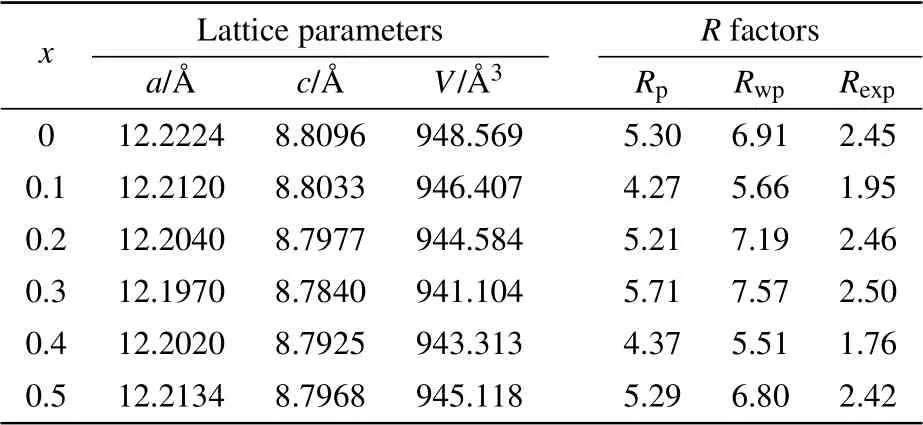
Table 2. Refined lattice parameters a, c, and V, and R factors for the[(Pr,Nd)1-x(La,Ce)x]2.14Fe14B powders(x=0-0.5).[23]
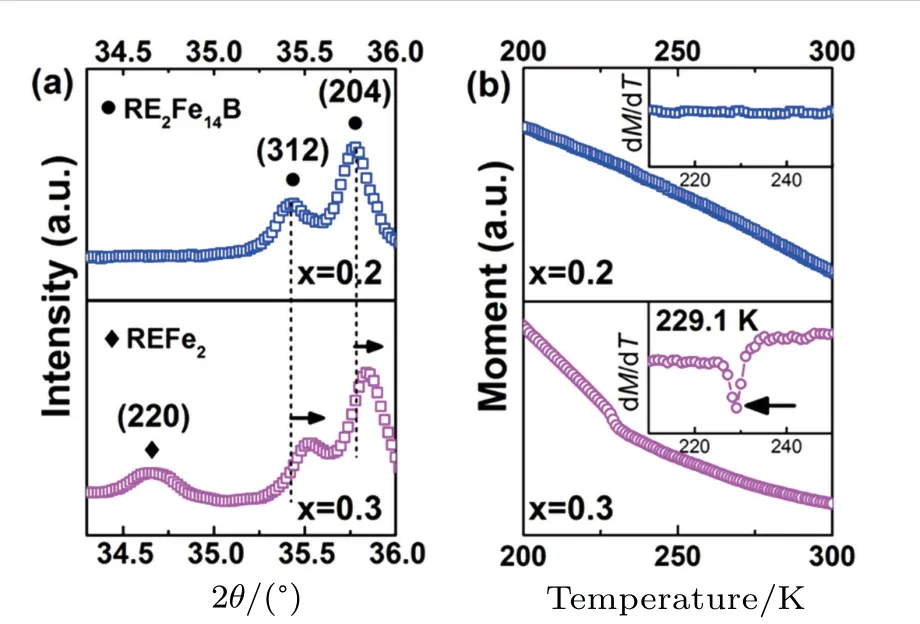
Fig. 16. (a) Enlarged XRD patterns of 2θ between 34.3° and 36° for samples of x=0.2 and x=0.3.(b)M-T curves for the samples(x=0.2 and x=0.3)in the temperature range of 200-300 K.Their corresponding dM/dT-T curves are shown in the top-right insets.[23]
Figure 17(a) shows the enlarged XRD profiles with 2θ from 41°to 44.2°,illustrating the shift of those characteristic diffraction peaks of the 2:14:1 phase with varied x. For example,the(410)peak,as pointed out by dotted lines and arrows,firstly shifts to higher Bragg angle(0 ≤x ≤0.3)and then turns to the lower side(0.3 <x ≤0.5),suggesting a non-linear dependence of the lattice spacing on the La-Ce content x. The corresponding lattice parameters a,c,a/c and unit cell volume V for the tetragonal phase determined from the Rietveld refinements are plotted in Fig.17(b).The a and c for(Pr,Nd)2Fe14B(x = 0) are 8.8096 ˚A and 12.2224 ˚A, respectively, in good agreement with the previously established results.[9]For the La-Ce co-doped samples,a,c,and V do not linearly decrease or increase with increasing La-Ce content. When x is below 0.3(composition range I in Fig.17(b)),the lattice parameters decrease and can be approximately estimated by
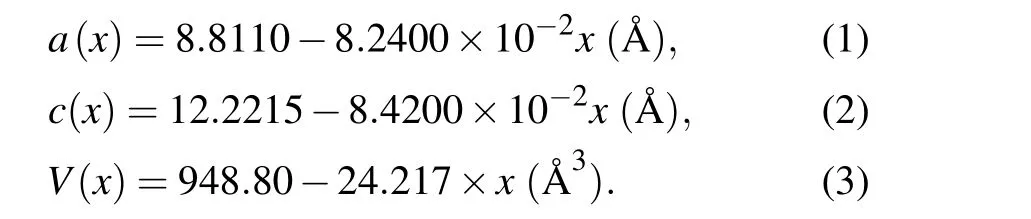
Further increasing La-Ce content to 0.4 and 0.5(composition range II),a,c,and V follow the opposite tendencies given by
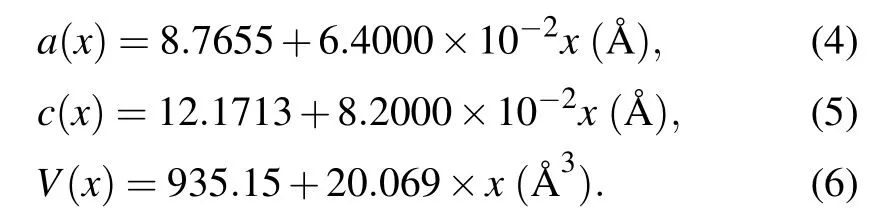
The linear reductions of a and c in composition range I (0 ≤x ≤0.3)are commonly observed when Ce substitutes for Nd,following the empirical alloying theory. In composition range II (0.3 <x ≤0.5), however, the lattice parameters increase with growing La-Ce content.
Sole La substitution generally leads to 2:14:1 phase instability. However, in the present work of La-Ce co-doping,the c/a ratio keeps basically unchanged (Fig. 17(b)) despite of crystallographic anomalies in a, c, and V. It suggests that increasing La-Ce substitution for Pr-Nd will not deteriorate the stability of the 2:14:1 tetragonal structure even with x up to 0.5. To further investigate the stability of the 2:14:1 phase, a thermal DSC analysis was carried out(upon heating to 1550 K as shown in Fig. 18(a)). An obvious endothermic peak is observed at 1471.4 K for the(Pr,Nd)2.14Fe14B specimen,which corresponds to the melting point of the RE2Fe14B phase. Increasing La-Ce substitution for Pr-Nd lowers the melting point to 1455.6 K for x=0.1, 1438.9 K for x=0.3,and 1419.6 K for x=0.5, respectively. When x is increased to 0.3 and 0.5, other relatively weak endothermic transitions are observed at 1356.4 K and 1348.6 K, respectively, which match the previously reported melting point of the REFe2phase.[81]Based on the thermal analysis,the strip with x=0.5 was quenched into ice-water after annealing at 1250 K for 1 h to evaluate the high-temperature stability of the 2:14:1 phase.The XRD profile (Fig. 18(b)) on the wheel side of the specimen shows that after quenching, the 2:14:1 matrix phase is stable. Minor REFe2impurity also exists in this high La/Cecontaining specimen. Consequently,we can conclude that the 2:14:1-type tetragonal structure is well retained by La and Ce co-doping into the(Pr,Nd)2.14Fe14B compounds.
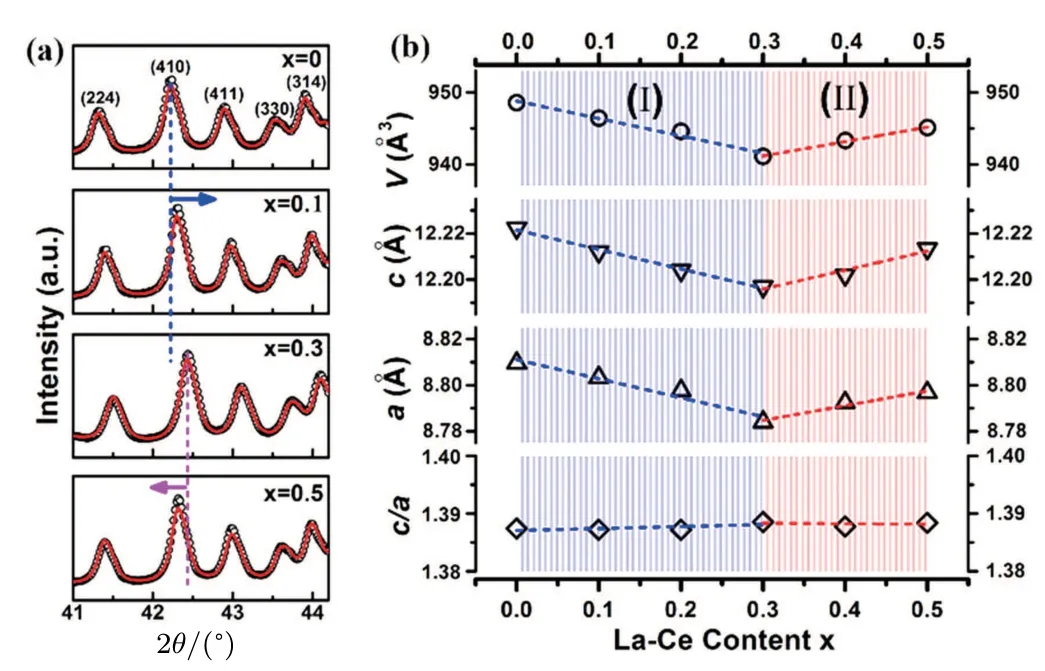
Fig. 17. (a) Enlarged Rietveld refined XRD patterns of 2θ between 41°-44.2° for [(Pr, Nd)1-x(La, Ce)x]2.14Fe14B powders. (b) Dependences of lattice parameters a,c,c/a ratio and unit cell volume V of the 2:14:1 tetragonal phase on the La-Ce content x.[23]
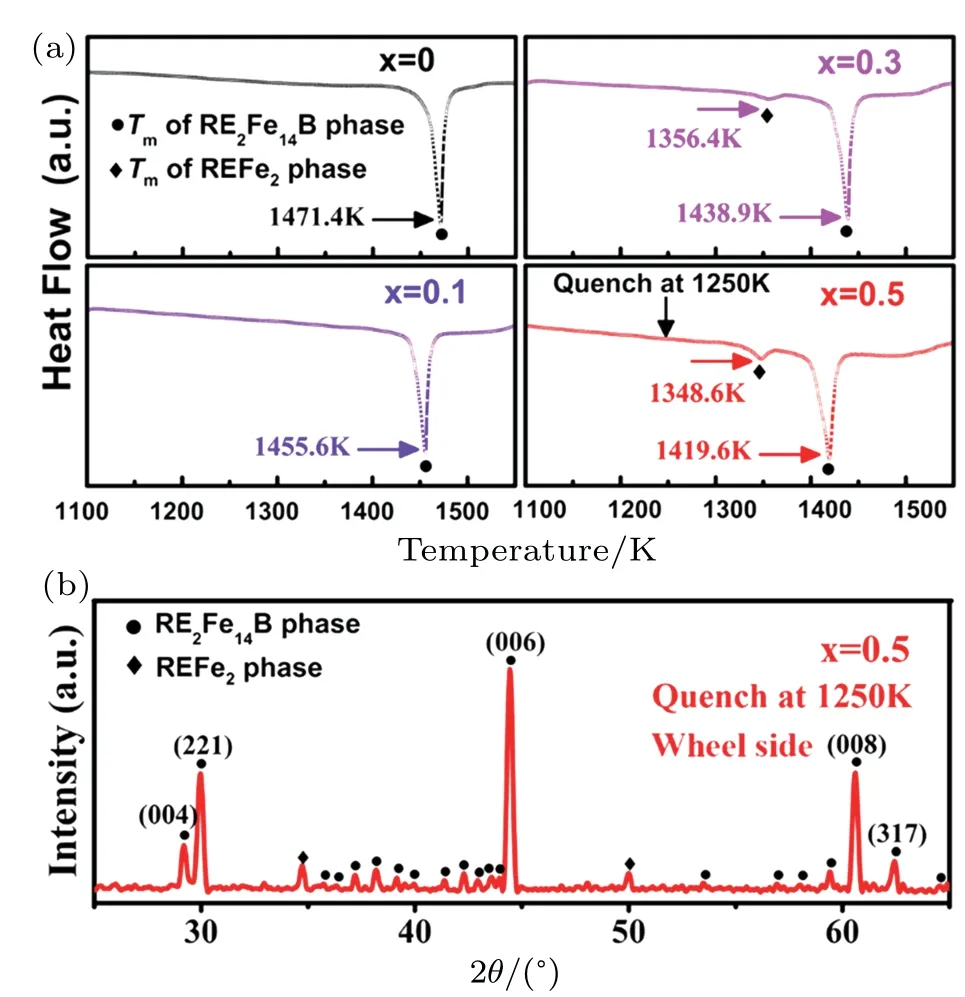
Fig. 18. (a) DSC curves for specimens with x=0, 0.1, 0.3, and 0.5 upon heating to 1550 K at 20 K/min. (b) XRD pattern of the as-quenched [(Pr,Nd)0.5(La, Ce)0.5]2.14Fe14B (x=0.5) strip after annealing at 1250 K for 1 h.[23]
3.1.3. Valence anomaly
Since the chemical state of Ce is sensitive to neighboring environment,[9]there is a high possibility that the Ce valence changes with varied x. As Ce3+ion possesses a substantially larger radius (~1.14 ˚A) than that of Ce4+(~0.97 ˚A), the appearance of Ce valence towards one 4f-carrying +3 is expected to produce the anomalous lattice expansion. XPS characterizations verify the Ce valence change with increasing La-Ce content, as depicted in Fig.19. A Tougaard procedure[82]is used to remove the background (blue color in Fig. 19(a)).When x ≤0.3, no obvious change in the Ce 3d spectra can be detected with different La-Ce contents. Further increasing La-Ce content from 0.3 to 0.4 and 0.5(composition range II), the peak intensity declines for Ce3d5/2f0lines (indicated by red arrows)and increases for the Ce3d3/2f2ones(indicated by blue arrows). The ratio r0(r0=If0/(If0+If1+If2))is calculated to evaluate the mixed valence of Ce, where Ifx represents the weight of the fxpeak in the spectrum. As shown in Fig. 19(b), where the If0+If1+If2intensity is normalized to 1,If0diminishes gradually from 0.1343 to 0.0913 and 0.0564 with x is gradually increased from 0.3 to 0.4 and 0.5. This relatively lowered Ce4+ratio (r0) with enhanced Ce3+ratio reveals the shift of Ce valence towards the favorable Ce3+state with 4f moment, verifying that La-Ce co-doping provides a way to manipulate the Ce valence by changing the La-Ce concentration. As Ce3+ion possesses a substantially larger radius(~1.14 ˚A)than that of Ce4+(~0.97 ˚A),the appearance of Ce valence towards+3 state(carrying one 4f electron)is expected to be accompanied by an anomalous lattice expansion at the composition range of x >0.3,being consistent with the results in Fig. 17(b). Besides, as demonstrated in Fig. 20, the electronic states of B/Fe/La/Nd remain unchanged with increasing La-Ce content, further excluding their possible influences on the anomalous change of the lattice parameters.
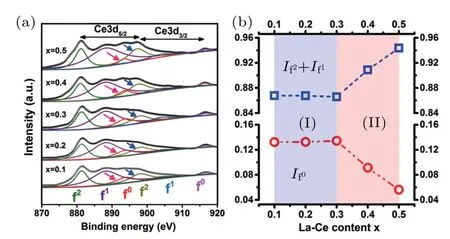
Fig. 19. (a) XPS spectra of the Ce 3d level in [(Pr, Nd)1-x(La,Ce)x]2.14Fe14B strips with x=0.1-0.5. (b) The derived intensities of If0 (circles in red color)and(If1+If2)(squares in blue color)are plotted as a function of La-Ce content x.[23]
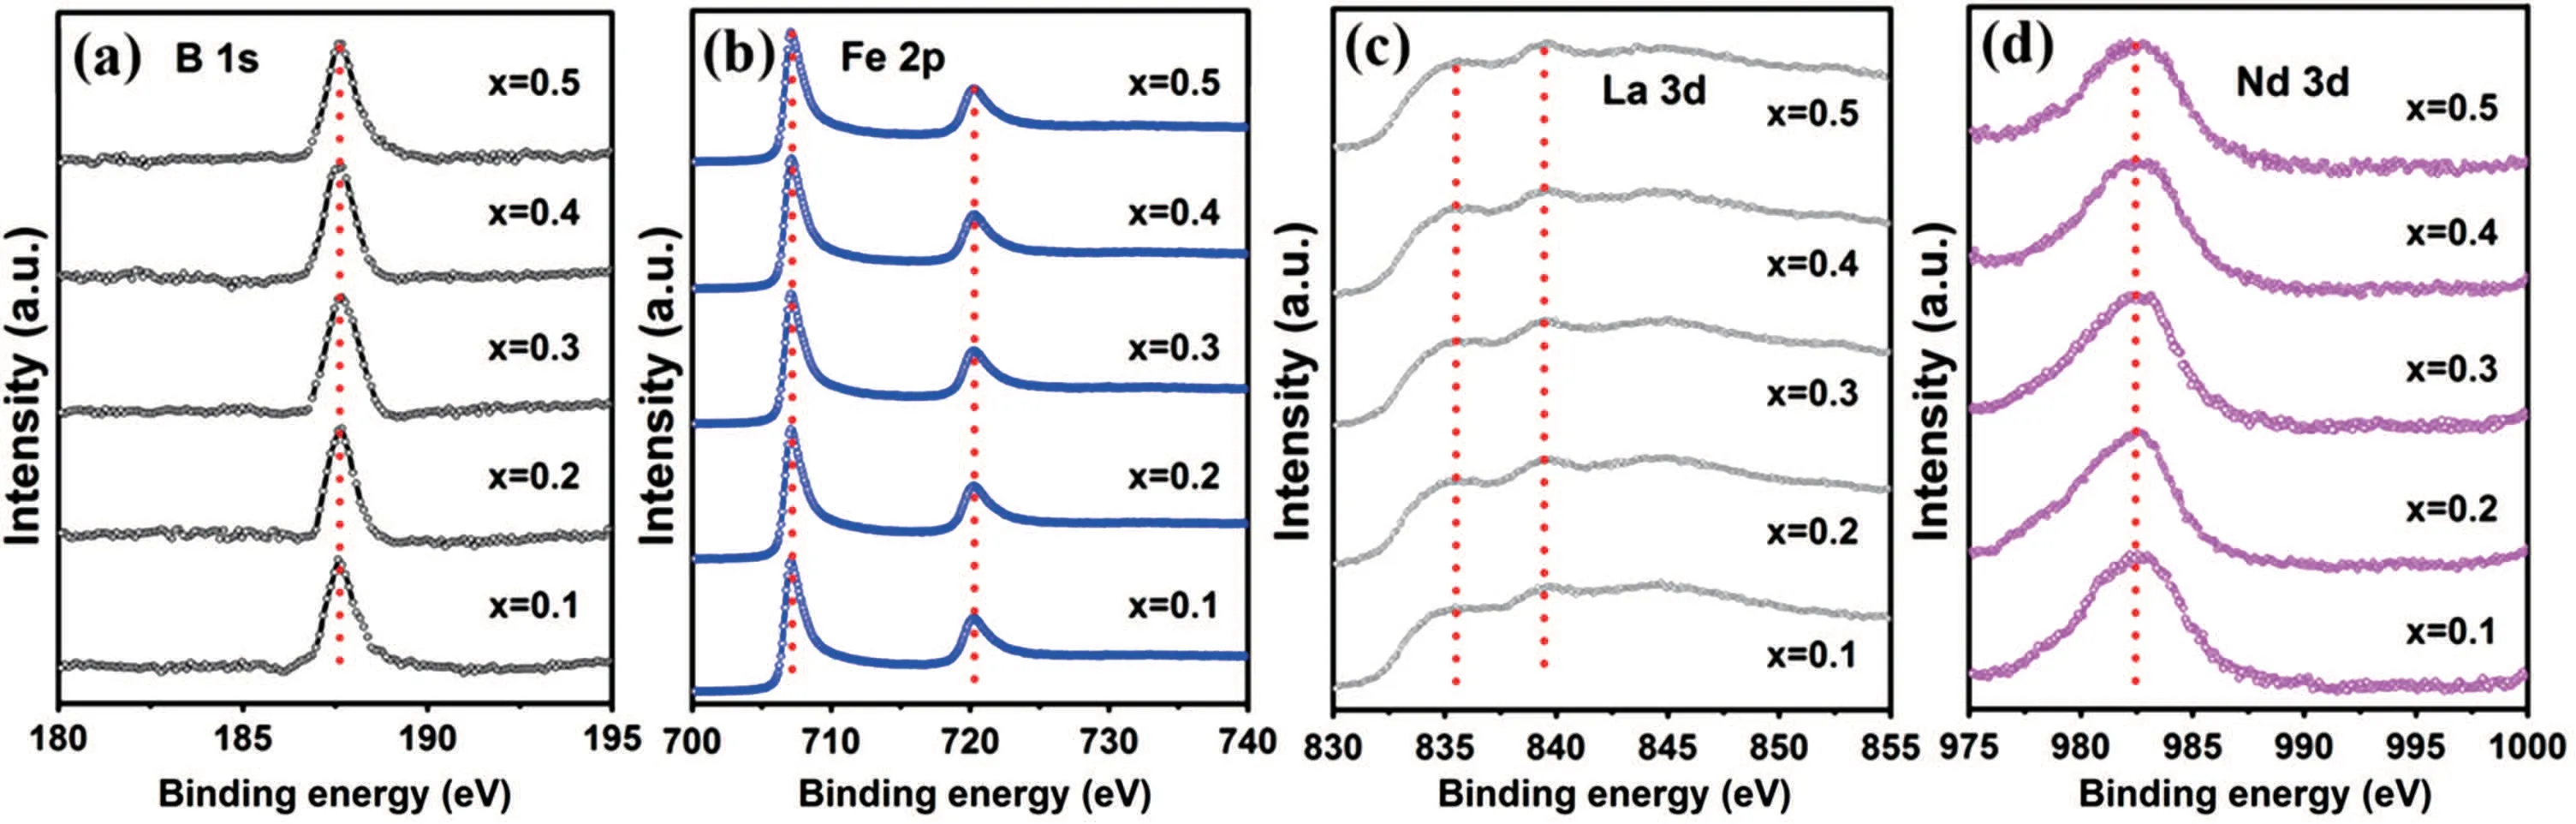
Fig. 20. XPS spectra of (a) B 1s level, (b) Fe 2p level, (c) La 3d level, and (d) Nd 3d level in [(Pr, Nd)1-x(La, Ce)x]2.14Fe14B strips with x=0.1-0.5.[23]
3.1.4. Magnetism anomaly
Figure 21(a)shows the initial magnetization curves of the[(Pr, Nd)1-x(La, Ce)x]2.14Fe14B strips at 295 K. The magnetization saturates at 90 kOe for all the samples, the value at which is then regarded as the saturation magnetization Ms. In the composition range I (Fig. 21(d)), Msdecreases monotonically from 162.7 emu/g to 147.0 emu/g when x is increased from 0 to 0.3. On the contrary, in the composition range II, the samples with x=0.4 and 0.5 possess much larger Ms(156.5 emu/g and 151.1 emu/g, respectively). Though Msof[(Pr, Nd)0.5(La, Ce)0.5]2.14Fe14B is smaller than that of [(Pr,Nd)0.6(La,Ce)0.4]2.14Fe14B due to the deteriorated interaction between the RE and Fe, it remains anomalously higher than the value for x=0.3. Since the moment of the REFe2phase is smaller than that of the RE2Fe14B phase,its appearance can only deteriorate the net magnetization. Figure 16(b)also indicates that the REFe2phase is paramagnetic at 295 K. Moreover, its fraction is quite small as revealed by the Rietveld analysis in Fig. 15. Consequently, the abnormal increase in Msfor x=0.4 and 0.5 cannot be attributed to the existence of secondary REFe2phase. Meanwhile, characterizations on the Curie temperature TC(Figs.21(b)and 21(d))also reveal a decreasing trend with increased La-Ce concentration, further excluding the effects of TCon the abnormal magnetization enhancement at 295 K in the composition range II. Instead, it is resulted from the shift of Ce valence towards the +3 state(as indicated by the XPS spectra in Fig.19)and the extra contribution of the 4f electron. Further characterizations on the spin reorientation temperature TSR(Figs.21(c)and 21(d))also show that TSRdiminishes with increased La-Ce content, and deviates from the linear fit of decrease with x=0.3, 0.4, and 0.5. It suggests that the Ce valence change with one localized 4f moment also has an appreciable effect on lowering the spin reorientation temperature and retaining a[001]easy-axis alignment of magnetization in the low temperature range.
Previous research has shown that sole La substitution for Nd is beneficial to enlarge the unit cell size of the 2:14:1 phase and Ce incorporation alone decreases the lattice. In this study,La and Ce co-doping into the (Pr, Nd)2.14Fe14B compounds during induction melting,however,results in non-linear variation of the lattice parameters with increasing La-Ce content x.At low La-Ce doping levels(x below 0.3),the reduced lattice constants are dominated by Ce addition.Afterwards,when the La-Ce content is above 0.3,the influence of La on expanding the unit cell increases(Fig.17)and induces a Ce valence shift towards the +3 state (Fig. 19). Upon tuning the preferable Ce3+valence,one 4f electron plays a positive role in enhancing the total magnetization as Ce is ferromagnetically coupled with Fe. Hence the magnetization measured in this work exhibits an abnormal increment when x exceeds 0.3(Fig.21).
The finding that Ce valence can be manipulated by La-Ce co-doping is of significant importance. La with larger atomic radius plays an indispensable role in inducing a favorable Ce valence shift and higher intrinsic magnetic properties,thus suppressing the magnetic dilution in La/Ce-containing RE2Fe14B system. It provides a substantial possibility for developing high-performance RE-Fe-B magnets at significantly reduced material cost. As of February 2016,the cost of La-Ce alloy is approximately one-twelfth of Pr-Nd alloy(up-to-date RE cost is available at the website),thus the total material cost can be lowered by about 57%with 50 at.%La-Ce replacement for Pr-Nd,e.g.,$22 per kg for(Pr,Nd)2Fe14B versus$9.5 per kg for[(Pr,Nd)0.5(La,Ce)0.5]2.14Fe14B.In our on-going work,bulk (Pr, Nd, La, Ce)-Fe-B sintered magnets are prepared with La-Ce content as high as 50%. As shown in Fig.22,the sintered magnet with 50 at.%La-Ce co-substitution for Pr-Nd exhibits a much higher remanence Brof 12.8 kGs, compared to that with single doping of La(12.2 kGs)or Ce(12.4 kGs)at the same concentration and processing routine.The La-Ce cosubstitution also provides a new recipe that the most abundant Ce and La can be utilized simultaneously in the hard magnets,contributing to the sustainable and balanced development of RE industry.
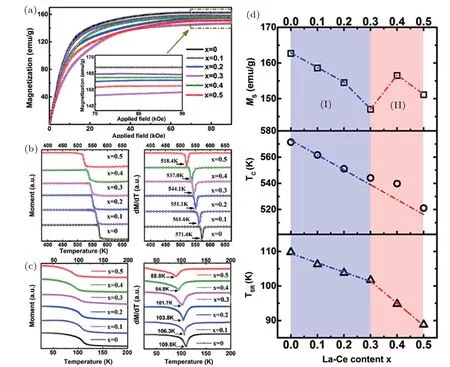
Fig.21. (a)Initial magnetization curves measured at 295 K.The inset is an enlarged view of the high-field regime. The M-T and dM/dT-T curves in the temperature ranges of (b) 380-670 K and (c) 25-200 K for [(Pr, Nd)1-x(La, Ce)x]2.14Fe14B (x=0-0.5) samples. (d) The derived saturation magnetization Ms,Curie temperature TC,and spin reorientation temperature TSR as a function of La-Ce content x.[23]
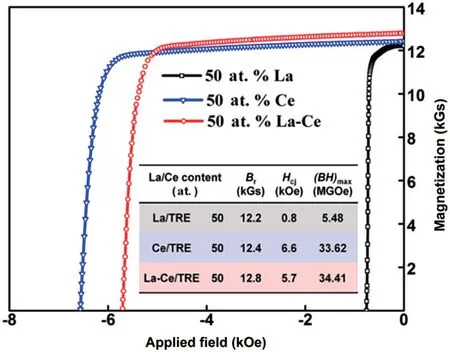
Fig. 22. Demagnetization curves of sintered permanent magnets with 50 at.%La-Ce substitution,compared to those with La or Ce incorporation alone.The inset shows the detailed magnetic properties including Br,Hcj,and(BH)max.[23]
3.1.5. La-Ce co-substituted RE-Fe-B sintered magnets
Magnetic powders with nominal compositions of (Pr,Nd)29.8Gd1.7FebalM1.1B1.0(I: La/Ce-free terminal) and (Pr,Nd)20.3(La,Ce)9.5Gd1.7FebalM1.1B1.0(II:La/Ce-rich terminal,with 30 wt.%La-Ce concentration of TRE)(M=Cu,Al,Nb,Zr,in wt.%)were prepared by induction melting,strip casting,hydrogen decrepitation,and jet milling. The raw material Pr-Nd alloy denotes a 20 wt.%Pr-80 wt.%Nd composition,and the La-Ce alloy is composed of 35 wt.%La and 65 wt.%Ce.By tuning the mass ratios of the two typed powders,multiple main phase (MMP) magnets of 9 wt.%, 12 wt.%, 15 wt.%,18 wt.% La-Ce (La-Ce content of TRE) were prepared via conventional powder metallurgy process. After pressed under 5.5 MPa in a perpendicular magnetic field of 1.5 T and isostatic compressing under 200 MPa, the green compacts were sintered at 1000-1075°C and subsequently annealed at 870-900°C and 460-620°C. Meanwhile, the starting magnet (by only using La/Ce-free terminal)and single main phase(SMP)magnets (by direct alloying 3 wt.%, 6 wt.%, 9 wt.% La-Ce into component I)were prepared under the same condition.
3.1.6. Microstructure of (La, Ce, Pr, Nd)-Fe-B magnets
Despite that the back-scattered SEM image (Fig. 23) reveals a bi-phase morphology, the grey main phase and bright RE-rich phase, EPMA investigation depicts that the RE concentration in the main phase differs a lot either over local regions within an individual grain or across grains, being completely different from the directly alloyed magnet where La/Ce/Nd are homogenously distributed in the main phase(Fig. 23(b)). Within one individual grain, gradient RE distributions are formed, i.e., obvious core-shell structures that the La/Ce-rich grain is surrounded by a Nd-rich shell, and the La/Ce-lean one with a La/Ce-rich shell simultaneously.
The coexistence of La/Ce-lean and La/Ce-rich grains reveals a global RE concentration fluctuation. Such peculiar chemical heterogeneity originates from the initial composition gradient between La/Ce-free(green)and La/Ce-rich(red)2:14:1 terminals as schematically shown in Fig.23(c).During liquid-phase sintering, elemental interdiffusion is generated via the liquid RE-rich phase, e.g., La/Ce diffuse from La/Ce-rich grains to La/Ce-free ones(red arrow),and Pr/Nd follow the reverse direction(green arrow). However,on account of limited thermal diffusion below the melting points of RE2Fe14B compounds,La/Ce and Pr/Nd cannot immigrate homogenously,leading to the global chemical fluctuations. Meanwhile, for a specific grain, the high-temperature diffusion state is retained, leading to the aforementioned local chemical heterogeneity(coreshell structure). Consequently, such chemically inhomogeneous magnets contain multiple main phases (hereafter, denoted as MMP magnet), which are different from the single main phase structure in a chemically homogeneous magnet(Figs.23(a)and 23(b)).
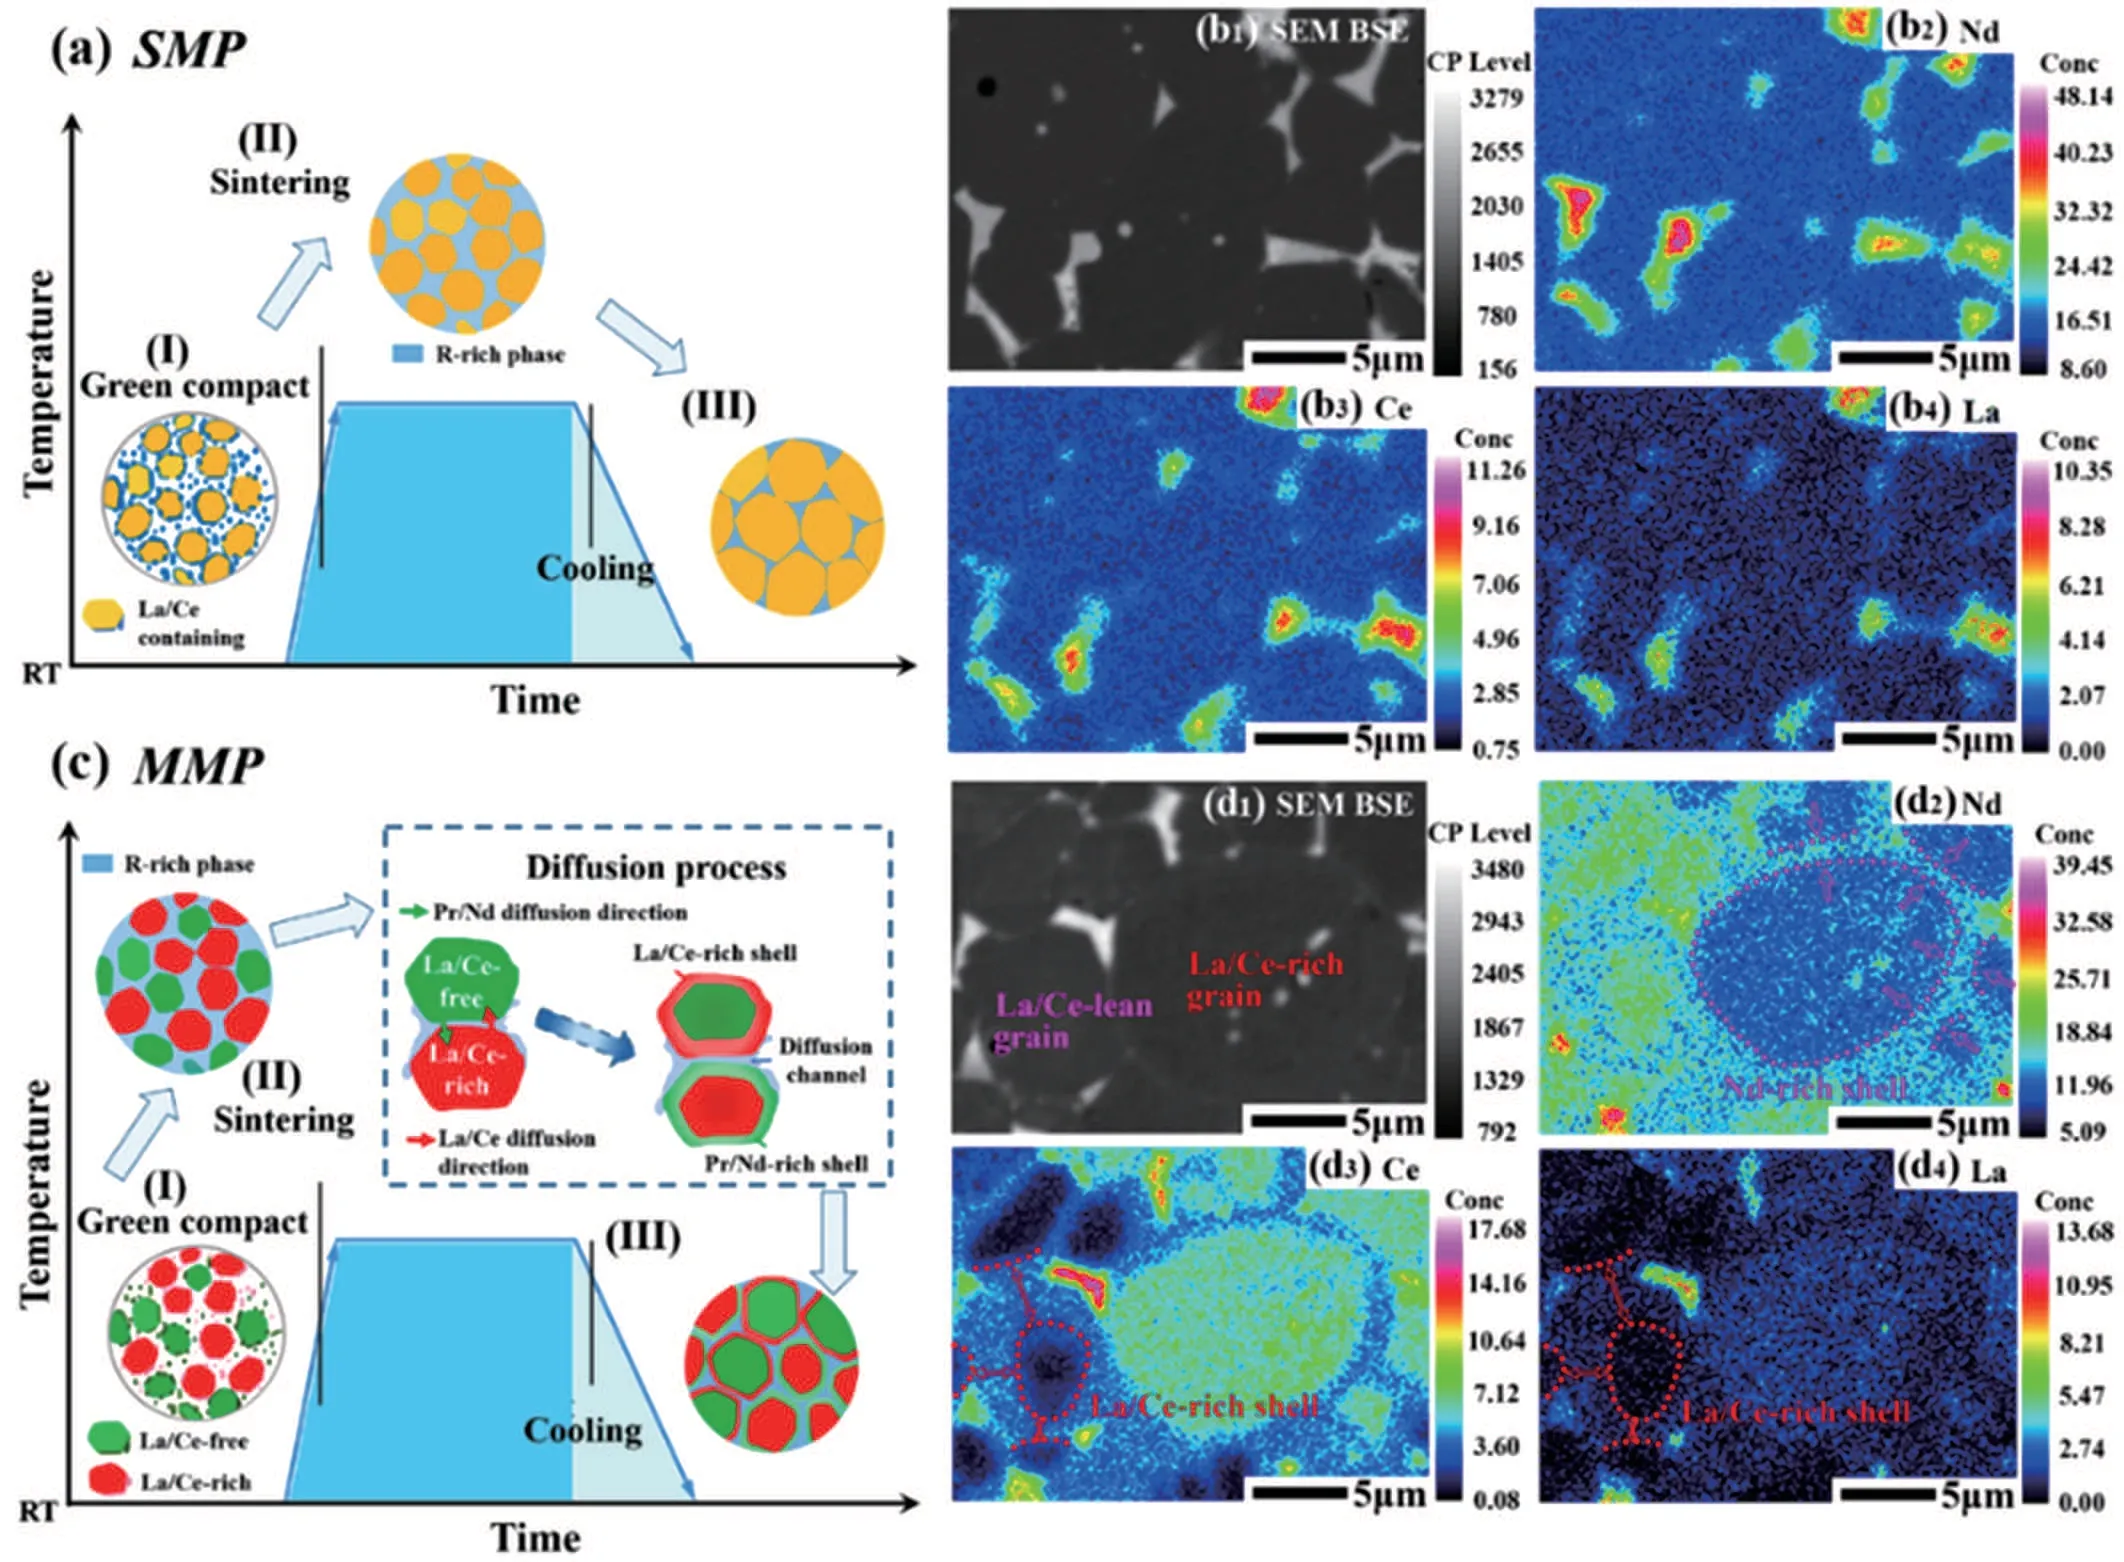
Fig.23. Chemical heterogeneity of MMP magnets compared to the chemically homogeneous SMP ones. Schematics in(a)and(c)show the evolution of different microstructures for SMP and MMP magnets,respectively. Back-scattered SEM micrographs(bright and grey contrasts refer to RE-rich and matrix phases, respectively) and corresponding elemental mappings of Nd, Ce, and La for (a) MMP magnet with 18 wt.% La-Ce/TRE and (b) SMP magnet with 9 wt.%La-Ce/TRE.(e)Room temperature demagnetization curves for SMP and MMP magnets. (f)Dependence of magnetic properties on La-Ce concentration for SMP and MMP magnets.[22]
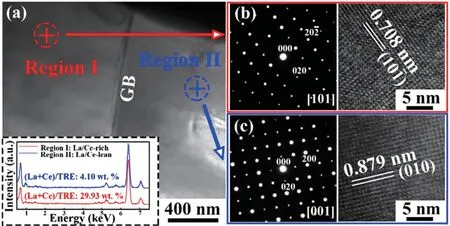
Fig.24. Local crystal features of the MMP magnet with 18 wt.%La-Ce. (a) Bright field image. The inset is EDS spectra at regions I and II,showing the detailed(La+Ce)/TRE ratio(wt.%). SAED pattern and HRTEM image of(b)region I and(c)region II in(a).[22]
TEM characterizations of MMP magnets show that the inhomogeneous La/Ce distribution within or across the grains
does not break the crystal symmetry of the main phase(Figs. 24 and 25), but leads to dramatically differed lattice parameters. Elemental detections at different grains (inset of Fig. 24(a)) reveal that the ratio of La-Ce/TRE varies, i.e.,~29.93 wt.%in region I,close to the La/Ce-rich terminal,and~4.10 wt.%(La/Ce-lean)in region II.Selected area electron diffraction (SAED) patterns (Figs. 24(b) and 24(c)) demonstrate that both regions possess the same tetragonal crystal symmetry (space group P42/mnm[4]). Their lattice parameters, however, are rather different. In region I, the d-spacing is 0.708 nm for the10¯1plane,fairly lower than the standard JCPDS data (0.714 nm) for Nd2Fe14B.[4]In region II, the dspacing is 0.879 nm for the(010)plane,close to 0.880 nm of JCPDS data. As La-Ce substitution in the 2:14:1 phase basically leads to a contracted unit cell,[8]the higher La-Ce content, the larger deviation of d-spacing from Nd2Fe14B. Similarly, within one individual main phase grain, there also exist local regions with different La-Ce contents,possessing the same tetragonal crystal symmetry (Fig. 25). As a result, the intrinsic magnetic properties, i.e., JSand HA, of the 2:14:1 tetragonal phase with different La/Ce contents have strong local variations accordingly.

Fig. 25. Local crystal features of the MMP magnet. (a) Bright field image showing five local regions numbered 1-5. Their corresponding SAED patterns and HRTEM images are shown in(b)-(f),respectively. Their(La+Ce)/TRE contents(wt.%)are plotted in(g).[22]
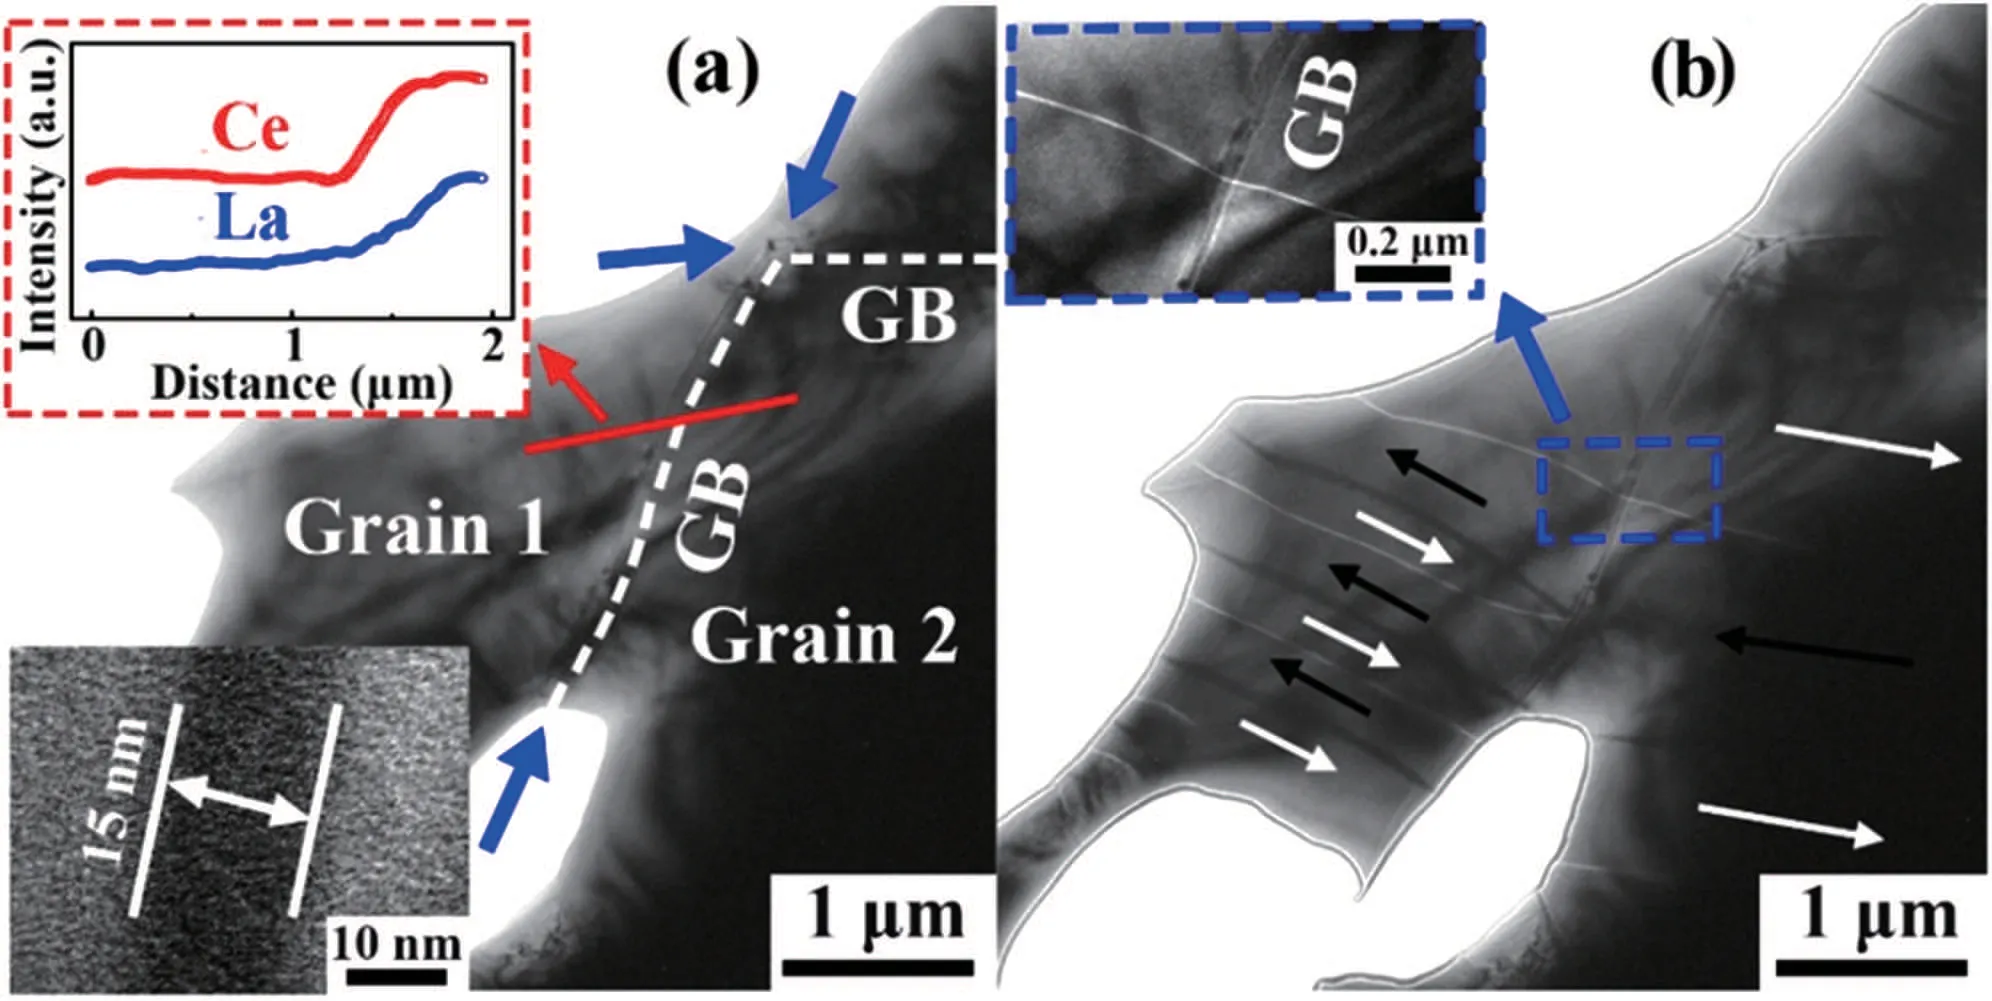
Fig.26. Local domain features of the MMP magnet with 18 wt.%La-Ce. (a) In-focus and (b) over-focus Lorentz TEM images of the thermally demagnetized sample(c-axis in-plane view). In the in-focus image,neighboring grains 1(low La/Ce)and 2(high La/Ce)are separated by the GB layers (indicated by white dotted curves and blue arrows).The upper inset shows the EDS line scan(red solid line),and the bottom one is an enlarged view of the GB regions(~15 nm). The over-focus image reveals bright and dark contrasts of the domain walls (an alternating 180° wall pattern, as depicted by arrows), which are produced by opposite magnetizations between adjacent domains. The inset in(b)enlarges a continuous domain wall across the thick GB.[22]
A following critical question then arises: how does the local fluctuation of intrinsic magnetic properties influence the macroscopic magnetization reversal? To answer this question,the local magnetic domain structure of the MMP magnet is characterized by Lorentz TEM(Fig.26). The domain width δ is fairly uneven both within one individual grain and adjacent grains. In grain 1, δ of the upper part is larger than that of the bottom one. δ for grain 2 is almost twice the width for the neighboring grain 1. The non-equidistant domain width reflects different intrinsic magnetic properties in local regions led by the chemical heterogeneity and short-range exchange coupling effects. Besides, some domain walls are continuous (see the inset of Fig. 26(b)) across the relatively thick GB (~15 nm), suggesting that the GB layer cannot isolate completely the adjacent grains. Such connecting intergrain domains have been previously ascribed to exchange coupling or magnetostatic interaction.[31]However, since the adjacent grains are in micron size and separated by thick GB layers,the intergrain exchange coupling could be very weak and the magnetostatic interaction dominates. The large domains produced by magnetic interactions are also observed using Kerr microscopy(Figs.27 and 28).
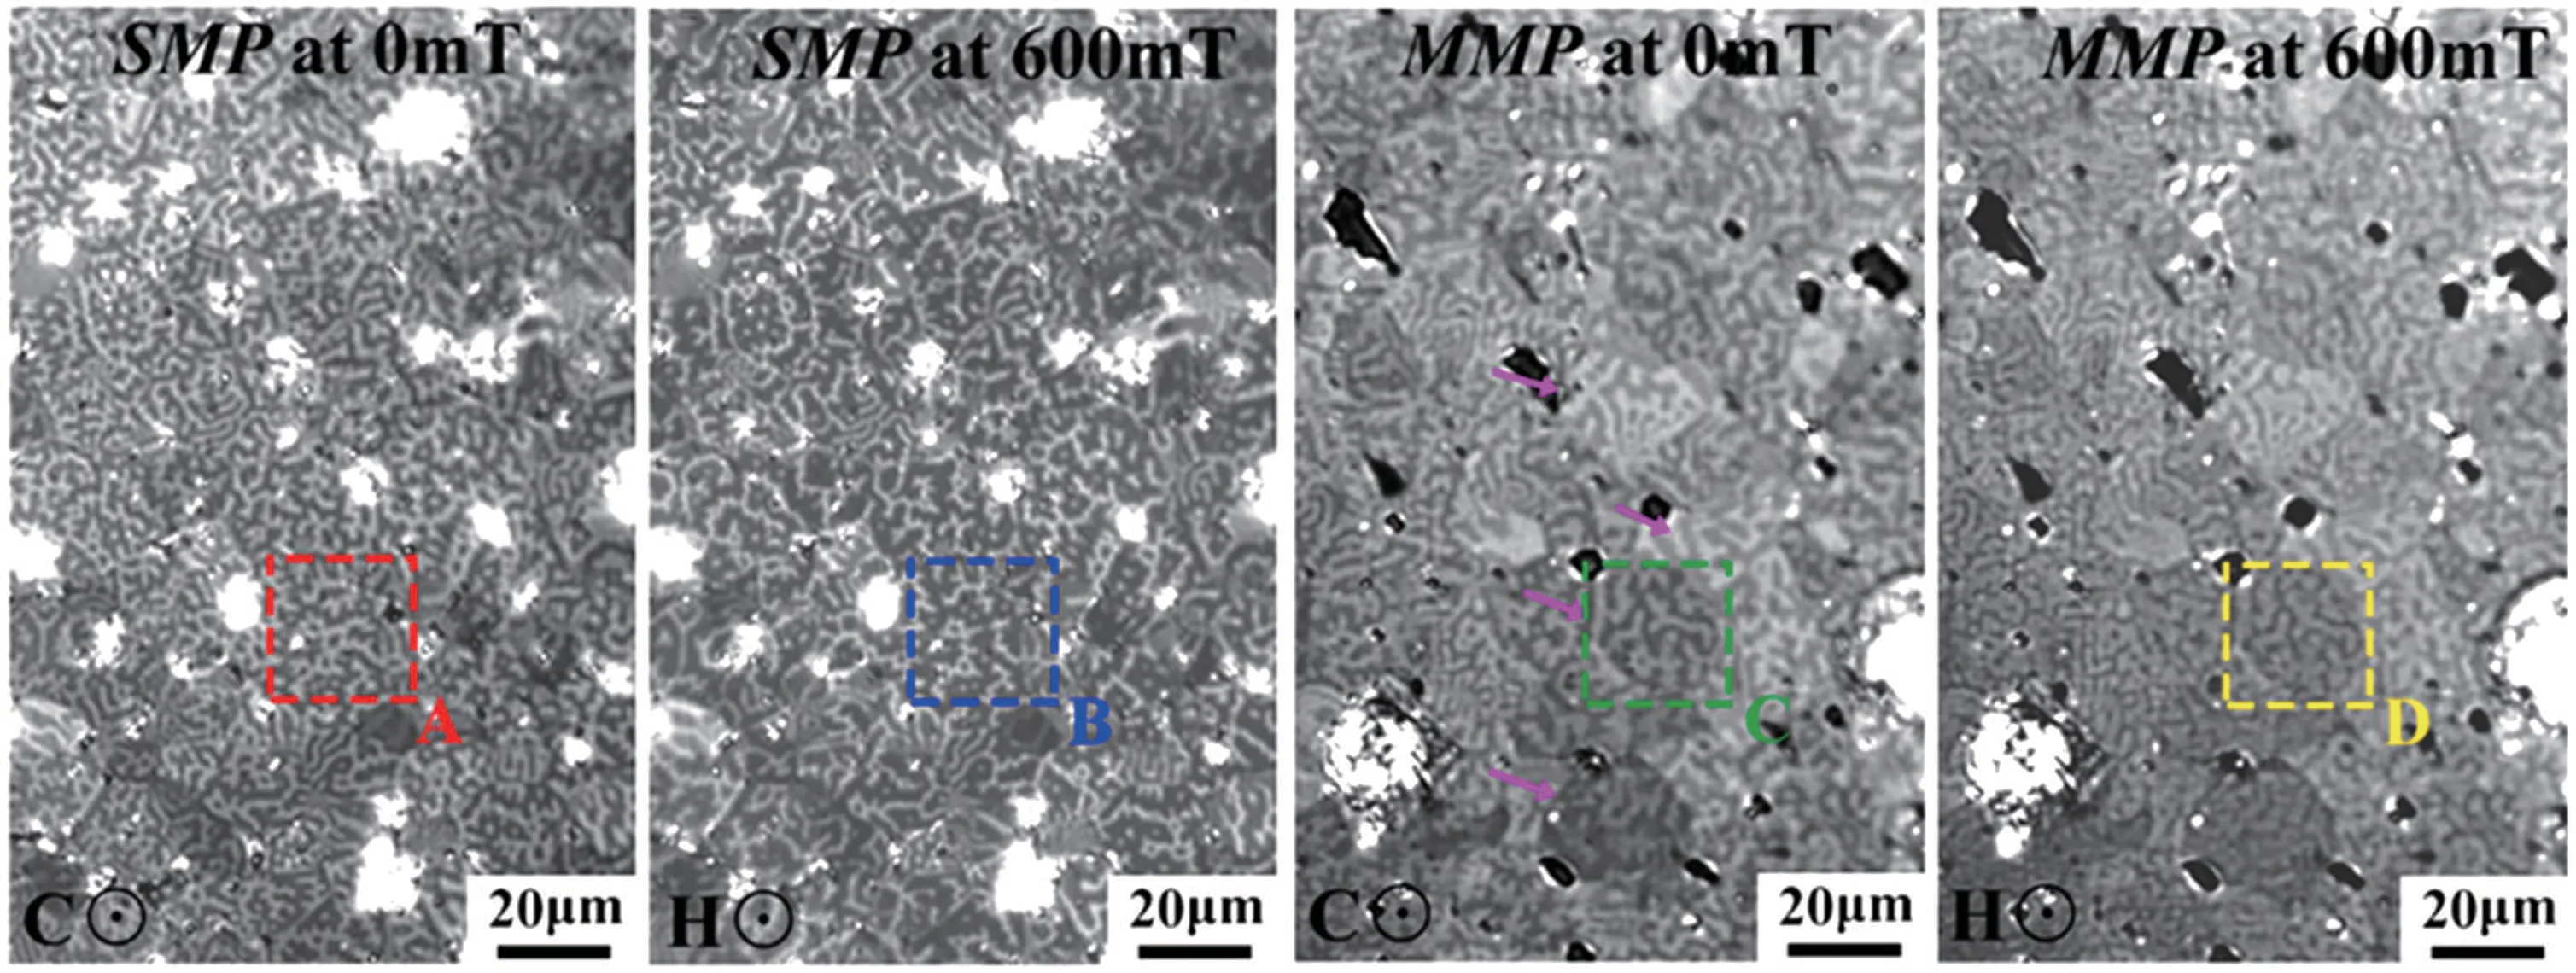
Fig.27. The c-axis out-of-plane Kerr view of SMP and MMP magnets. Magneto-optical Kerr images of thermally demagnetized(a)SMP magnet with 9 wt.%La-Ce and(c)MMP magnet with 18 wt.%La-Ce. The average domain width in the MMP magnet is almost twice the size of the SMP one. The pink arrows in(c)depict the domain clusters that joint together with ~20µm wide,and are obviously larger than the average grain size(~6.5µm),indicating a strong exchange coupling within the 2:14:1 grains and long-range magnetostatic interactions in the MMP magnets. The corresponding domain patterns under 600 mT(parallel to c-axis)are shown in(b)and(d). The intersecting domain group changes barely,suggesting a higher stability of the MMP magnet in preserving its virgin domain patterns than the SMP one. The box areas A,B,C and D are pointed out for comparisons.[22]
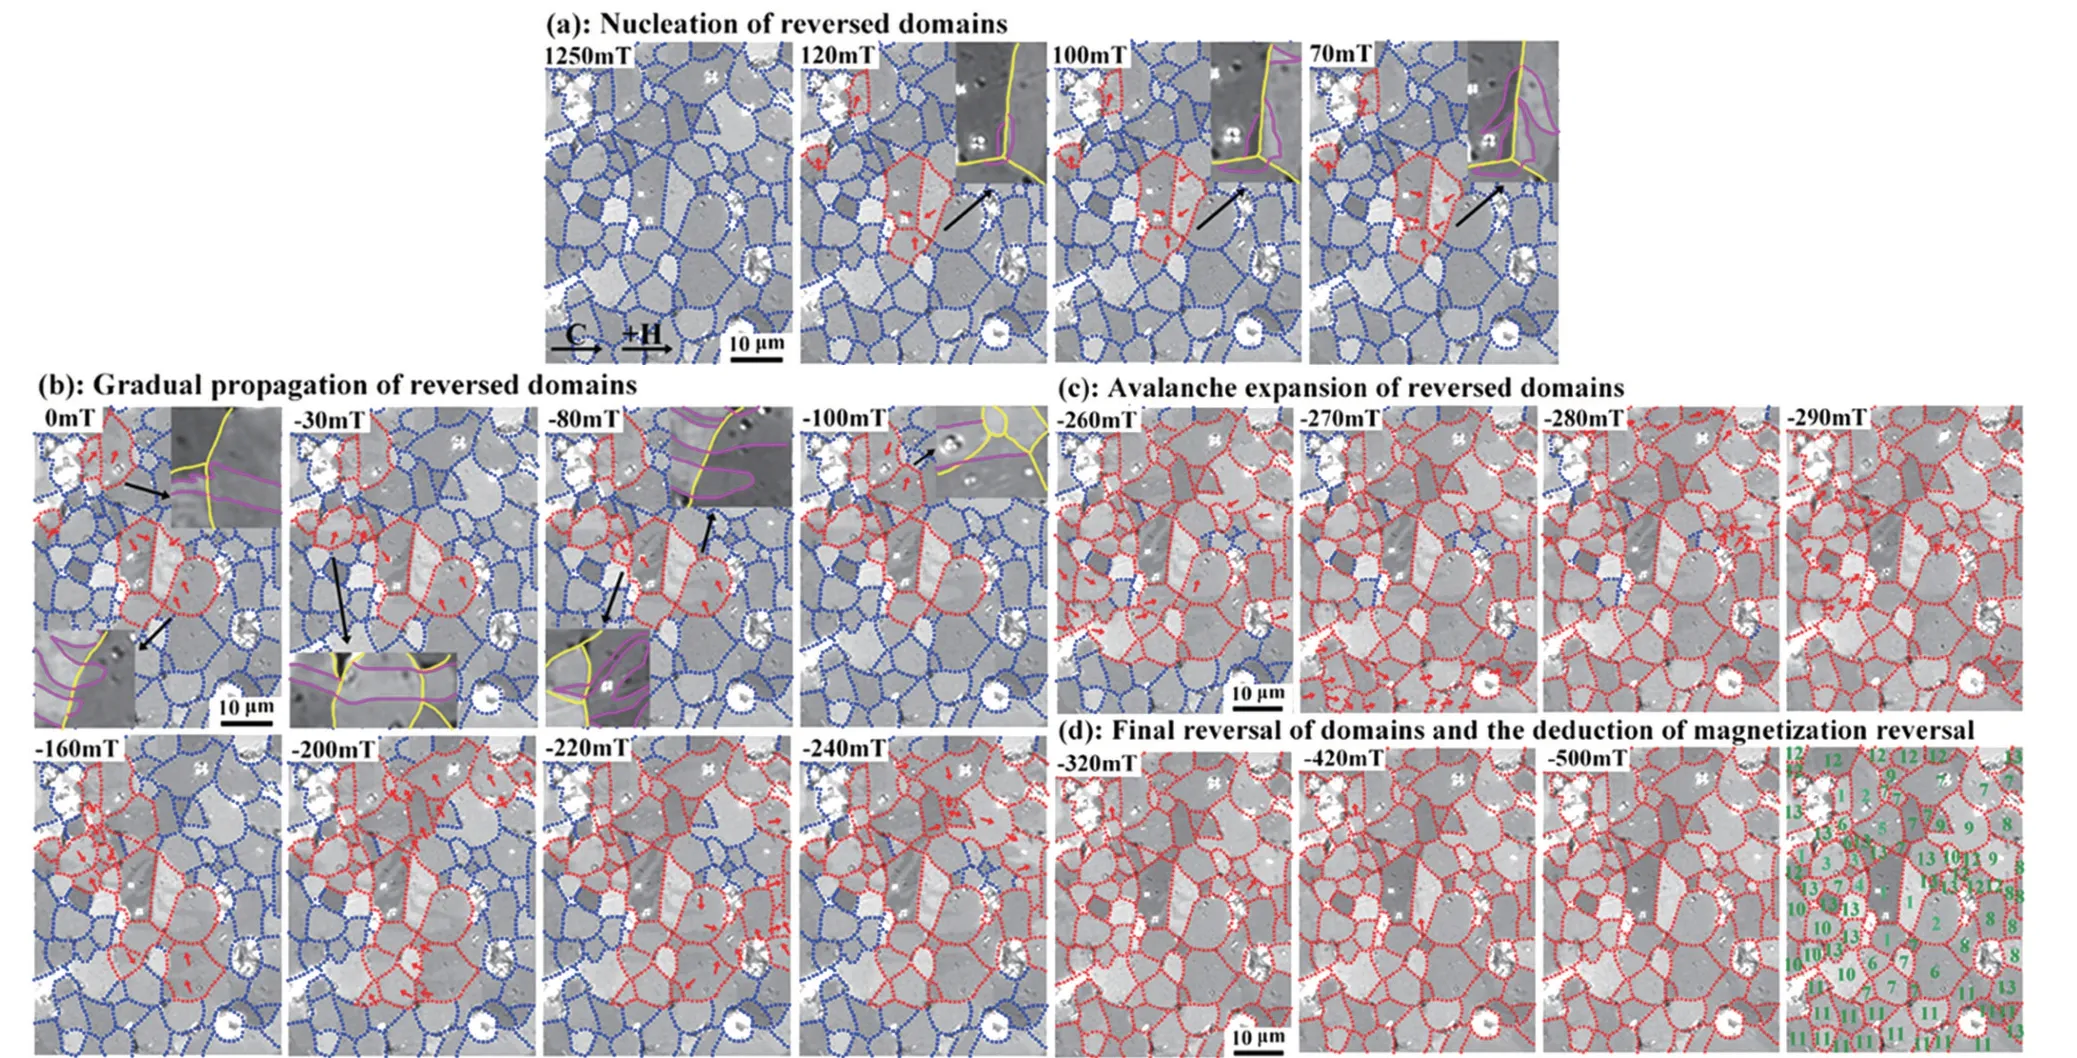
Fig.28. The in situ magnetization reversal process of the MMP magnet with 18 wt.%La-Ce,recorded by magneto-optical Kerr images. The external magnetic field is applied to the specimen along the c-axis(in-plane). Upon decreasing the external field and afterwards increasing the reversal field,the magnetization reversal can be divided into four steps: (a)nucleation of reversed domains near the GBs at 120 mT,which then grow within the grain and thus become more visible at 100 mT and 70 mT.(b)Gradual propagation of reversed domains with the increasing opposite field(~-240 mT).Small nuclei with reversal magnetization tend to grow. Once the nucleation arrives at the GBs that adjacent to another grain,the successive nucleation in the neighboring grain starts. (c) Avalanche expansion of reversed domains. The domain structure is stable below -240 mT, at higher reversal fields, the nucleation and propagation of reversed domains occur abruptly along the GB,leading to a magnetization cascade. (d)Final reversal of domains,and the corresponding map with 1-13 labeled in green,referring to the sequence of reversed domains deduced from the whole reversal progress. At-320 mT,all the present grains have reversed domains within. However,two obvious multi-domain grains remain without being totally reversed until-500 mT(exactly labeled as“1”grains,meaning that they firstly embed with the reversed nucleation and finally occupy the most strong pinning force against the motion of reversed domains).[22]
3.1.7. Magnetic performance of (La, Ce, Pr, Nd)-Fe-B magnets
Room-temperature demagnetization curves in Fig. 29 show that(BH)max, Hcj, and Brfor MMP magnets are all superior to the SMP ones. Compared to the La/Ce-free starting magnet(Br=13.02 kGs,Hcj=14.4 kOe,and(BH)max=41.9 MGOe),SMP magnets suffer sharp deteriorations in magnetic performance.With 9 wt.%La-Ce,Hcjdecreases drastically by-31.9%to 9.8 kOe,accompanied with significant falls in Brto 12.65 kGs and(BH)maxto 38.3 MGOe(Table 3). In contrast,in the MMP magnet with 9 wt.%La-Ce,(BH)maxreaches 41.6 MGOe,and Hcjis 14.0 kOe,which are 8.6%and 42.9%higher than those of the SMP magnet, respectively. Further increasing La-Ce content to 18 wt.%,the magnetic properties of the MMP magnet are even superior to those of the SMP one with only 9 wt.% La-Ce. Such superiority can be observed over a quite wide composition window (inset of Fig. 29). More importantly,the chemical heterogeneity does not produce obvious kinks or steps in the demagnetization curves, whose shapes are fairly identical to the commercial-grade Nd-Fe-B magnets. The high squareness factor[83](>95%) is a persuasive indicator for the existence of intergrain interactions in these MMP magnets. When measuring the magnetic performance up to elevated temperatures, the MMP magnets also exhibit better thermal stabilities than the SMP ones(Fig.30).
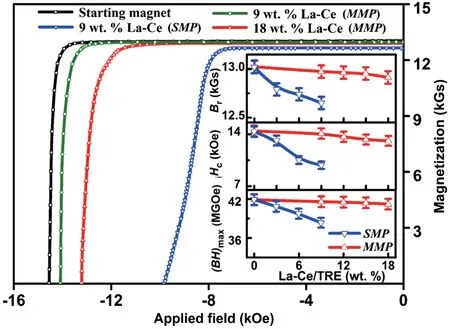
Fig.29. Magnetic performance of MMP magnets compared to the SMP ones. The inset shows the dependence of magnetic properties on La-Ce content.[22]
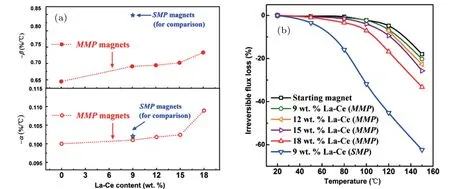
Fig.30. Thermal stability of SMP and MMP magnets. (a)Temperature coefficients of remanence α and coercivity β (from 20 °C to 100 °C).(b)Dependence of irreversible flux loss on the temperature(from 20 °C to 150 °C)for SMP and MMP magnets.[22]
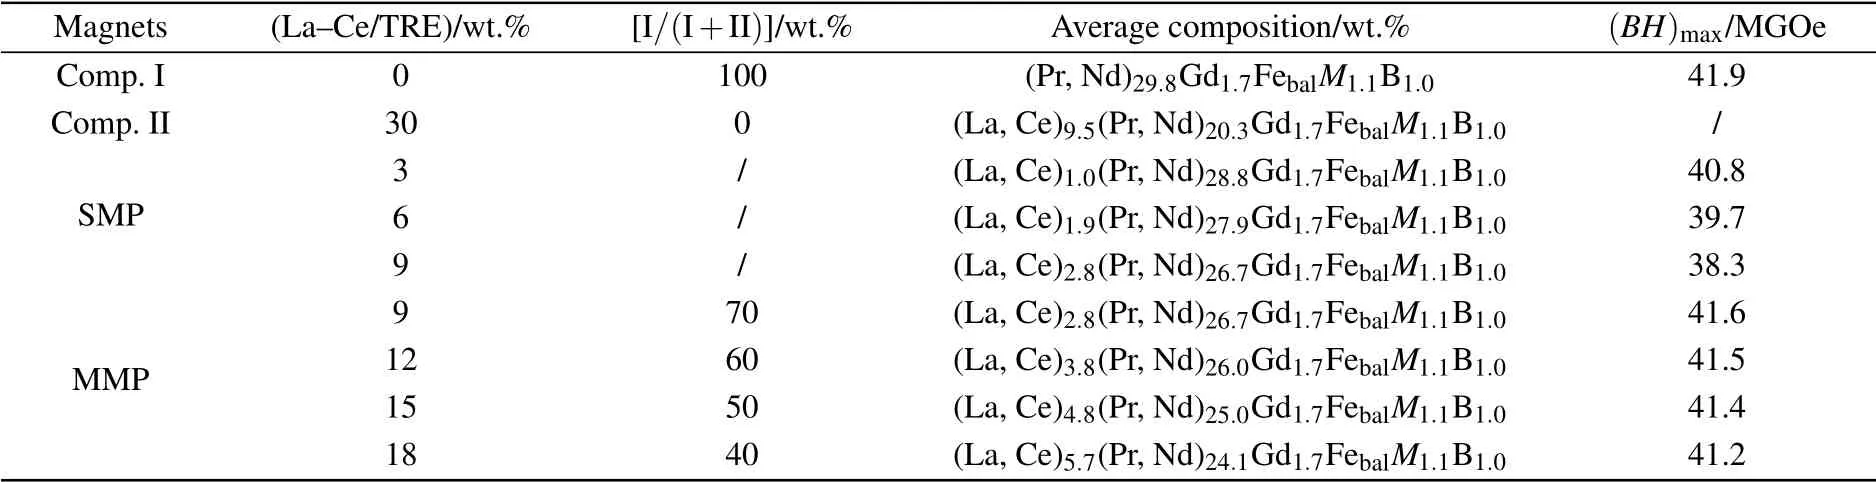
Table 3. Magnet compositions and performance. La-Ce/TRE, mass ratio of La/Ce-free component I/(I+II), average compositions, and magnetic performance. Comp. I denotes the La/Ce-free terminal,and Comp. II denotes the La/Ce-rich one.
Further magnetic measurements (Fig. 31) demonstrate the co-existence of short-range and long-range interactions in MMP magnets. The thermo-magnetic measurements (Figs. 31(a) and 31(b)) reveal different Curie temperatures (TC) between SMP and MMP magnets with the same average composition. Since TCof La2Fe14B/Ce2Fe14B (257°C/151°C) are lower than those of Nd2Fe14B/Pr2Fe14B/Gd2Fe14B(312°C/292°C/388°C),[4]the SMP magnet with 9 wt.% La-Ce exhibits a drastic decay to 293.9°C. Surprisingly, only a slight decline is observed for the MMP magnets, with TCof 300.7°C for 9 wt.% La-Ce and 299.3°C for 18 wt.%La-Ce, respectively. As TCis controlled by 3d-3d and RE-Fe exchanges,[84]and La/Ce substitution for Pr/Nd in the 2:14:1 lattice decreases the de Gennes factor, higher TCof the MMP magnets than the SMP one with the same La-Ce concentration (9 wt.% La-Ce) may reflect strengthened short-range exchange interactions against thermal perturbation in the chemically inhomogeneous MMP magnets. The possible influences of magnetic impurities such as α-Fe (TC~780°C[18]), Fe2B (TC~740°C[18]), CeFe2(TC~-38°C[16])are excluded as their Curie transitions occur at totally different temperature zones from that of the 2:14:1 phase. Moreover,XRD patterns(10°≤2θ ≤100°with a step of 0.02°and a counting time of 4 s per step using SHIMADZU XRD-6000)with Rietveld refinement confirm that the La/Cefree and La/Ce-rich terminal,SMP and MMP magnets possess the similar phase components,consisting of matrix RE2Fe14B phase and minor RE-rich phase (Figs. 32 and 33). Consequently,these impurities are not detected in both the SMP and MMP magnets.
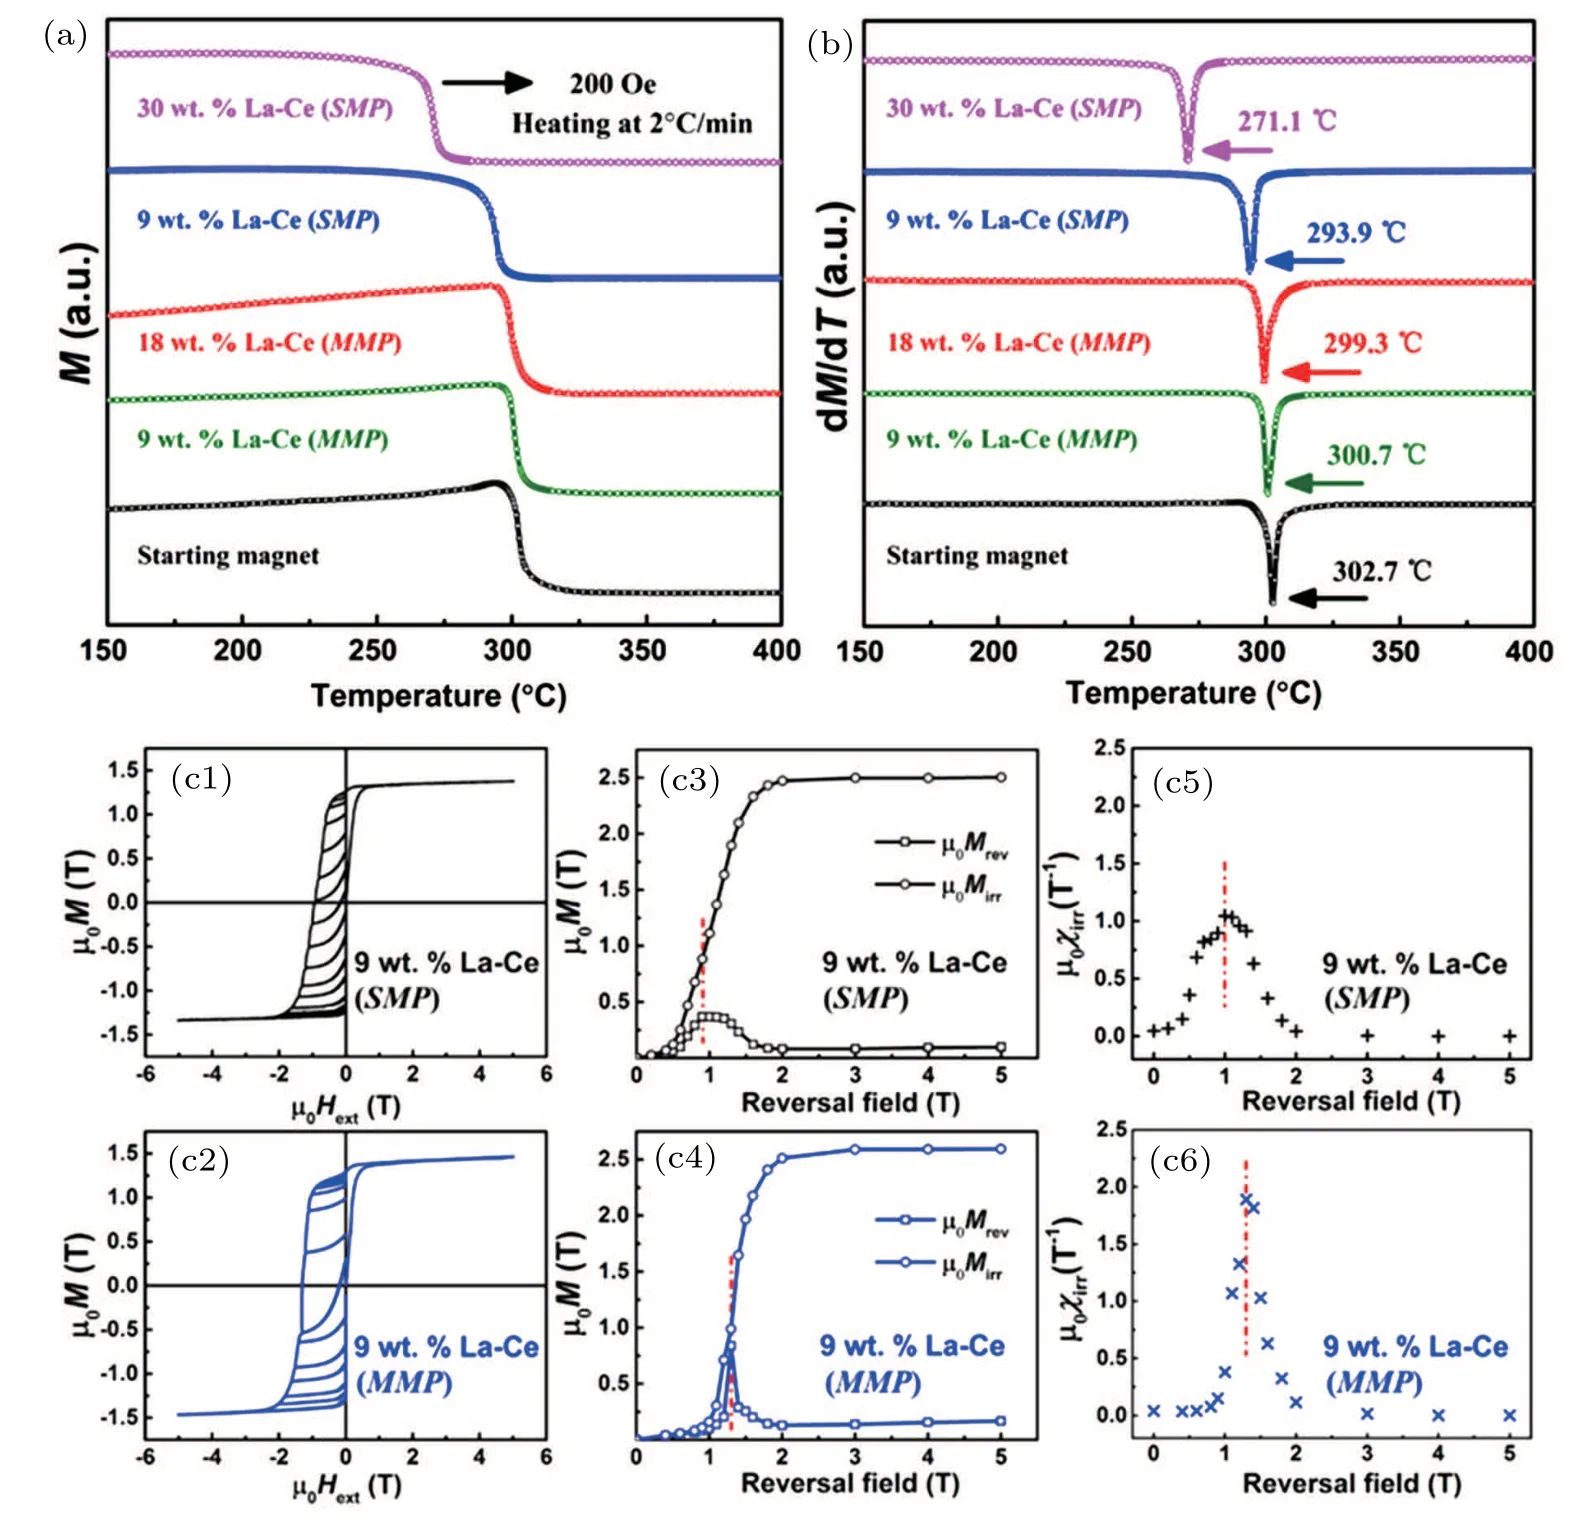
Fig.31. Short-range and long-range magnetic interactions. (a)M-T and(b) dM/dT-T curves for SMP and MMP magnets upon heating at 2 °C/min under 200 Oe. Initial magnetization curves and recoil loops on the demagnetization curve for 9 wt.% La-Ce containing (c1) SMP and (c2) MMP magnets. The corresponding dependences ofµMirr andµMrev for the SMP and MMP magnets on the applied reversal field are shown in(c3)and(c4),respectively. Calculatedµχirr as a function of reversal field for the SMP and MMP magnets are given in(c5)and(c6),respectively.[22]

Fig. 32. XRD analysis of the initial La/Ce-free and La/Ce-rich components. Rietveld refinement of step-scanned XRD patterns for(a)La/Cefree powder I and (c) La/Ce-rich powder II (La-Ce/TRE =30 wt.%) at room temperature. Experimental pattern, calculated pattern, and their differences are shown in black, red, and blue colors, respectively. The difference pattern in each curve indicates a good matching between the calculated and experimental values. The enlarged XRD patterns of 2θ between 32° and 38° are shown in(b)and(d),respectively. Bottom ticks in (e) mark the characteristic Bragg positions of the RE2Fe14B/RE-rich phase,and serve as a guide to the eye.[22]
Reversible and irreversible magnetization µMrevandµMirr, and irreversible susceptibility µχirrof the recoil loops are plotted in Fig. 31(c), following Refs. [83] and [85]. The MMP magnet possesses a much larger magnetization at 5 T than that of the SMP one at the same average composition.MaximumµMrevis as large as ~0.7 T for the MMP magnet,twice of ~0.35 T for the SMP one with the same average composition, suggesting stronger exchange-coupling within the former.[85]Nevertheless,only one peak is observed inµχirrat the nucleation field(HN)of ~1.4 T,indicating a collective magnetization reversal mechanism for the MMP magnet. It further manifests the essentially single/homogenous hard magnetic phase behavior,supporting the high squareness factor in Fig. 29. Moreover, in comparison with the SMP magnet, the switching field distribution (SFD)[83,85,86]for the MMP sample is much narrowed,suggesting a more uniform magnetization reversal behavior. Consequently,the single peak inµχirr,concentrated SFD,complemented with high squareness of demagnetization curves,unveil that the magnetostatic interaction plays a dominant role on the“uniform”magnetization reversal of the MMP magnets.
Fig.33. XRD analysis of the SMP and MMP magnets. (a)Rietveld refinement of step-scanned XRD patterns for La/Ce-containing SMP and MMP magnets (in powders) at room temperature. Experimental pattern, calculated pattern, and their differences are shown in black, red,and blue colors,respectively. The difference pattern in each curve indicates a good matching between the calculated and experimental values.The enlarged XRD patterns of 2θ between 32.8° and 35° are shown in(b). Bottom ticks in (c) mark the characteristic Bragg positions of the RE2Fe14B/RE-rich phase,and serve as a guide to the eye.[22]
The novel prototype of La/Ce-rich RE-Fe-B magnets with chemical heterogeneity either over local regions within an individual grain or across grains is completely distinct from the SMP magnet with REs homogenously distributed in the main phase,and those with singular core-shell structure.[25,87,88]Besides the peculiar chemical heterogeneity of the MMP magnet, its high magnetic performance further underscores the dependence of local intrinsic magnetic property/lattice parameter on the composition and its close ties to the extrinsic magnetic properties.[89]It is remarkable that the short-range exchange coupling and long-range magnetostatic interaction can induce higher remanence and coercivity simultaneously than those of the SMP magnets with the same average composition.
3.1.8. Mechanical properties of(La,Ce,Pr,Nd)-Fe-B magnets
In dynamic environments,such as high-speed motors and electric power steering motors, the magnets should endure substantial mechanical stress,thereby requiring a high fracture resistance.[90]Not only the magnetic performance but also the mechanical properties are highly desired for such end-product applications. For Nd-Fe-B sintered magnets,the metallic Ndrich phase has a relatively higher plasticity and ductility when compared to the intermetallic Nd2Fe14B phase, leading to a predominating intergranular fracture behavior.[91]The incorporation of La/Ce into Nd-Fe-B magnets by the MMP approach, however, may exert complex influences on the traditional intergranular fracture mechanism.[92,93]Since the La/Ce substitution for Nd in the 2:14:1 phase may change the intrinsic mechanical properties as well as the physicochemical properties(such as the melting point),microstructures as well as elemental distributions of such MMP magnets may have a distinct difference from those of the conventional Nd-Fe-B sintered magnets. Consequently, understanding the relationship between the La/Ce content,microstructure,and mechanical properties is of great significance in mass production of La/Ce-containing RE-Fe-B magnets and deserves a comprehensive investigation.
In our previous work,[93]magnetic powders with nominal compositions of(Pr,Nd)29.8Gd1.7FebalM1.1B1.0(I:La/Ce-free)and (Pr, Nd)14.1(La, Ce)15.7Gd1.7FebalM1.1B1.0(II: La/Cecontaining) (M = Cu, Al, Nb, Zr, in wt.%) were blended at different mass ratios (see Table 4) to prepare MMP magnets with 0, 9 wt.%, 18 wt.%, 27 wt.%, and 36 wt.% La-Ce/TRE via powder metallurgy process.
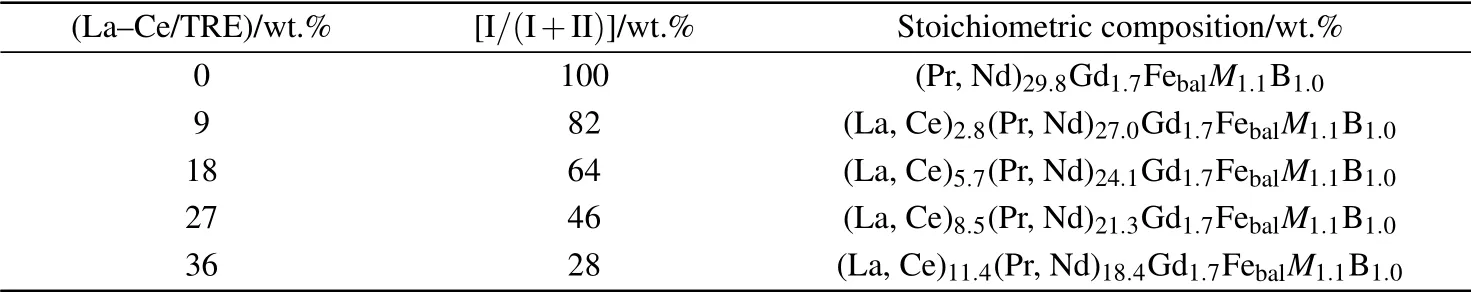
Table 4. La-Ce content of total rare earth (La-Ce/TRE), mass ratio of I/(I+II), and stoichiometric composition of the MMP magnets.[93]
Compared to the La/Ce-free starting magnet with Br=13.0 kGs, Hcj=14.4 kOe, and (BH)max=41.9 MGOe, the MMP magnet with 18 wt.% La-Ce possesses fairly good magnetic performance with Br=12.7 kGs, Hcj=12.2 kOe,and(BH)max=39.7 MGOe, which are comparable to the 40 MGOe commercial grade magnets. Dependences of the mechanical properties on the La-Ce content are shown in Fig.34.It reveals that with increasing La-Ce content, both the compressive strength σbcand bending strength σbbfirstly increase,and reach a maximum,and then exhibit a decreasing trend,as shown in Figs.34(a)and 34(b).The maximum σbcand σbbare 1137.8 MPa and 339.9 MPa,respectively,which are obtained at the turning point of 18 wt.% La-Ce concentration. However, both σbcand σbbdeteriorate drastically to 698.2 MPa and 189.7 MPa for the magnet with 36 wt.%La-Ce,which are even lower than those of the La/Ce-free starting magnet. Consequently, a proper La-Ce content can exert positive effects on the compressive and bending strengths of the MMP magnets. However, in terms of the micro-hardness of 2:14:1 matrix phase as shown in Fig.34(c),it is improved considerably along with increasing La-Ce content. A high value of 615.0 HV can be obtained for the MMP magnets with 36 wt.%La-Ce. Simultaneously, the Young’s modulus measured by the nanoindenter is also enhanced monotonously from 88.0 GPa to 136.0 GPa with La-Ce content increasing from 9 wt.% to 36 wt.%(Fig.34(d)). It should be stressed that both tests are conducted at the local regions within the micro-sized matrix phase grains. Hence, enhancements in both micro-hardness and Young’s modulus of the matrix phase can accord well with the improved compressive and bending strengths before the turning point of 18 wt.%La-Ce. The decrease of σbcand σbbwhen the La-Ce content is above 18 wt.%,however,no longer follows the enhanced hardness and modulus.
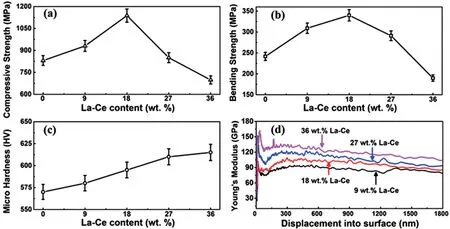
Fig. 34. The variation of mechanical properties as a function of La-Ce content. (a) Compressive strength σbc, (b) bending strength σbb, (c)micro hardness,and(d)Young’s Modulus.[93]
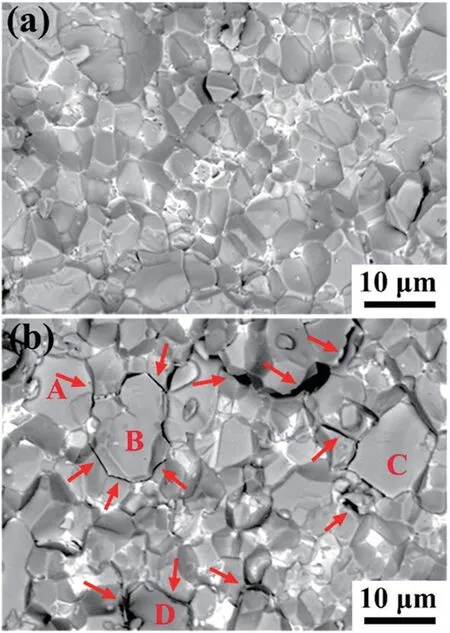
Fig.35. Back-scattered SEM images of fractured surface for the MMP magnets with(a)18 wt.%La-Ce and(b)36 wt.%La-Ce after the threepoint bending test.[93]
As is known that the mechanical properties of Nd-Fe-B magnets are highly dependent on the microstructure, such as the grains size and RE-rich phase distribution, microstructure characterizations are then carried out to unveil the related mechanisms, focusing on the La-Ce concentrations above 18 wt.%,which is the turning point in the variations of bending and compressive strengths. The back-scattered SEM images in Fig. 35 show the typical micro-fractographs of the bending specimens with 18 wt.% and 36 wt.% La-Ce. It is observed that in both samples, the fracture micromechanism is mainly intergranular fracture, following the typical brittle fracture mode in previously reported work.[91]It indicates that the La-Ce addition does not change the brittle nature of the RE-Fe-B magnets.
At 18 wt.%La-Ce concentration(Fig.35(a)),the RE-rich phase distributes continuously and uniformly surrounding the 2:14:1 matrix phase grains. While in the MMP magnet with 36 wt.%La-Ce(Fig.36(b)),the grain size,distributed ranging from 3µm to 10µm,is rather nonuniform. There exist 2:14:1 matrix phase grains as large as ~10µm(pointed out by A,B,C,and D),indicating that the amounts of large grains increase when raising La-Ce content. It demonstrates that the La/Cerich 2:14:1 phase possesses a much lower melting point than the La/Ce-free one, and thus coarsens easier during sintering and following annealing processes. Hence the irregular grain growth in the MMP magnets with 36 wt.%La-Ce is ascribed to a high fraction of the La/Ce-rich component.
Apart from the RE2Fe14B grains, the RE-rich phase at GBs also plays a key role in determining the mechanical properties. It is noteworthy that at a high La-Ce concentration(Fig.35(b)),quite a large fraction of micro cracks are visible as depicted by the red arrows,indicating a low resistance to crack propagation. Here, the thickness of the intergranular RE-rich phase is smaller than that of the magnets with 18 wt.%La-Ce.As the RE-rich phase around GB has been reported to absorb more energy than the 2:14:1 matrix phase, the thick RE-rich phase can act as a path for the intergranular fracture and effectively prevent the crack propagation. In the case of 36 wt.%La/Ce-containing MMP magnets,however,the disturbance in the uniformity and thickness of intergranular RE-rich phase has substantially deteriorated the crack-propagating resistance of the GB phase.Consequently,a comparison between the two samples indicates that the irregular grain growth together with the deteriorated grain boundary phase are the main reasons for the drastically decreased bending and compressive strengths.
Additionally,transgranular cleavage can also be partially found in the fractograph of specimens. Given that the green compacts of MMP magnets consist of La/Ce-free and La/Cerich components, inhomogeneous La/Ce distribution among 2:14:1 matrix phase grains still exists even after the sintering and annealing. La/Ce-rich and La/Ce-lean RE2Fe14B grains coexist in the final magnets. To uncover the relationship between the phase components and transgranular fracture,EPMA is employed as shown in Fig.36. It is found that transgranular cleavage mainly occurs in grains which are rich in Nd(Fig.36(b))while basically lean of Ce(Fig.36(c))and La(Fig. 36(d)) as depicted by the pink arrows. It suggests that the La/Ce-lean 2:14:1 grains exhibit a lower strength than the La/Ce-rich ones, thereby becoming the path of transgranular cleavage. It is in good accordance with the aforementioned results that the La-Ce addition can enhance both the hardness and modulus of 2:14:1 matrix phase in the RE-Fe-B sintered magnets.
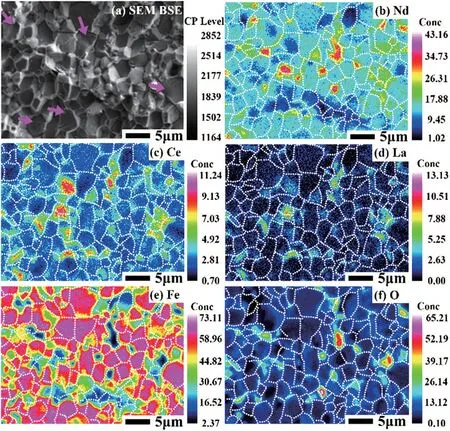
Fig.36. (a)Typical fractograph and EPMA mappings of(b)Nd,(c)Ce,(d)La,(e)Fe,and(f)O for the MMP magnet with 9 wt.%La-Ce.[93]
In our work,a promising solution to the tightening global REs criticality is unveiled by preparing high-performance RE2Fe14B magnets with high La-Ce concentration. The hallmark lies in the chemical heterogeneity within/across the magnetically hard 2:14:1 phase grains,making it one crucial topic from both the fundamental and application points of view.Theoretically,it offers a rich field for studying the interplay between chemical heterogeneity,interactions at different scales,and extrinsic magnetic properties in hard magnetic materials.Technologically, since most procedures remain the same as those in the conventional approach,the construction of chemical heterogeneity is promising for manufacturing La-Ce containing RE2Fe14B PMs in mass production,which may greatly promote the sustainability,balance,and diversity of global RE industry.
3.2. Y-Ce co-substitution for Nd
In comparison with La,whose 2:14:1 tetragonal structure is unstable, Ce can fully substitute for Nd in the Nd2Fe14B phase and is more appealing to develop low-cost RE-Fe-B magnets. However, it is noted that Ce2Fe14B has the lowest Curie temperature(TC=424 K)among all the RE2Fe14B compounds.[4]Consequently, the sintered magnets with Ce substitution exhibit poor thermal stability.How to improve the thermal stability of Nd-Ce-Fe-B sintered magnets becomes a bottleneck concern for the high-temperature applications,such as wind turbines and hybrid vehicles. One of the common approaches to improve the thermal stability of Nd-Fe-B magnets is to enhance the Curie temperature. Previous investigations on Nd-Ce-Fe-B magnets show that TCcan be increased by partial Co substitution for Fe at the sacrifice of remanence and coercivity.[5]Alternatively, the thermal stability can also be improved in high-coercivity magnets via incorporating heavy rare earth(HRE)elements Dy/Tb.However,the remanence reduction and the material cost increment become inevitable. In addition to TCand the increased coercivity,in fact,the temperature dependence of the magnetocrystalline anisotropy field and the magnetization is also essential because it determines how fast the intrinsic ferromagnetism decreases upon heating.Note that Y2Fe14B has an equivalent HAto Ce2Fe14B, but a much larger JS(1.41 T) at room temperature and higher TC(565 K).[4]Most importantly,Y2Fe14B has a positive temperature coefficient of anisotropy field over a wide temperature range,[72]which suggests that Y is a potential candidate for enhancing the thermal stability of the Nd-Ce-Fe-B magnets.In our work, Y was incorporated to improve the thermal stability of the(Nd,Ce)-Fe-B sintered magnets.[94,95]
Magnetic powders with nominal compositions of (Pr,Nd)30.5FebalM1.3B1.0(Pr-Nd alloy consists of 20 wt.%Pr and 80 wt.% Nd, M = Cu, Al, Ga, Zr, Co,in wt.%), (Pr, Nd)15.25Ce15.25FebalM1.3B1.0, and (Pr,Nd)15.25(Y35Ce65)15.25FebalM1.3B1.0were prepared by induction melting, SC, HD, and JM. By tuning the mass ratios of the Y-free and Y-containing powders, magnets with 6 wt.%,9 wt.%,and 12 wt.%Y-Ce content of TRE(the corresponding Y content is 2.1 wt.%,3.15 wt.%,and 4.2 wt.%,respectively)were prepared via the powder metallurgy route. The starting magnet (Y-Ce free) and the magnet with 9 wt.% Ce content were also prepared under the same condition for comparison.After pressing under 5.5 MPa in a perpendicular magnetic field of 15 kOe and isostatic compressing under 200 MPa,the green compacts were sintered at 1273-1348 K and subsequently annealed at 1143-1173 K and 733-893 K,respectively.
3.2.1. Room-temperature magnetic properties of (Y,Ce, Pr, Nd)-Fe-B magnets
Figure 37 shows the room-temperature demagnetization curves for the starting magnet, the magnets with 6 wt.%,9 wt.%,and 12 wt.%Y-Ce,and 9 wt.%Ce substitution. The starting magnet possesses the coercivity Hcjof 14.9 kOe, the remanence Brof 13.9 kG, and the maximum energy product(BH)maxof 47.6 MGOe. Although the magnetic performance decreases gradually with the increasing Y-Ce substitution,the magnet with 12 wt.%Y-Ce(4.2 wt.%Y)still exhibits preferable magnetic performance (Hcj=11.1 kOe, Br=13.5 kG,and (BH)max=43.9 MGOe). In comparison with the single Ce subsisted magnet,the Y and Ce co-substituted magnet possesses comparable room temperature magnetic properties with Hcj=11.8 kOe,Br=13.7 kG,and(BH)max=45.6 MGOe at the same substituting level of 9 wt.%.
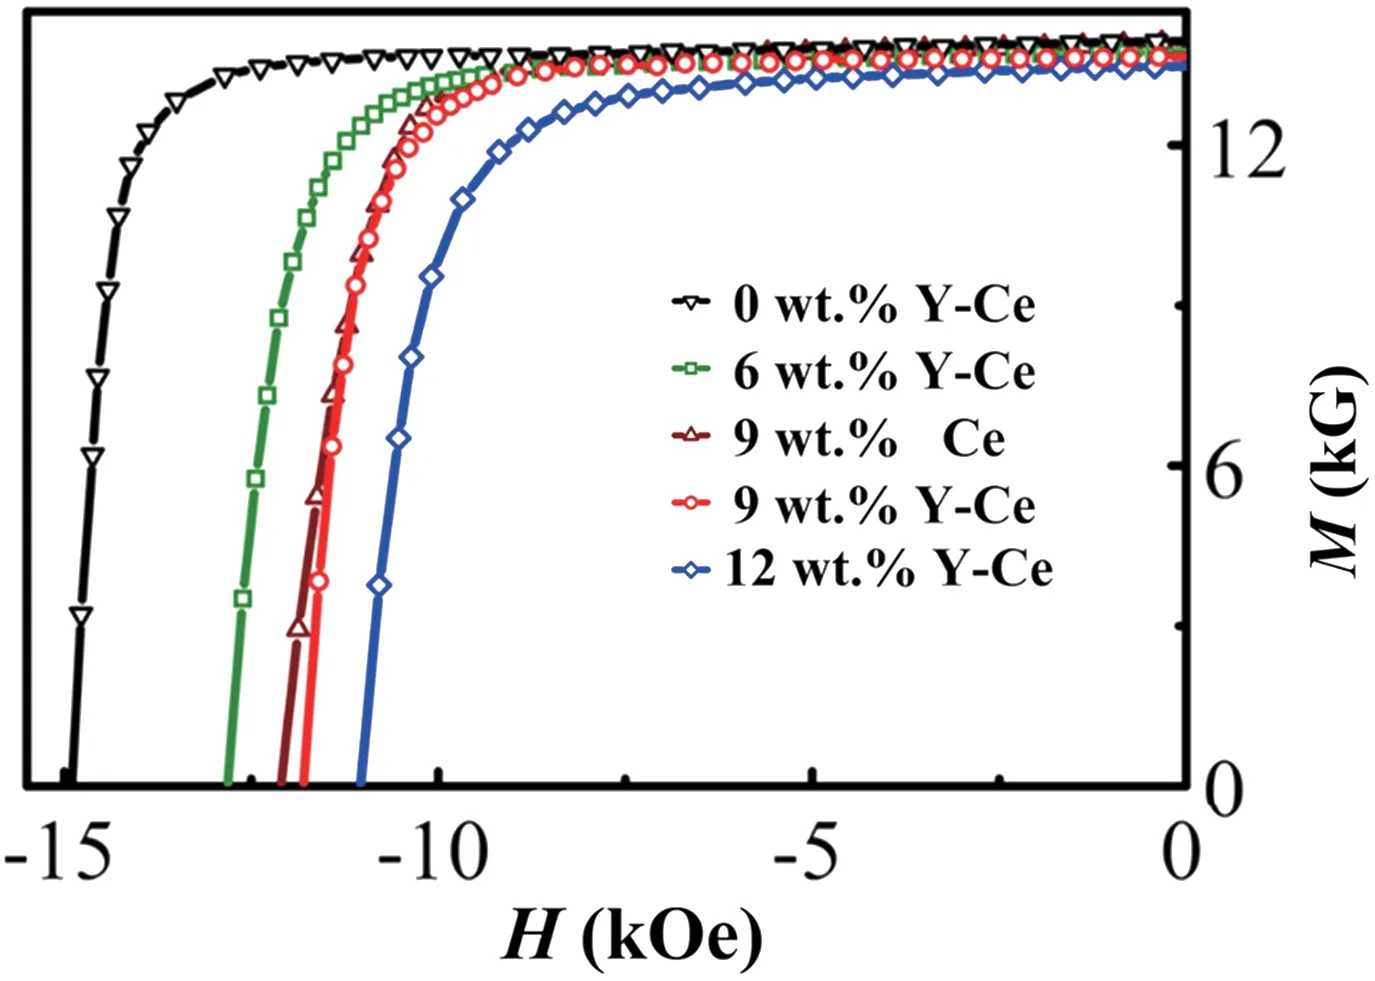
Fig. 37. Room-temperature demagnetization curves for the starting magnet, the magnets with 6 wt.%, 9 wt.%, and 12 wt.% Y-Ce and 9 wt.%Ce substitution.[95]
3.2.2. Thermal stability of(Y,Ce,Pr,Nd)-Fe-B magnets
Further measurements at elevated temperatures show that the magnets with Y-Ce co-substitution have much better thermal stability than the one with single Ce substitution. Temperature coefficients of remanence (α) and coercivity (β) were evaluated by the in situ heating demagnetization curves over the temperature range from 293 K to 393 K.Typical curves for the magnet with 9 wt.%Y-Ce and the one with 9 wt.%Ce are illustrated in Figs.38(a)and 38(b),respectively. It is clear that the magnetic performance of these magnets decreases with increasing temperature due to the thermal demagnetization effect. However, the magnet with 9 wt.% Y-Ce still has Hcjof 4.8 kOe and Brof 12.2 kG at 393 K,both of which are larger than those of the magnet with 9 wt.%Ce(Hcj=3.5 kOe and Br=12.0 kG at 393 K).
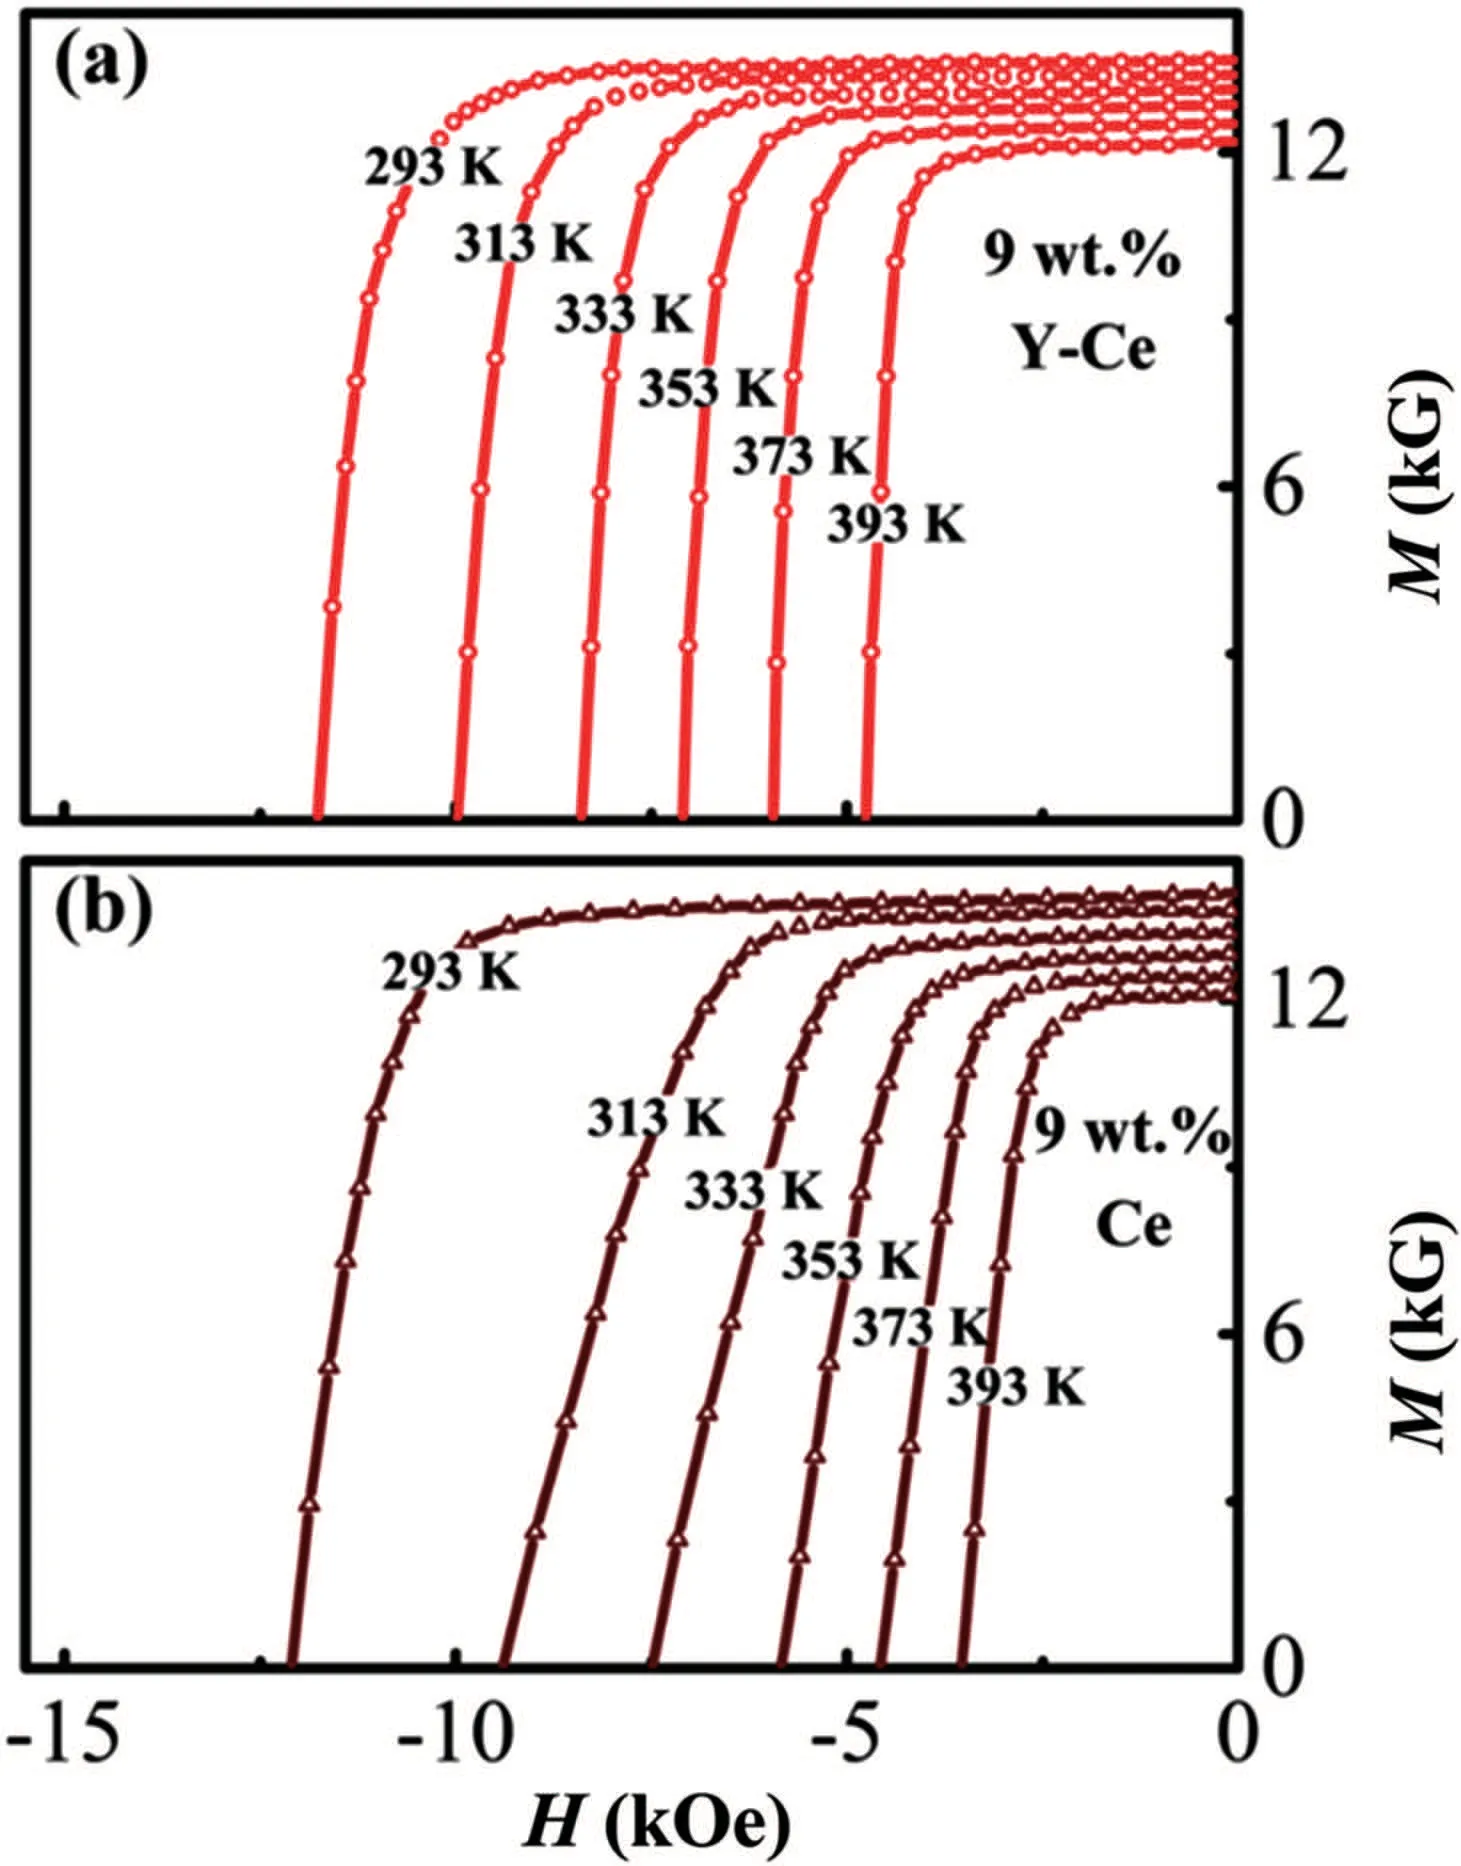
Fig.38. Demagnetization curves at selected temperatures upon in situ heating for (a) the magnet with 9 wt.% Y-Ce substitution and (b) the magnet with 9 wt.%Ce substitution for Nd.[95]
A comparison of the temperature coefficients α and β among all the studied magnets is illustrated in Fig.39(a). The|β| over the temperature intervals 293-333 K, 293-353 K,293-373 K, and 293-393 K for each magnet is calculated using |β|=|ΔHcj/HcjΔT|×100%. In comparison with the starting magnet(black curve),9 wt.%Ce doping enlarges the|β| value obviously, suggesting that the Nd-Ce-Fe-B magnet has poorer thermal stability than the Nd-Fe-B one. On the contrary,Y-Ce co-substitution lowers the|β|value effectively. For example,the magnet with 9 wt.%Y-Ce has a|β|of 0.59 %/K within the temperature interval 293-393 K, which is 6.3%and 16.2%lower than that for the starting magnet and the Nd-Ce-Fe-B magnet at the same substitution level for Nd(9 wt.%), respectively. As shown in the inset of Fig. 39(a),|α|(|α|=|ΔBr/BrΔT|×100%)keeps basically unchanged at about 0.11%/K as the Y-Ce content increases up to 12 wt.%when compared with the starting magnet.In addition,it is also lower than the value of 0.13%/K for the magnet with 9 wt.%Ce. Consequently, the Y-Ce co-substituted magnets exhibit much superior thermal stability in both Hcjand Brthan the one with single Ce substitution.
Figure 39(b) illustrates the normalized magnetization(M/M293K)as a function of temperature in 10 kOe magnetic field. M293Krepresents the magnetization measured at 293 K.The corresponding Curie temperature TC, at which the absolute dM/dT reaches a maximum, is shown in the inset. Although TCdecreases upon Ce or Y-Ce substitution for Nd,the magnet with 9 wt.% Y-Ce co-substitution has a higher TC(579.5 K) than that of the magnet with single Ce substitution (572.3 K) because TCof Y2Fe14B is higher than that of Ce2Fe14B.[3]The change of TCalso indicates that Y and Ce substitute Nd/Pr in the 2:14:1 phase lattice. Most importantly, the temperature dependence of the magnetization has distinct difference between Y-Ce co-substituted and Ce substituted magnets at 9 wt.%substitution. It is clear that the magnet with 9 wt.% Ce shows much rapid magnetization reduction upon heating than the starting magnet, which is another important reason for the degraded thermal stability. Although the magnet with Y-Ce co-substitution also has lower TCthan the starting magnet, its magnetization deteriorates at a much slower rate upon heating. It is the intrinsic origin for the improved thermal stability of the Y-Ce co-substituted magnets.
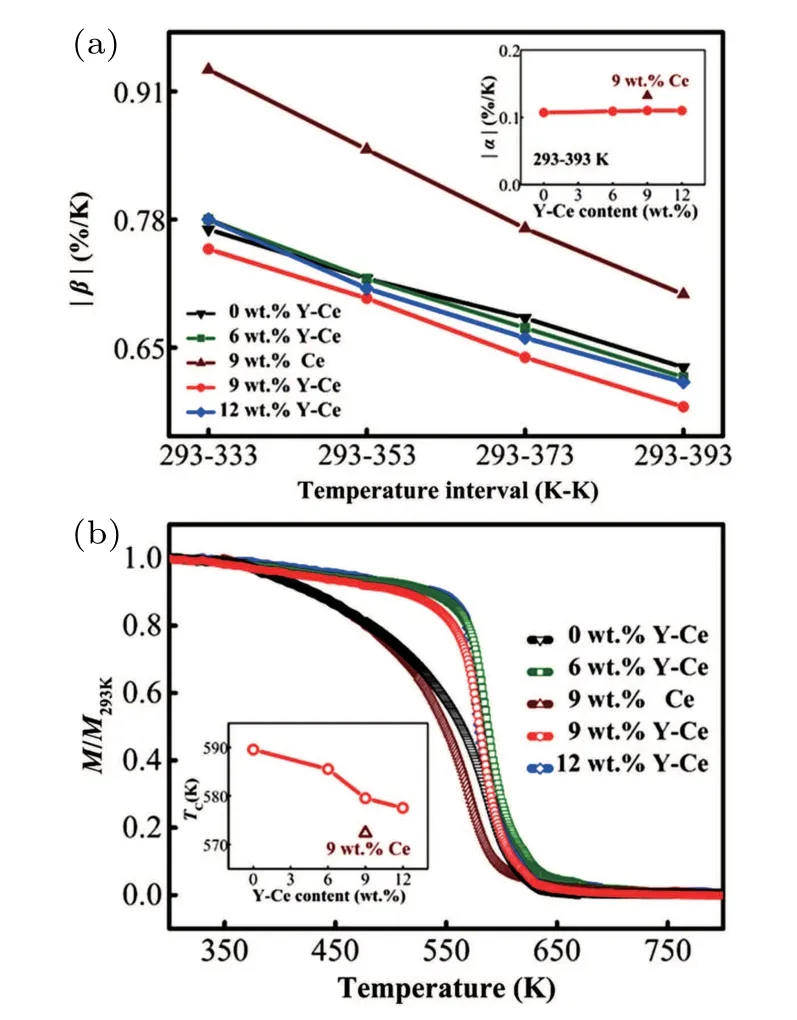
Fig. 39. (a) The absolute values of temperature coefficients of coercivity for the starting magnet, the magnets with 6 wt.%, 9 wt.%, and 12 wt.%Y-Ce and 9 wt.%Ce substitution in different temperature intervals. The inset shows the absolute values of temperature coefficients of remanence within the temperature interval from 293 K to 393 K for the corresponding magnets. (b)Normalized magnetization measured as a function of temperature in 10 kOe. M293 K represents the magnetization measured at 293 K.Curie temperatures are shown in the inset.[95]
3.2.3. Microstructure of (Y, Ce, Pr, Nd)-Fe-B magnets
Microstructure observation in Fig. 40 reveals the inhomogeneous elemental distribution within the main phases. In Fig.40(a),the core region is darker in some grains,whereas is brighter in others,forming two types of core-shell morphologies. Combined with EPMA results in Figs.40(b)-40(d), the darker core is rich in Y and poor in Nd,while the brighter one is poor in Y and rich in Nd. Unlike Ce,which is easy to aggregate in the triple junctions, the Y element mainly distributes in the main phases. This is in agreement with a recent firstprinciples study, which indicates that Y prefers to enter the 2:14:1 phase and may exert a beneficial effect on the stability of the 2:14:1 phase.[96]
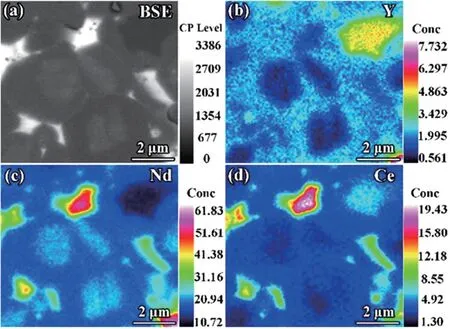
Fig.40. (a)BSE-SEM micrograph and corresponding elemental mappings of (b) Y, (c) Nd, and (d) Ce for the magnet with 9 wt.% Y-Ce substitution.[95]
The above results indicate that Y plays a positive role on improving the thermal stability of the RE-Fe-B permanent magnets, which may bring important consequences. In comparison with Nd,Pr,Dy,and Tb,both Ce and Y are less-risky REs. By partial Y substitution for Ce, the temperature coefficient of the coercivity can be reduced by 16.2%. To further evaluate the thermal stability of Y-Ce co-substituted magnets,a commercial magnet with comparable magnetic performance of(BH)max=44.0 MGOe,Br=13.4 kG,and Hcj=11.0 kOe was introduced. The temperature coefficients|α|and|β|over the temperature interval from 293 K to 393 K are 0.12%/K and 0.68%/K,8%and 15.2%higher than those of the magnet with 9 wt.%Y-Ce,respectively. The commercial magnet contains about 24 wt.%Nd,5.8 wt.%Pr,and 1.7 wt.%Gd,determined by inductively coupled plasma(ICP)analysis. The cost of RE elements in this commercial magnet is ~$15.5/kg(as of October 2016). The cost of RE elements in our 9 wt.% Y and Ce co-substituted magnet is just ~$14.3/kg,8.4%lower than this commercial magnet. Consequently, the present (Nd, Y,Ce)-Fe-B magnet has much lower material cost and superior thermal stability than the commercial magnet.
3.3. Effects of REFe2 on microstructure and magnetic properties of(Nd,Ce)-Fe-B sintered magnets
High Ce substitution may result in the formation of additional phases,whose contents and distributions strongly affect the macroscopic magnetic properties,especially the coercivity.Early work by Herbst et al.[97]has shown that the melt-spun Ce17Fe78B6alloy contains up to 12 wt.% CeFe2in addition to the Ce2Fe14B matrix phase. Other studies have also shown that REFe2phase forms when the Ce content in Nd-Ce-Fe-B exceeds the critical values.[16,98-100]Consequently, it has been considered that the REFe2phase inevitably forms in the Nd-Ce-Fe-B component with high Ce content. Its existence has been thought to be harmful to the magnetic performance due to its lower intrinsic magnetic parameters than the 2:14:1 phase. CeFe2is paramagnetic at room temperature and magnetically soft even below its TC.[101]Considering that CeFe2has a lower melting point(925°C)than the sintering temperature for 2:14:1 magnets,it is inspiring to understand how the REFe2phase affects the liquid-phase sintering process and the microstructure of the magnets. In this work, a Ce-free component and a Ce-containing component(Ce in the total RE is 50 wt.%)that contains REFe2phase are designed to fabricate the MMP magnets. The distribution of REFe2phase and its influences on both microstructure and magnetic properties of the magnets have been investigated.
A Ce-containing component [(Pr, Nd)0.5Ce0.5]30.5FebalM1.0B1.0, M = Al, Cu, Ga, Zr, in wt.%) (hereafter named as Ce-50)and a Ce-free component(Pr, Nd)30.5FebalM1.0B1.0(hereafter named as Ce-0) have been designed. Each component was subjected to induction melting, SC, HD, and JM. The mean particle size of the final powders is 3.0-3.5 µm. After blending the powders of Ce-50 and Ce-0 with the mass ratios of 54:46, 72:28, and 90:10, green compacts with the nominal compositions of[(Pr,Nd)0.73Ce0.27]30.5FebalM1.0B1.0, [(Pr, Nd)0.64Ce0.36]30.5FebalM1.0B1.0, and [(Pr,Nd)0.55Ce0.45]30.5FebalM1.0B1.0(hereafter named as Ce-27,Ce-36, and Ce-45, respectively) were obtained under a compressive pressure of 5.5 MPa in a perpendicular magnetic field of 1.5 T followed by isostatic pressing under ~200 MPa.Final magnets were prepared by sintering at 1030°C for 4 h, followed by a two-step annealing treatment at 890-920°C for 2 h and 460-520°C for 4.5 h. For comparison,Ce-27 SMP magnets with the nominal composition of [(Pr,Nd)0.73Ce0.27]30.5FebalM1.0B1.0were also prepared using the same procedures.
3.3.1. Magnetic properties of(Nd, Ce)-Fe-B magnets
Figure 41 shows the room temperature demagnetization curves of the Ce-0, Ce-27 SMP, Ce-27 MMP, Ce-36 MMP,and Ce-45 MMP magnets. Compared to the Ce-free (Ce-0)magnet with Hcjof 13.8 kOe, Brof 14.1 kG,and(BH)maxof 48.7 MGOe,the magnetic properties of the Ce-27 SMP magnet deteriorate drastically to Hcjof 10.4 kOe, Brof 12.8 kG,and (BH)maxof 39.0 MGOe. It is due to the magnetic dilution effect that Ce substituting for Nd in the 2:14:1 phase lattice decreases the intrinsic magnetic properties. The MMP approach,however,is effective to weaken the magnetic dilution effect. With the same average composition, the Ce-27 MMP magnet shows better magnetic properties of Hcj=11.4 kOe,Br= 13.0 kG, and (BH)max= 41.1 MGOe than the SMP one. As the Ce content is increased to 36 wt.%, the magnetic properties of the Ce-36 MMP magnet are comparable to those of the Ce-27 SMP one. When the Ce content is further increased to 45 wt.% (the Ce-45 MMP magnet), preferable magnetic performance of Br=12.4 kG, Hcj=9.0 kOe, and(BH)max=36.7 MGOe can be obtained.

Fig. 41. Room temperature demagnetization curves for the Ce-0 and Ce-27 magnets prepared by SMP approach,the Ce-27,Ce-36,and Ce-45 magnets prepared by the binary main phase MMP approach.[6]
3.3.2. Characterizations on REFe2phase
As indicated by arrows with different colors in Fig. 42,some local triple junctions (white arrows) consist mainly of Pr/Nd/Ce(>70 wt.%)and a small amount of Fe(~20 wt.%),and others (black arrows) contain ~50 wt.% Pr/Nd/Ce and~40 wt.%Fe. The former ones refer to the conventional RErich phases, which are commonly observed in Ce-free magnets. The latter ones,however,are usually unavailable within Nd-Fe-B magnets, which are completely different from the triple junctions composed mainly of REs or oxygen with much lower Fe content. The atomic ratio of RE to Fe in such regions was evaluated to be ~1:2, in good agreement with the stoichiometric composition of REFe2phase. To clarify whether they are REFe2phase or not,TEM characterizations have been carried out,as shown in Figs.43 and 44.
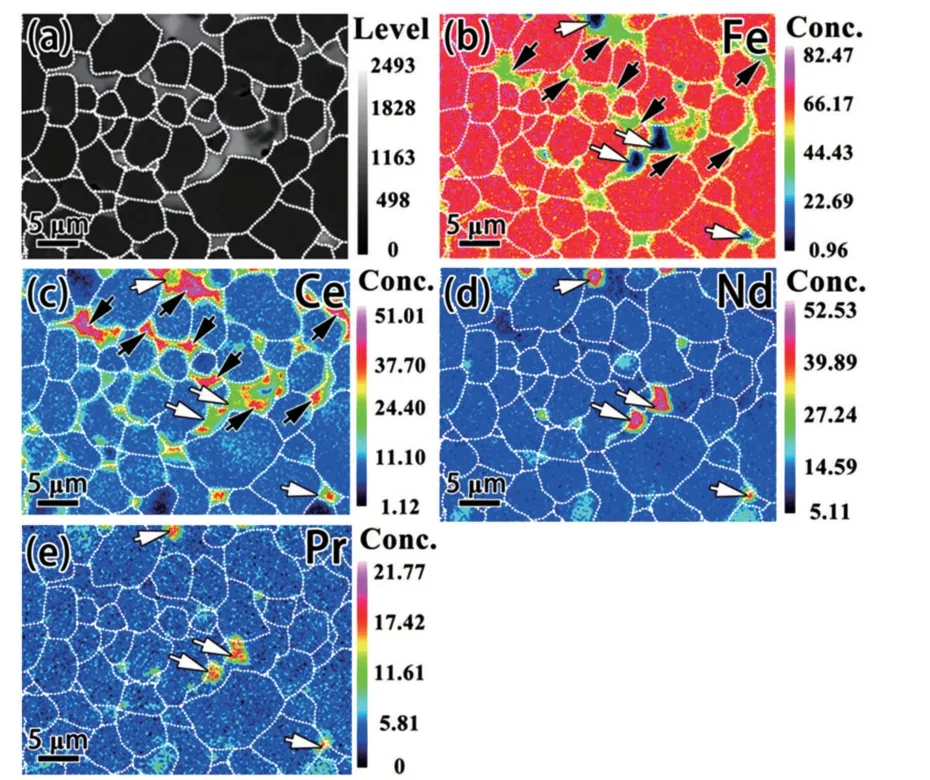
Fig.42. (a)Back-scattered SEM image and the corresponding elemental concentration distribution mappings of(b)Fe,(c)Ce,(d)Nd,and(e)Pr. The brighter contrast in(a)is the RE-rich phase,and the darker contrast reflects the 2:14:1 matrix phase. The white dashed lines illustrate the GBs and are guide for eyes. The black arrows in (b) and (c) indicate the Ce concentrated RE-rich triple junctions with relatively higher Fe content,while the white arrows indicate Pr/Nd/Ce concentrated RErich triple junctions with lower Fe content.[6]
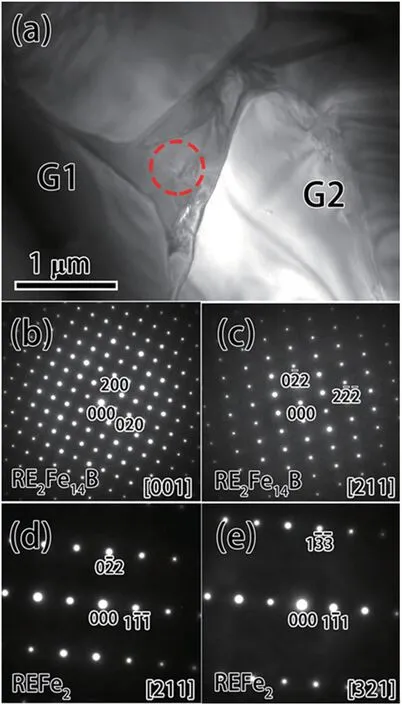
Fig.43. TEM characterizations for the Ce-45 MMP magnet. (a)Bright field image taken along the[001]zone axis of grain 1(G1). (b)SAED pattern taken in the region of grain 1. (c) SAED pattern taken in the region of grain 2 (G2). (d) and (e) SAED patterns taken in the region indicated by the red dashed circle in (a) by tilting it to different zone axes,revealing a cubic structure(space group Fd¯3m).[6]
Figure 43(a) shows a low-magnification BFI of the Ce-45 MMP magnet. Grains 1 and 2 with larger size are the 2:14:1 matrix phase, as identified by the SAED patterns in Figs. 43(b) and 43(c), taken along the [001] and [211] zone axes, respectively. Crystal structure of the triple junction region has also been identified by SAED patterns using a smaller aperture as indicated by the red dashed circle. The SAED patterns in Figs.43(d)and 43(e)were taken for the RE triple junction region with two different orientations, which can be indexed as a diamond cubic structure with zone axes of[211]and [321], respectively. The d-spacings for the planes (1¯1¯1)and (0¯22) in Fig. 43(d) are 0.422 nm and 0.261 nm with the calculated lattice parameter of a=0.737 nm,which is consistent with the REFe2phase. Besides, the obtained d-spacing of d(1¯33)=0.168 nm is also consistent with the REFe2phase(Fig.43(e)). TEM characterizations conducted for another region of the Ce-45 MMP magnet are also shown in Fig. 44.The SAED patterns(Figs.44(b)and 44(c))of the triple junction region are also obtained with two orientations. Again,it is proved to be the cubic REFe2phase with zone axes of[211] and [310]. Furthermore, the REFe2phase and 2:14:1 matrix phase grains are well combined with smooth interfaces as shown in Figs.44(d)and 44(e).
The above characterizations confirm the existence of REFe2phase in the intergranular regions of the MMP magnets,being consistent with the EPMA results in Fig.42.The following questions then arise,how does the REFe2phase form and how does it affect the microstructure and the magnetic properties of the MMP magnets? To answer these questions, we have investigated the phase constituents and the microstructural evolutions as follows.
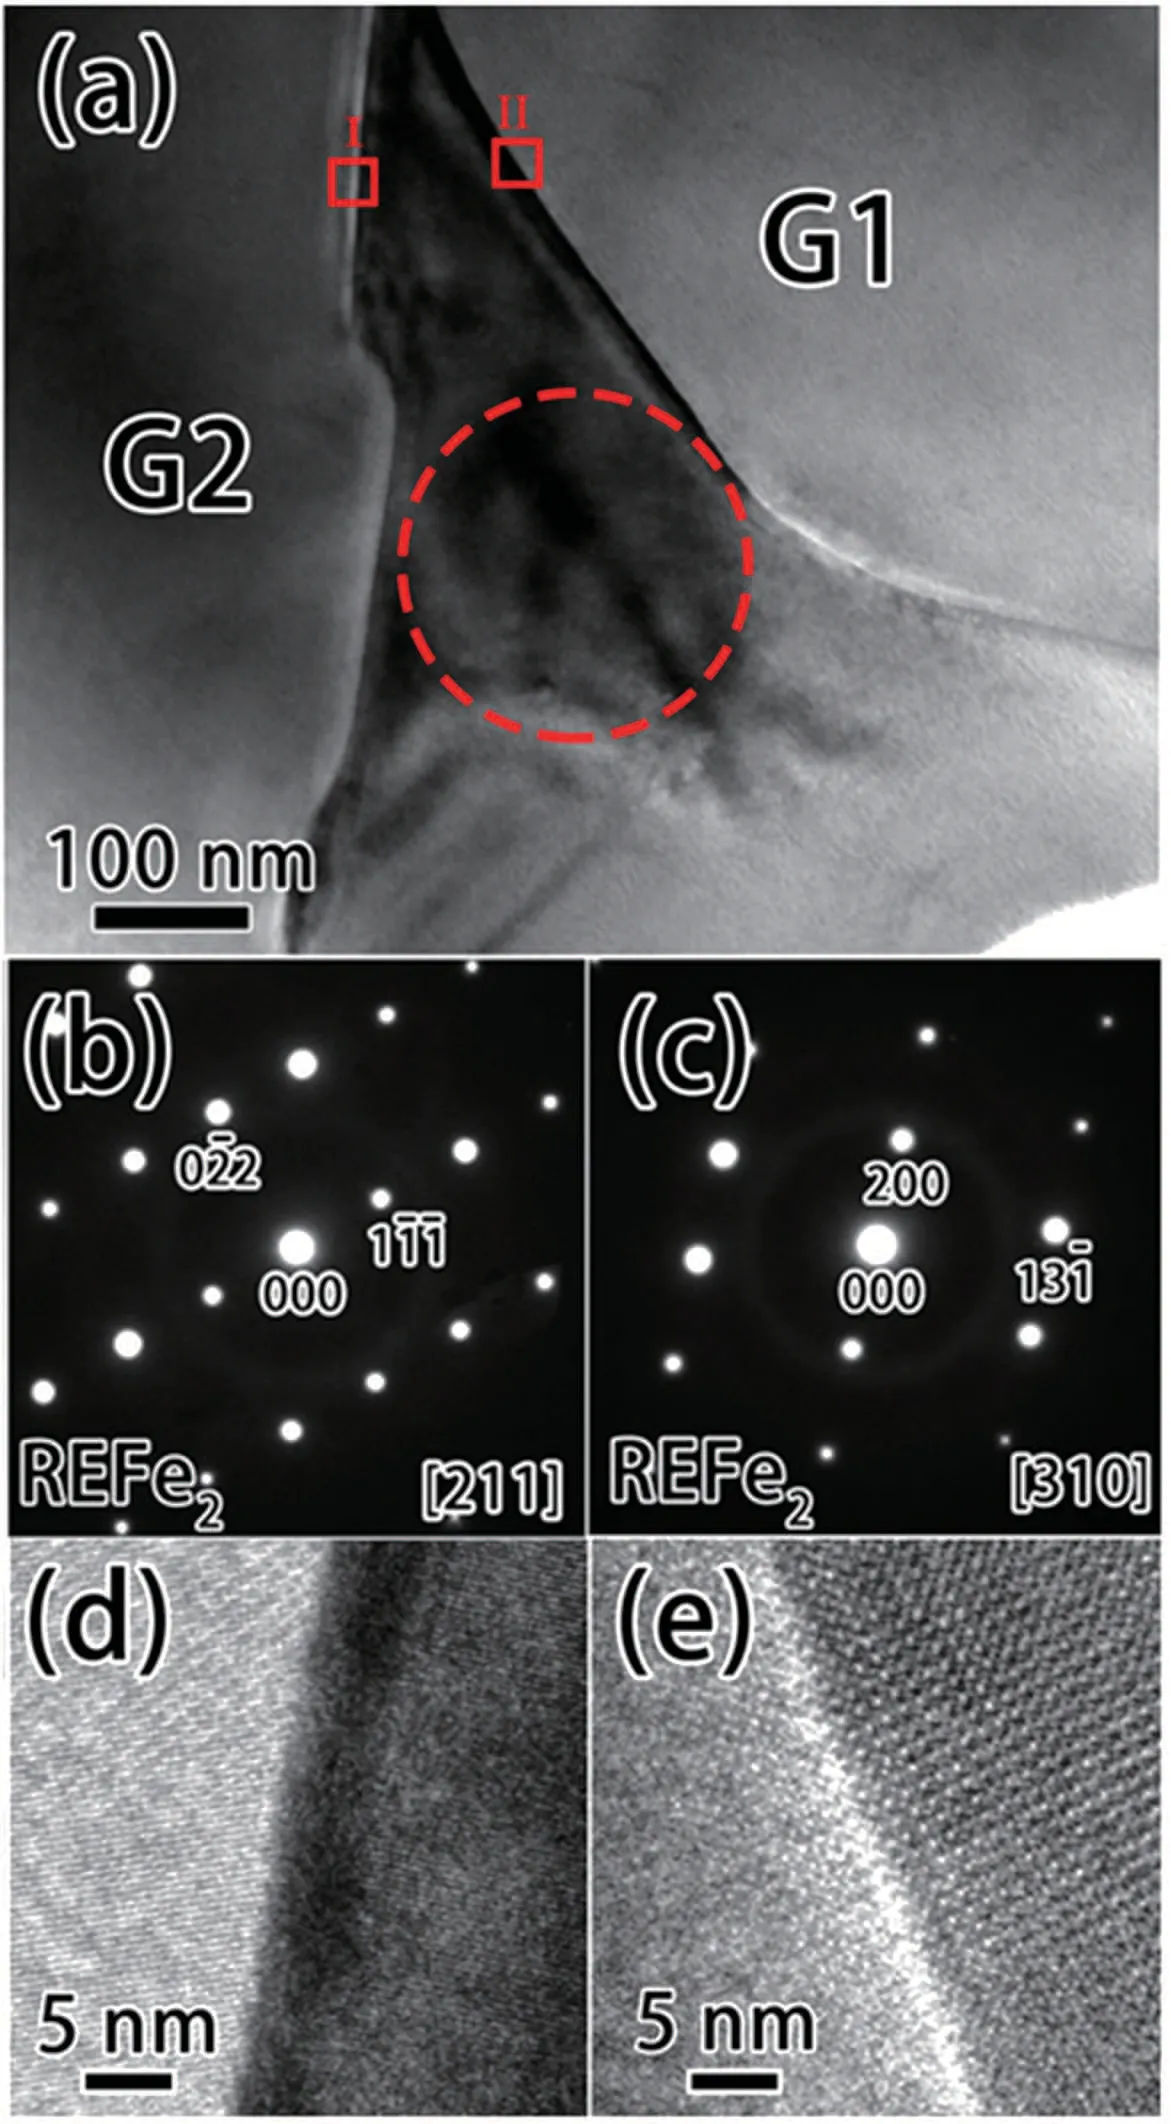
Fig.44. TEM characterizations for another typical region of the Ce-45 MMP magnet. (a)Bright field image taken along the[211]zone axis of REFe2 phase(triple junction). (b)and(c)SAED patterns for the triple junction region as indicated by the red dashed circle in (a) along two different zone axes. (d)and(e)TEM images with a high magnification taken from the regions indicated by the red squares I and II in(a).[6]
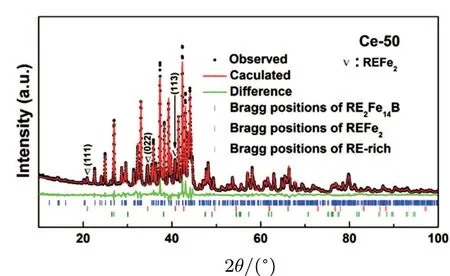
Fig. 45. XRD pattern for the Ce-50 component in powder form. The black dots show the observed experimental data and the red full line represents the calculated fits to the experimental data. Green line shows the difference between the fitted and observed results. The Bragg positions of RE2Fe14B, REFe2, and RE-rich phases are indicated by the short vertical bars in blue,red,and olive,respectively.[6]
Firstly, we investigated the initial phase constituents of the Ce-50 component powders by Rietveld XRD analysis, as shown in Fig.45. The strongest reflections correspond to the 2:14:1 tetragonal phase (space group P42/mnm). Further refinement reveals that the REFe2phase (space group Fd¯3m)and a small amount of RE-rich phase(space group P63/mmc)coexist with the 2:14:1 matrix phase. The lattice parameters and mass fraction of the phases are listed in Table 5. Besides the overlapped reflections, the individual ones (111), (022),and (113) at 2θ of 21.0°, 34.6°, and 40.8°correspond to the REFe2phase. The mass fraction of the REFe2phase was evaluated to be 6.85 wt.%, which is lower than that in the ternary Ce-Fe-B system. The lattice parameter of the REFe2phase is a=0.7346 nm, which is consistent with the calculated value from the SAED patterns. In addition, the calculated lattice parameters of the 2:14:1 phase (a=0.8788 nm and c = 1.2182 nm) are slightly smaller than the reported data for Nd2Fe14B (a=0.880 nm and c=1.220 nm) since Ce2Fe14B possesses smaller lattice parameters(a=0.876 nm and c=1.211 nm)than Nd2Fe14B.[4]It also confirms that Ce substitutes partially for Pr/Nd in the 2:14:1 phase.
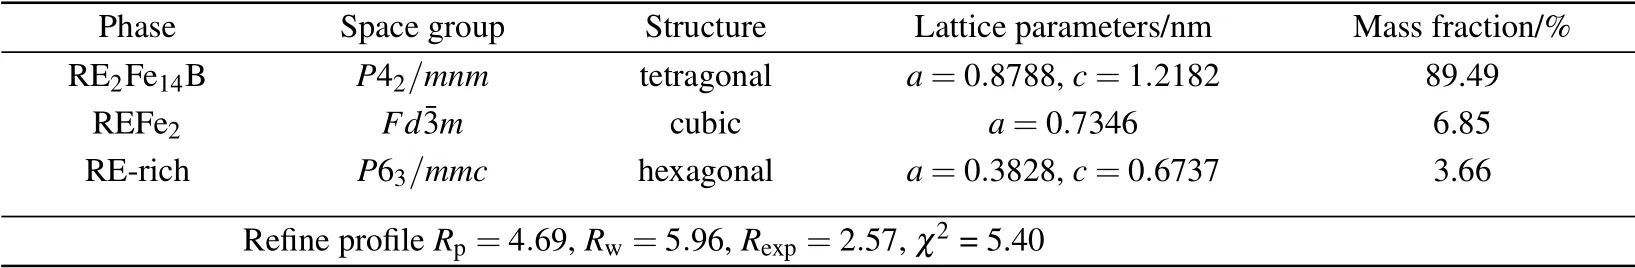
Table 5. Space group, crystal structure, lattice parameters, and mass fraction of the phases in the Ce-50 component evaluated by Rietveld analysis(Fig.45).[6]

Fig.46. XRD patterns for the powder samples of(a)Ce-45 MMP,(b)Ce-27 MMP, and (c) Ce-27 SMP sintered magnets. The black dots show the observed experimental data and the red full line represents the calculated fits to the experimental data. Green line shows the difference between the fitted and observed results. The Bragg positions of RE2Fe14B,REFe2,and RE-rich phases are indicated by vertical bars in blue,red,and olive,respectively.[6]
After sintering and post annealing,the REFe2phase is inherited from the Ce-50 component to the MMP magnets. In Figs. 46(a) and 46(b), the step-scanned XRD patterns for the Ce-45 and Ce-27 MMP magnets in powder form show that(111), (022), and (113) reflections of REFe2phase still exist, as indicated by the ∇symbols. The typical diffraction reflections of REFe2phase show higher intensity in the Ce-45 magnet due to the increased Ce-50 component. Considering that both Ce-27 MMP and Ce-45 MMP magnets were prepared by the Ce-free component and the Ce-50 component with initial mass ratios of 46:54 and 90:10,the mass fractions of REFe2phase in Ce-27 MMP and Ce-45 MMP magnets should be 3.70 wt.%and 6.17 wt.%.The calculated mass fractions of REFe2phase from Figs. 46(a) and 46(b) (2.27 wt.%and 5.60 wt.%) are slightly smaller than the initial values.It suggests that partial REFe2phase reacts with the RE-rich phase during sintering and post annealing. For comparison,such representative diffraction reflections are not detected in the Ce-27 SMP magnet(Fig.46(c)),indicating that the REFe2phase is absent or its amount is too small to be detected by XRD.
3.3.3. Microstructure of (Nd, Ce)-Fe-B magnets
Role of REFe2phase on the microstructure of MMP magnets has also been investigated. Figure 47 shows the DSC curve of the Ce-50 component upon heating to 1200°C at 10°C/min. Two obvious endothermic peaks are observed.The endothermic reaction at 1142°C corresponds to the melting of the 2:14:1 matrix phase. Considering that the alloy contains 50 wt.% of Ce in the TRE content, the melting point of the 2:14:1 phase is decreased compared to Nd2Fe14B(1155°C).[102]The other endothermic reaction at 978°C can be attributed to the melting of the REFe2phase which has a higher melting point than CeFe2(925°C). As the sintering temperature of 1030°C is much higher than the melting point of the REFe2phase,the REFe2phase melts during hightemperature sintering,which provides additional liquid phase in addition to the conventional RE-rich phase.
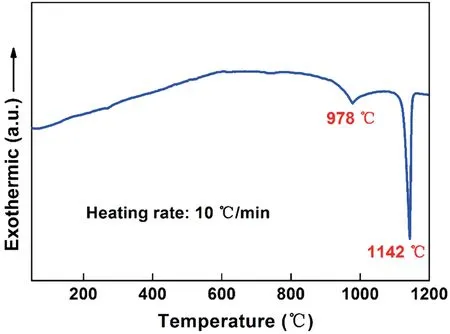
Fig.47. DSC curve for the Ce-50 component upon heating to 1200 °C at 10 °C/min.[6]
Nd2Fe14B-type sintered magnets possess a liquid-phasesintering process and the wettability between the matrix 2:14:1 phase and liquid phase plays an important role on the microstructure and magnetic properties.[103]The volume fraction of the liquid phase strongly affects the sintering process,which is essential for magnet densification. As schematically described for the SMP magnets(Fig.48(a)),the RE-rich phase primarily melts upon heating, flows and penetrates into the interspace of the 2:14:1 phase particles by further sintering,leading to rearrangement and displacement of the matrix particles due to capillary suction. Finally, dense sintered magnets can be obtained. For the MMP magnets(Fig.48(b)),the RE-rich phase can also gradually wet the 2:14:1 phase grains similarly. The additional REFe2phase melts and increases the volume fraction of the liquid phase,which is beneficial to enlarge the direct contact areas between the liquid GB phase and the 2:14:1 grains during the high-temperature sintering. Better wettability contributes to magnet densification as well as the formation of continuous GB phase. Consequently, a high density can be obtained for the MMP magnets.

Fig. 48. Schematic illustrations for the evolution of microstructure in(a)SMP and(b)MMP magnets during sintering.[6]
Figure 49 shows the back-scattered SEM images for the Ce-27 SMP,Ce-27 MMP,Ce-36 MMP,and Ce-45 MMP magnets. The Ce-27 SMP magnet possesses discontinuous GBs,which means the neighboring ferromagnetic grains are not well isolated (Fig. 49(a)). Note that, for the MMP magnets,the higher Ce content,the larger volume fraction of the REFe2phase. Figures 49(b)-49(d)show obvious changes of the GBs in the MMP magnets. In comparison with the Ce-27 SMP magnet, continuous intergranular RE-rich phases are formed in the Ce-27 MMP magnet with the same average composition (Fig. 49(b)). As the Ce amount increases, the contrast of intergranular phases becomes clearer and more continuous,isolating well the 2:14:1 phase grains(Figs.49(c)and 49(d)).It is clear that the increased REFe2phase promotes the formation of continuous intergranular phases along the GBs.
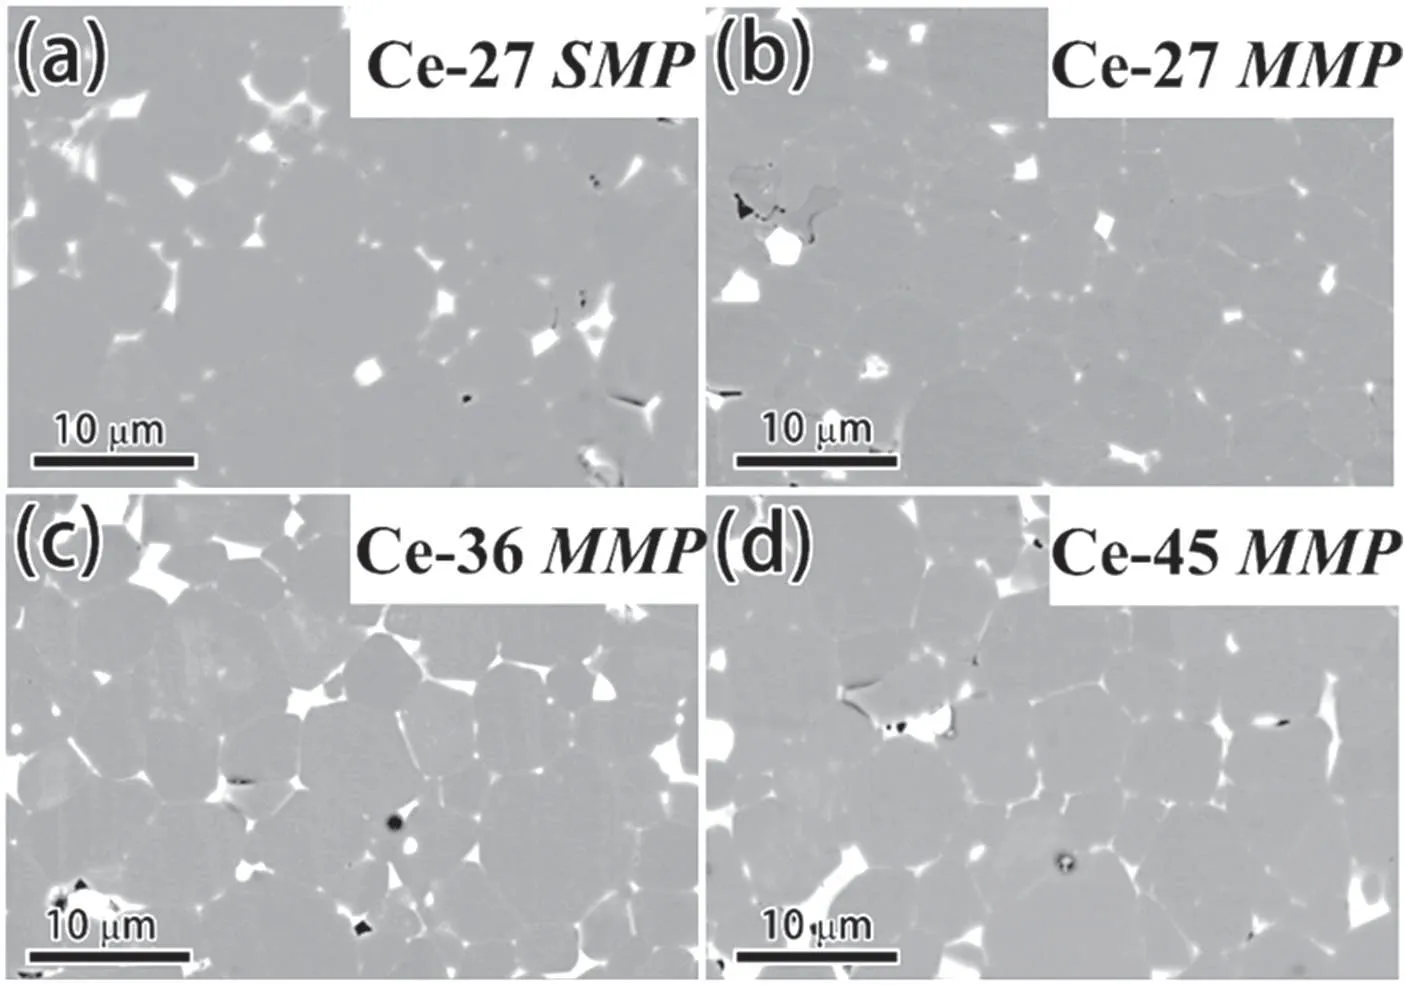
Fig. 49. Back-scattered SEM images of the magnets: (a) Ce-27 SMP,(b)Ce-27 MMP,(c)Ce-36 MMP,and(d)Ce-45 MMP.[6]
A thin GB layer is observed in the Ce-27 SMP magnet (Fig. 50(a)), which appears discontinuous in the backscattered SEM image. Such thin GB phase is not sufficient to isolate adjacent grains, being one important reason for its low coercivity. For the MMP magnet, the GB layer is much thicker(~25.3 nm,Fig.50(b)),which is beneficial to isolate neighboring 2:14:1 phase grains and to decouple them during magnetization reversal. Figure 51 shows the L-TEM images(Fresnel mode). Since the samples were prepared with the caxis in plane, the opposite magnetizations produce the dark and bright contrasts at the magnetic domain walls. For the Ce-27 SMP sample(Fig.51(a)), the configuration shows that the triple junction with three 2:14:1 hard magnetic grains is isolated by the thin intergranular phase. Note that the domain walls are continuous across the GBs (the red dashed rectangle), which indicates the short-range exchange coupling between adjacent hard magnetic grains. Such kind of continuous domain walls are common in the Ce-27 SMP sample, but are rare in the Ce-45 MMP magnet. The L-TEM image of the Ce-45 MMP sample(Fig.51(b))shows that the magnetic domains are interrupted by the thick GB phase.The discontinuous magnetic domain walls suggest the magnetic decoupling of the adjacent grains. The magnetization reversal will not be cascaded across the GBs even if nucleation occurs at the weakest point in the bulk magnet, as each 2:14:1 grain is magnetically decoupled. Thus,the unique structural and chemical features of the GB phase in the Ce-substituted MMP magnets may also play an important role on enhancing coercivity.
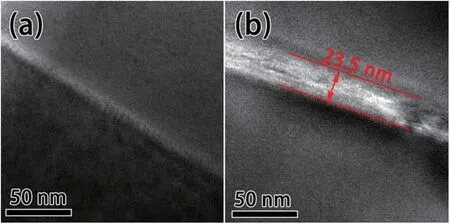
Fig.50. TEM images for the GBs between adjacent RE2Fe14B matrix phase grains: (a)Ce-27 SMP and(b)Ce-45 MMP magnets.[6]
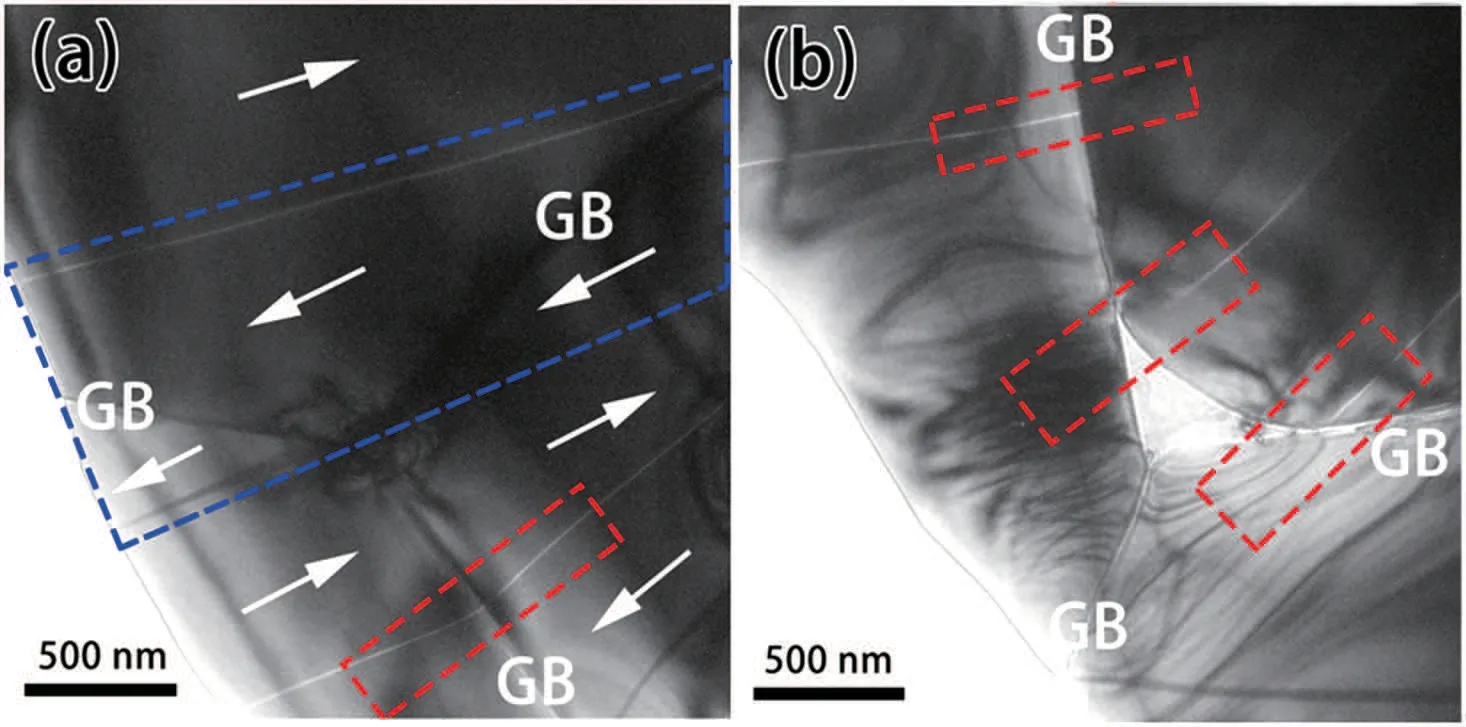
Fig.51. L-TEM Fresnel images of(a)Ce-27 SMP and(b)Ce-45 MMP magnets with the c-axis in plane and observed in the zero applied magnetic field. Red dashed rectangles in (a) and (b) highlight the domain walls. Blue rectangle in(a)indicates the magnetic domain across three different grains.[6]
The existence of REFe2phase helps to optimize the microstructure of MMP magnets. Previous literature[16]has also revealed the existence of minor REFe2phase as independent grains in the high-Ce containing Nd-Ce-Fe-B magnets.Since CeFe2is paramagnetic at room temperature (Curie temperature TCof 227 K[104]),its existence decreases the remanence of the Nd-Ce-Fe-B magnets. Although TCof the present REFe2phase (containing Pr and Nd) could be different from that of CeFe2, it is usually deemed as a soft magnet below TC,being harmful to the hard magnetism. Its existence,however, is beneficial to optimize the microstructure and hence to enhance the coercivity. As revealed in Fig. 47, the melting point of the REFe2phase is lower than that of the 2:14:1 phase. Sintering above its melting point enlarges the volume fraction of liquid phase and promotes the formation of continuous GB phases (Figs. 48 and 49), which in turn weaken the exchange coupling effect between adjacent hard magnetic grains.[105]In addition, it is spontaneously formed in the initial Ce-containing component, which facilitates the improvement of wettability between the GBs and matrix phase without the need of incorporating extra low-melting-point intergranular additives.
Effects of REFe2phase on the microstructure and magnetic properties of(Nd, Ce)-Fe-B sintered magnets prepared by the MMP approach have been investigated.[6](i) The REFe2phase forms spontaneously in the initial Ce-50 component and inherits into the final MMP magnets. The REFe2phase is mainly located in the intergranular regions,which distinctly differs from the conventional RE-rich phases in the Nd-Fe-B sintered magnets. (ii) The REFe2phase melts during sintering due to its lower melting point than that of the matrix 2:14:1 phase, which enlarges the volume fraction of the liquid phase. It improves the wettability of the matrix phase grains and promotes the formation of continuous grain boundary phases.(iii)The continuous grain boundary layers are beneficial to isolate the adjacent matrix grains,i.e.,to weaken the short-range exchange coupling between them, which is also an important reason for the retained coercivity of the MMP magnets. (iv)The positive role played by the REFe2phase on microstructure suggests that the Ce substitution level in (Nd,Ce)-Fe-B sintered magnets can be further increased,enabling the fabrication of low-cost rare earth permanent magnets with magnetic properties fulfilling the gap between hard ferrites and commercial Nd-Fe-B magnets.
4. Summary and perspectives
The current state-of-the-art techniques for enhancing the overall performances of Nd-Fe-B permanent magnets,including coercivity, corrosion resistance, HRE consumption, and high-abundant La/Ce/Y application have been presented in this review. The concluding remarks are summarized as follows.
1)Through replacing the traditional Nd-rich phase by the manually designed GB phase,the GBR approach provides effective solutions to the poor corrosion resistance, low coercivity,and high HRE utilization,the long-standing drawbacks of Nd-Fe-B magnets. Higher electrode potential of the new GB phase decreases the driving force for electrochemical corrosion between the matrix and intergranular phases, facilitating intrinsically the anti-corrosion stability. In the case of(Pr,Nd)32.5Fe62.0Cu5.5-restructured magnets,the mass loss against hot/humid atmosphere is remarkably lowered down to one sixteenth compared to the unrestructured one with the equivalent total RE content. Incorporating the low-melting-point Dy-containing alloys via the GBR approach, high coercivity without sacrificing the remanence and energy product can be acquired due to the (Dy, Nd)2Fe14B hardening shell as well as continuous GBs. More importantly, coercivity increment by per unit Dy addition can be effectively enhanced through the GBR approach,hence reducing the HRE consumption significantly. Altogether, the restructured 2:14:1-typed magnets exhibit high figures of merit, which are desirable for a wide range of technological applications. All the outstanding hallmarks root in the restructured GB phase, which substantially differs from the traditional Nd-rich phase.
2)It is generally acknowledged that high La substitution for Nd cannot be allowed due to severe 2:14:1 phase instability and drastic magnetism deterioration. However,we propose a new prototype of La-Ce co-substitution, where La of larger atomic radius induces the Ce valence shift towards the+3 state with an extra 4f electron, therefore strengthens the magnetization of the Ce-based tetragonal compound. High magnetic performance and mechanical properties can be obtained in the La-Ce co-substituted RE-Fe-B sintered magnets.For example, with 36 wt.% La-Ce concentration, high level of (BH)max≥42.2 MGOe still caters to medium-to-high applications of permanent magnets. Y with comparable crustal abundance to Nd can enhance the thermal stability of the Cesubstituted RE-Fe-B magnets by increasing the Curie temperature and lowering the temperature coefficient, which facilitates their applications in emerging high-tech sectors. At the same substitution level for Nd(9 wt.%),the absolute value of the coercivity temperature coefficient from 293 K to 393 K for the (Nd, Ce, Y)-Fe-B magnet is 16.2% lower than that for the(Nd,Ce)-Fe-B one. From a fundamental perspective,La-Ce and Y-Ce co-substitutions provide a new recipe that Ce,La,and Y can be utilized simultaneously,which not only guarantees the stability of the 2:14:1 tetragonal phase,but also benefits the magnetism of hard magnets. On the technological side, the application of less-risky Ce, La, and Y in developing low-cost RE-Fe-B magnets contributes to the sustainable and balanced development of RE industry. As of February 2016,the cost of La-Ce alloy is approximately one-twelfth of that of Pr-Nd alloy,thus the total material cost can be lowered by about 57% with 50 at.% La-Ce replacement for Pr-Nd,e.g.,$22 per kg for(Pr,Nd)2Fe14B versus$9.5 per kg for[(Pr,Nd)0.5(La,Ce)0.5]2.14Fe14B.
3) For (Nd, Ce)-Fe-B magnets, in addition to the RE2Fe14B matrix phase and RE-rich intergranular phase, the REFe2phase also accounts for a substantial fraction in the GB regions,which highly affects the magnetic performance. This finding possesses far-reaching implications that if the GBR approach can be fully exploited and applied to the La/Ce/Y-rich RE-Fe-B magnets,the new difficulties concerning the GB regions are promising to be conquered. It sheds light on developing La/Ce/Y-containing RE-Fe-B magnets with deliberately tailored GB phases via the GBR approach,including the phase component,the elemental distribution,the volume fraction of GB phases,and so on. It will also in turn result in new understandings on the GB design to maximize the all-round performance of 2:14:1-typed permanent magnets.
猜你喜欢
杂志排行

Chinese Physics B的其它文章
- Coercivity mechanisms in nanostructured permanent magnets∗
- Progress in recycling of Nd-Fe-B sintered magnet wastes∗
- Topology of triple-point metals∗
- Local evolutions of nodal points in two-dimensional systems with chiral symmetry∗
- Structural,elastic,and electronic properties of topological semimetal WC-type MX family by first-principles calculation∗
- Scanning tunneling microscopic investigation on morphology of magnetic Weyl semimetal YbMnBi2∗