河北典型农田大气重金属干沉降通量及来源解析*
2019-08-06张国忠潘月鹏顾梦娜吕雪梅何月欣刘博文王跃思田世丽
张国忠, 黄 威, 潘月鹏, 顾梦娜, 吕雪梅, 倪 雪,何月欣, 刘博文, 王跃思**, 田世丽**
河北典型农田大气重金属干沉降通量及来源解析*
张国忠1,2, 黄 威2, 潘月鹏2, 顾梦娜2, 吕雪梅2, 倪 雪2,何月欣2, 刘博文2, 王跃思1,2**, 田世丽2**
(1. 甘肃农业大学林学院 兰州 730070; 2. 中国科学院大气物理研究所/大气边界层物理和大气化学国家重点实验室北京 100029)
重金属是影响农田土壤环境质量和农产品品质的主要污染物, 大气沉降是农田重金属的来源之一。长期以来, 由于观测资料缺乏, 对于我国农业区大气重金属的沉降量和来源认识一直不清楚。本研究基于河北典型农田连续1年的外场观测, 测试分析了大气气溶胶9个粒径段中25种金属元素的含量, 结合干沉降阻抗模型估算了这些金属的干沉降量, 并利用PMF模型对其来源进行了解析。结果表明, 该区域25种金属元素在细粒子(P≤2.1 μm,P为空气动力学直径, 下同)、粗粒子(2.1
农田; 大气干沉降; 重金属; 源解析; 污染控制
重金属严重威胁农作物和农产品安全, 是一个全球主要农业区普遍关注的环境问题。重金属可通过食物链在生态系统中传递, 最终影响人类健康[1-2]。欧盟为减少农田重金属的输入, 建立了相应的土壤保护政策[3-4]。大气沉降是农田重金属污染的重要来源, 约占农田金属来源的25%~85%[5-6]。厘清大气沉降的输入及其变化对农田污染防治具有重要意义和现实需求。
大气颗粒物中的金属可通过干、湿沉降的方式进入农田生态系统。湿沉降因观测方法成熟, 量化研究较为全面[7], 但干沉降因测量方法困难一直缺乏评估[8]。由于颗粒物的粒径分布是决定干沉降速率的关键因子[9], 通过分粒径的化学成分测量和干沉降速率模拟可定量研究大气金属元素的干沉降。目前, 针对我国农业区大气重金属干沉降量及其来源的研究尤为匮乏。
随着工业化和城市化进程的加速, 大气中金属元素的来源也愈加复杂[1]。受体模型是环境介质中金属元素来源解析的主要方法, 包括化学质量平衡(CMB)模型、主成分分析(PCA)相关方法、正定矩阵因子分析法(PMF)等[10-11]。PMF模型被广泛应用于大气污染物的来源解析[12-13], 但以往研究多应用于单一粒径, 如PM2.5。实际上, 大气中的金属在不同的粒径段有不同的来源。例如, 细粒子中的钾(K)主要来自于生物质燃烧, 而粗粒子中的K更多来自于土壤扬尘[14]。因此, 开展不同粒径的大气金属元素源解析可以为土壤环境保护和治理提供一个新的视角。
本研究以河北省廊坊市的香河城郊农田为主要研究区域。该区域位于北京和天津2个超大城市之间, 处于大气污染物的传输通道和缓冲地带上, 在区域大气污染研究中具有重要的战略位置[15]。目前对香河地区大气常规污染物开展了一些有意义的研究[16], 但针对农田金属干沉降的研究较少。本文基于香河地区分粒径的大气金属观测, 旨在量化干沉降对农田金属的输入量, 解析大气金属元素的来源, 以期为河北区域农田重金属污染控制提供参考。
1 材料与方法
1.1 采样站点
采样站点位于中国科学院大气物理研究所香河大气综合观测站(39.75°N, 116.95°E), 所处位置地形平坦, 周围主要为农田用地和部分居民区, 无高大建筑物和明显的局地排放源。
1.2 大气颗粒物分级采样
采用撞击式采样器(Andersen Series 20-800, 美国)获取空气动力学粒径<0.43 μm、0.43~0.65 μm、0.65~1.1 μm、1.1~2.1 μm、2.1~3.3 μm、3.3~4.7 μm、4.7~5.8 μm、5.8~9.0 μm和>9.0 μm的9级颗粒物样品。采样流速为28.3 L∙min-1。采样时段为2013年的单周, 每周采样48 h, 共计26套样品。另外, 每套样品采集1个空白膜, 试验期间共收集260张纤维素滤膜样品。收集后的样品置于-20 ℃冷冻保存至分析。
1.3 颗粒物金属元素分析
取1/4纤维素滤膜, 采用微波消解仪(MARSS, CEM, 美国)进行消解, 消解酸体系为HNO3(6 mL)+ H2O2(2 mL)+HF(0.2 mL)。消解后的样品用电感耦合等离子体质谱仪(ICP-MS 7500ce, Agilent, 美国)分析其中25种金属[铍(Be)、钠(Na)、镁(Mg)、铝(Al铝)、钾(K)、钙(Ca)、钒(V)、铬(Cr)、锰(Mn)、铁(Fe)、钴(Co)、镍(Ni)、铜(Cu)、锌(Zn)、砷(As)、硒(Se)、钼(Mo)、镉(Cd)、锑(Sb)、钡(Ba)、铊(Tl)、铅(Pb)、钍(Th)、铀(U)、银(Ag)]的浓度。每套样品的空白膜同时被分析用以质量控制。采用内标法保证测量的准确性。详细的分析方法和质量控制方法以及仪器的精度、检测限、标定等参照文献[17]。
1.4 干沉降速率计算模型
大气颗粒物中金属元素的干沉降量根据化学质量平衡进行计算, 如公式(1)所示:

式中:为金属元素的干沉降通量,为金属元素的大气浓度,d为金属元素的干沉降速率,为金属元素的种类,为金属元素的粒径级数。为方便计算, 本文中金属元素的粒径级数最终合并分为3级, 分别为细粒子、粗粒子和巨粒子, 分别定义为空气动力学粒径<2.1 μm、2.1~9 μm和>9 μm。对应地, 将d分为细、粗、巨粒子, 参照Zhang等[18]模型进行计算, 粒径分别对应<2.5 μm、2.5~10 μm和>10 μm。该模型基于Zhang等[9]的模型发展而来, 简要介绍如下:
细粒子的干沉降速率[d(PM2.5)]根据公式(2)进行计算:

式中:g(PM2.5)为重力沉降速率,a为空气动力学阻力,1为不同类型下垫面经验参数,*为摩擦速度。
粗粒子的干沉降速率d(PM2.5~10)根据公式(3)和(4)进行计算:


式中:ds(PM2.5~10)为表面沉降速率,1、2、3、1、2、3为不同类型下垫面经验参数, LAI为叶面积指数, LAImax为最大叶面积指数。
巨粒子的干沉降速率d(PM10+)根据公式(5)和(6)进行计算:


式中:1、2、3、1、2、3为不同类型下垫面经验参数。
以上参数参考Zhang等[18]的取值。模型中使用的气象数据来自于廊坊市气象局观测资料。
2 结果与分析
2.1 大气金属元素的粒径分布
图1为大气颗粒物中25种金属元素质量浓度的粒径分布。可以看出, 每个季节各元素具有相似的粒径分布。春季、夏季和秋季细粒径段的峰值都出现在0.43~0.65 μm, 冬季细粒径段的峰值出现在0.43~1.10 μm。所有季节粗粒径的峰值通常都出现在4.70~5.80 μm。冬季细粒径段峰值出现的粒径范围较其他季节更宽, 表明冬季的排放源可能更复杂[19]。
根据25种金属元素质量浓度的峰值分布, 发现其粒径分布存在3种模态。1)Zn、Ag、Cd、Tl和Pb的质量浓度主要富集在细粒径段, 其峰值出现在0.43~0.65 μm或者0.65~1.10 μm。这些元素通常与燃煤、机动车排放等人为源密切相关[20]; 2)Mg、Al、Fe、Ba和Th质量浓度主要富集在粗粒径段, 其峰值出现在4.70~5.80 μm, 这些元素主要来自于尘土、岩石等自然源[21]; 3)其余金属元素在粗、细粒径段都有峰值出现, 细粒径峰值出现在0.43~0.65 μm或者0.65~1.10 μm, 粗粒径段峰值在4.70~5.80 μm, 特别是K和Mn, 其粗、细粒径段峰值具有明显的季节差异。细粒径段的峰值出现在冬季, 而粗粒径段的峰值出现在春季。该区域冬季生物质燃烧可能是其细粒径段峰值的主要原因, 而春季粗粒径段的峰值可能主要来自于沙尘等自然源的贡献[22-23]。此外, Mn、Cu、Zn、Mo、Ag、Cd和Pb细粒径段的峰值在冬季相较于其他3个季节出现了转移, 从0.43~0.65 μm粒径段转移到0.65~1.10 μm粒径段。金属元素浓度峰值转移的现象在北京雾霾期间也被观测到[24-26]。
2.2 大气金属元素的浓度特征
图2为25种金属元素在细、粗和巨粒子中的年平均浓度。可以看出, 25种金属元素的年平均浓度在细、粗和巨粒子中的变化范围分别为0.07~3 189.4 ng∙m-3、0.10~4 328.4 ng∙m-3和0.03~1 161.5 ng∙m-3。大多数元素在粗、细粒子中的浓度相当, 但Mg、Al、Ca、Fe、Ba、Th和U的质量浓度主要集中在粗粒子中, 它们在粗粒子中的质量浓度分别占总质量浓度的56%、57%、50%、52%、56%、59%和54%(图3), 而K、Cu、Zn、Se、Mo、Ag、Cd、Tl和Pb的质量浓度主要集中在细粒子中, 它们在细粒子中的质量浓度分别占总质量浓度的59%、64%、68%、54%、57%、77%、81%、88%和81%。
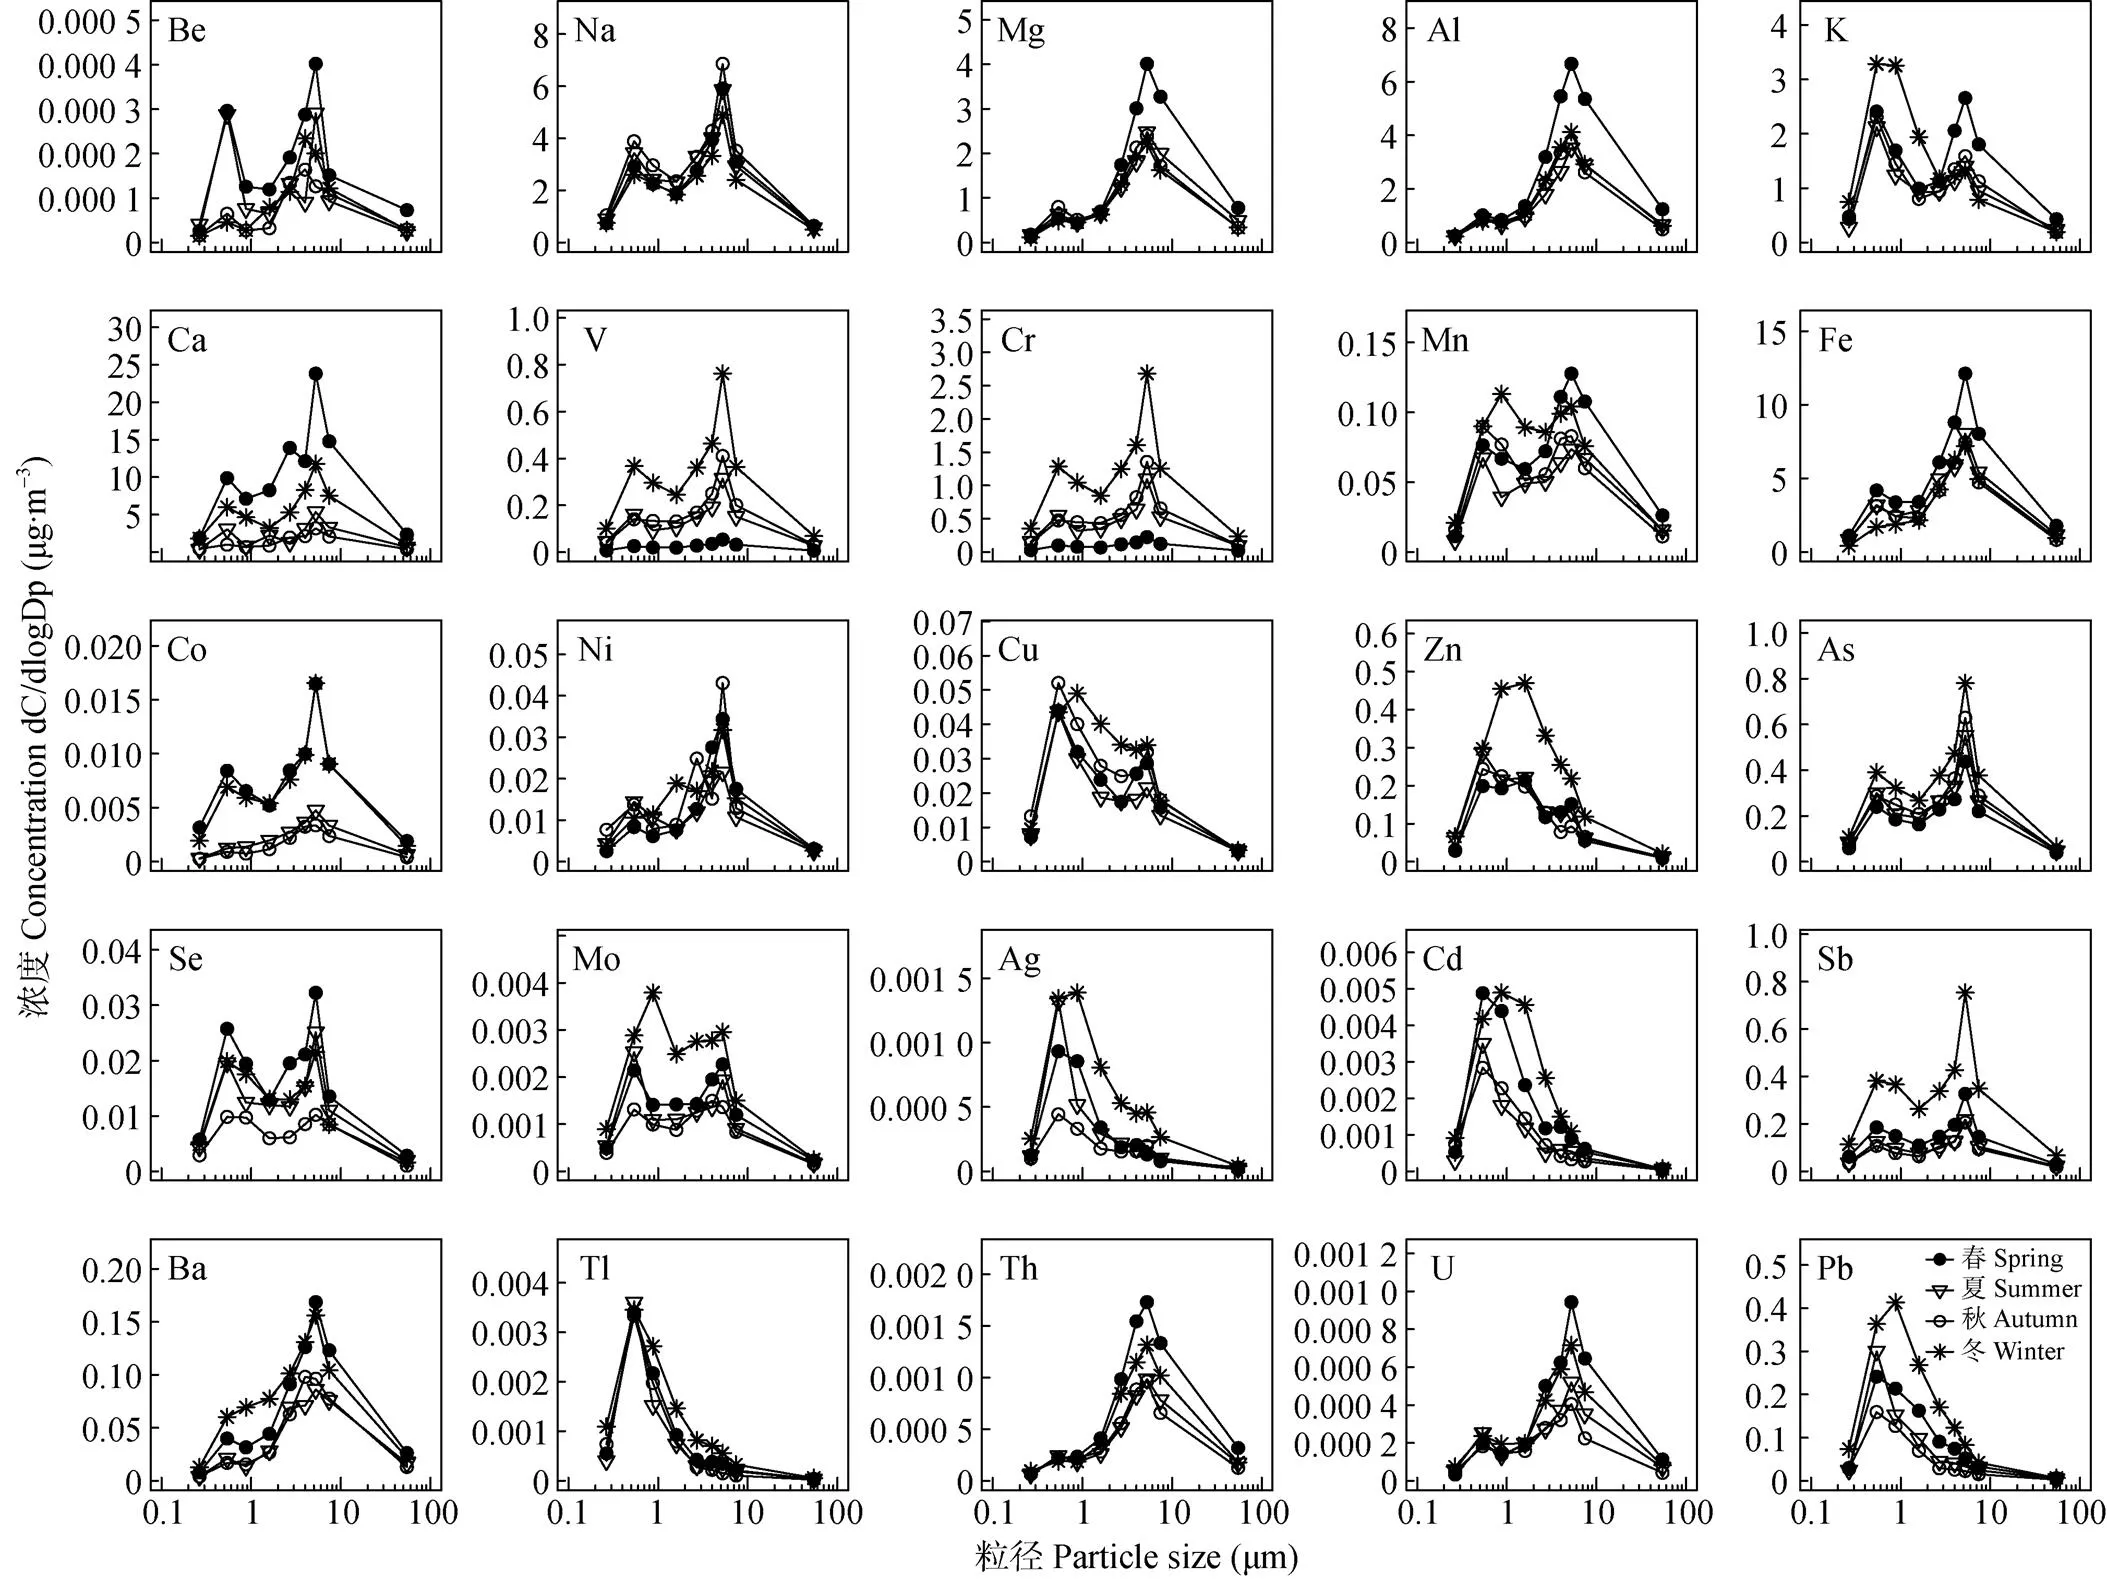
图1 研究区大气颗粒物中金属元素质量浓度的粒径分布
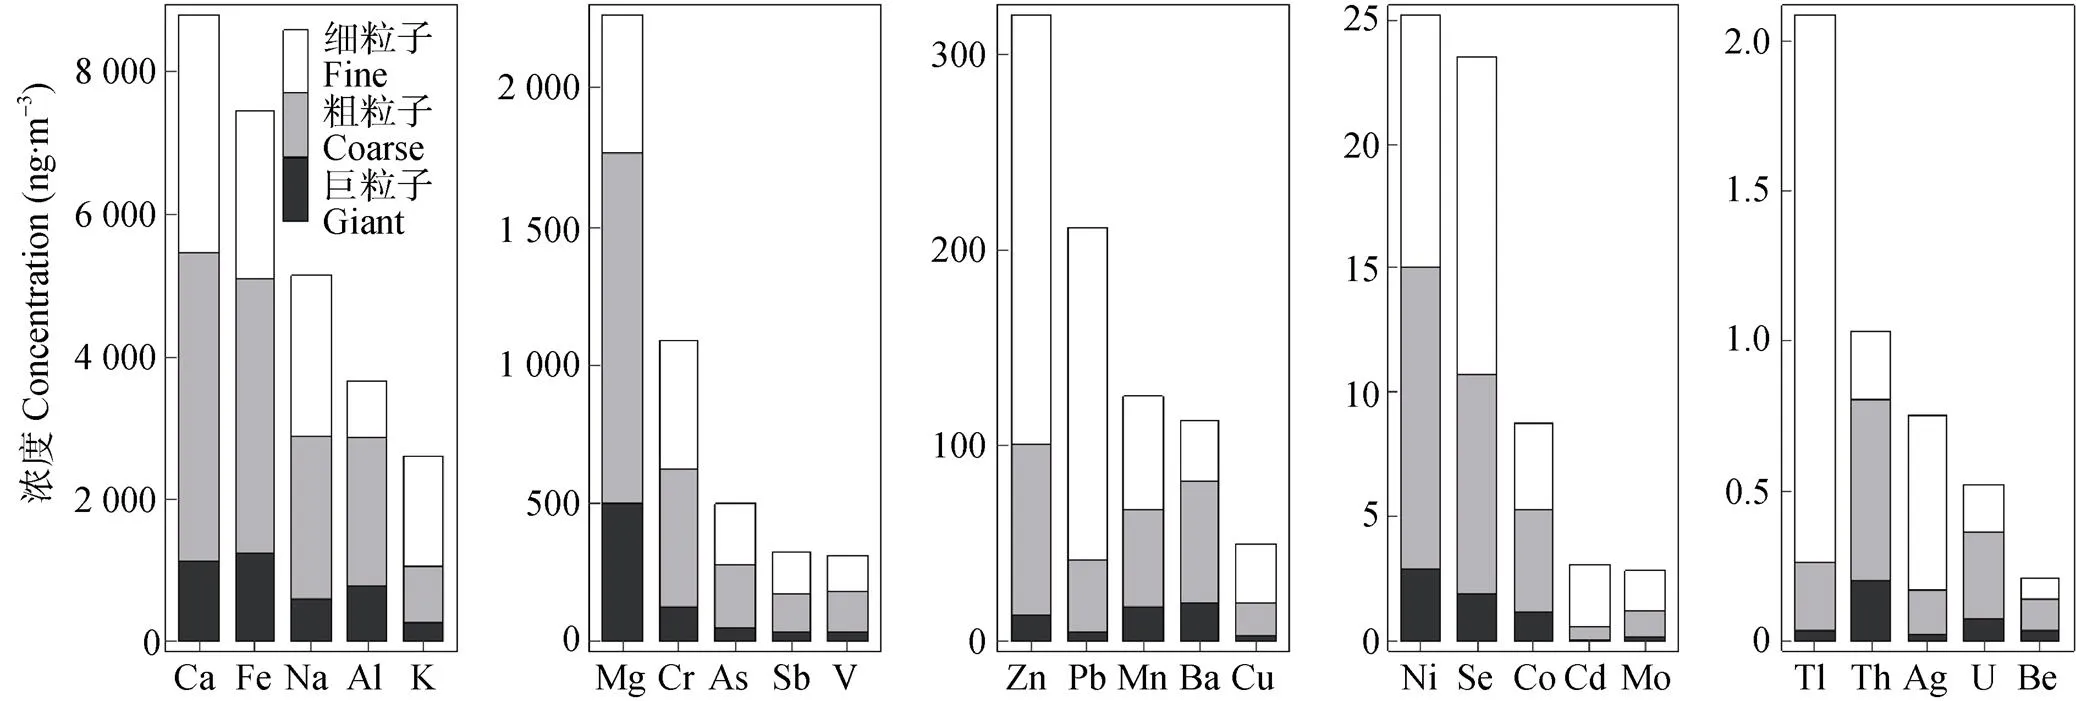
图2 研究区大气细、粗和巨粒子中金属元素年平均浓度
图4为25种金属元素在细、粗和巨粒子中浓度的季节变化。可以看出, Na在细粒子和粗粒子中的最高浓度都出现在秋季, 巨粒子中的浓度最高值出现在春季。Ni在细粒子中的浓度最高值出现在秋季, 但粗粒子和细粒子中的最高浓度都出现在春季。除Na和Ni外, 其余金属元素细、粗和巨粒子中浓度的最高值出现在春季或者冬季。春季出现最高值的金属主要为地壳源元素(例如Mg、Al和Ca), 这可能是由于中国北方地区春季风速大、相对湿度低, 沙尘等自然源贡献较大。而冬季出现最高值的元素主要为人为源元素(例如Zn、As和Pb), 这些金属元素与燃煤等人为活动密切相关, 冬季供暖可能是其主要的来源[21]。
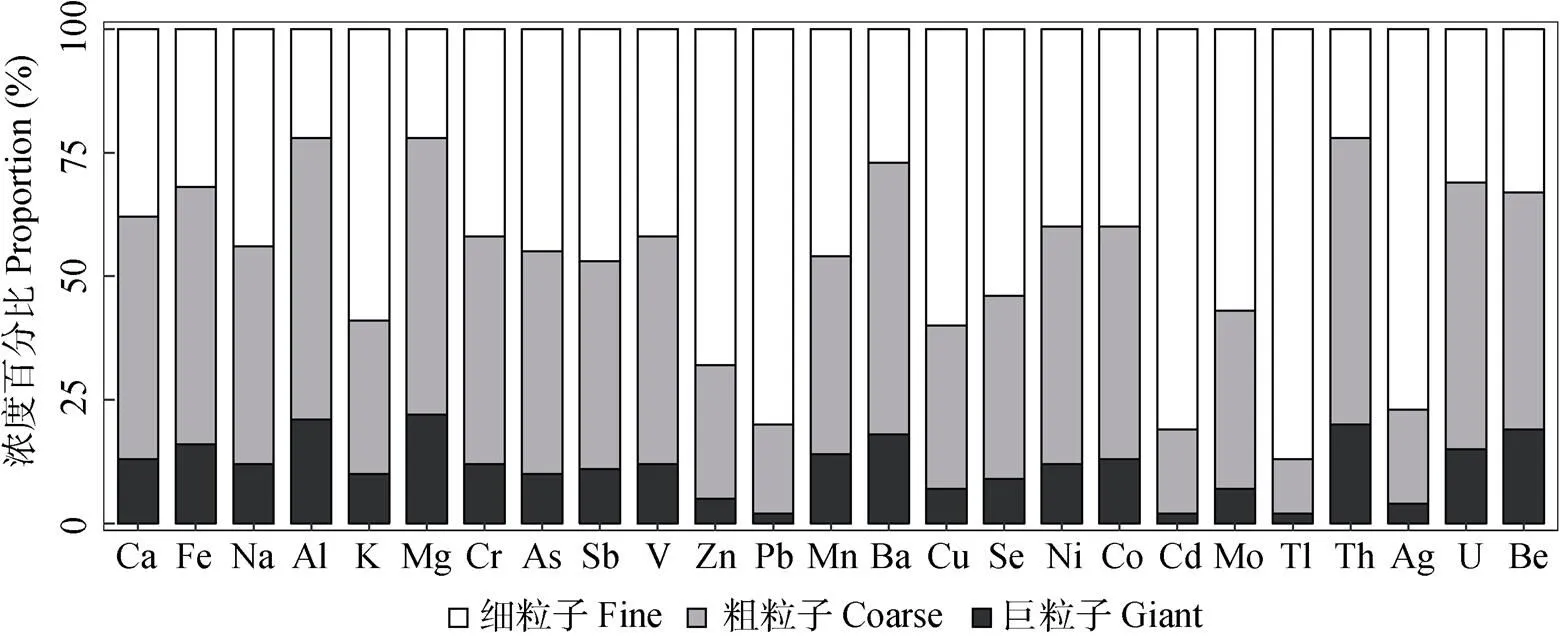
图3 研究区大气细、粗和巨粒子颗粒物中金属元素在其总质量浓度中的占比
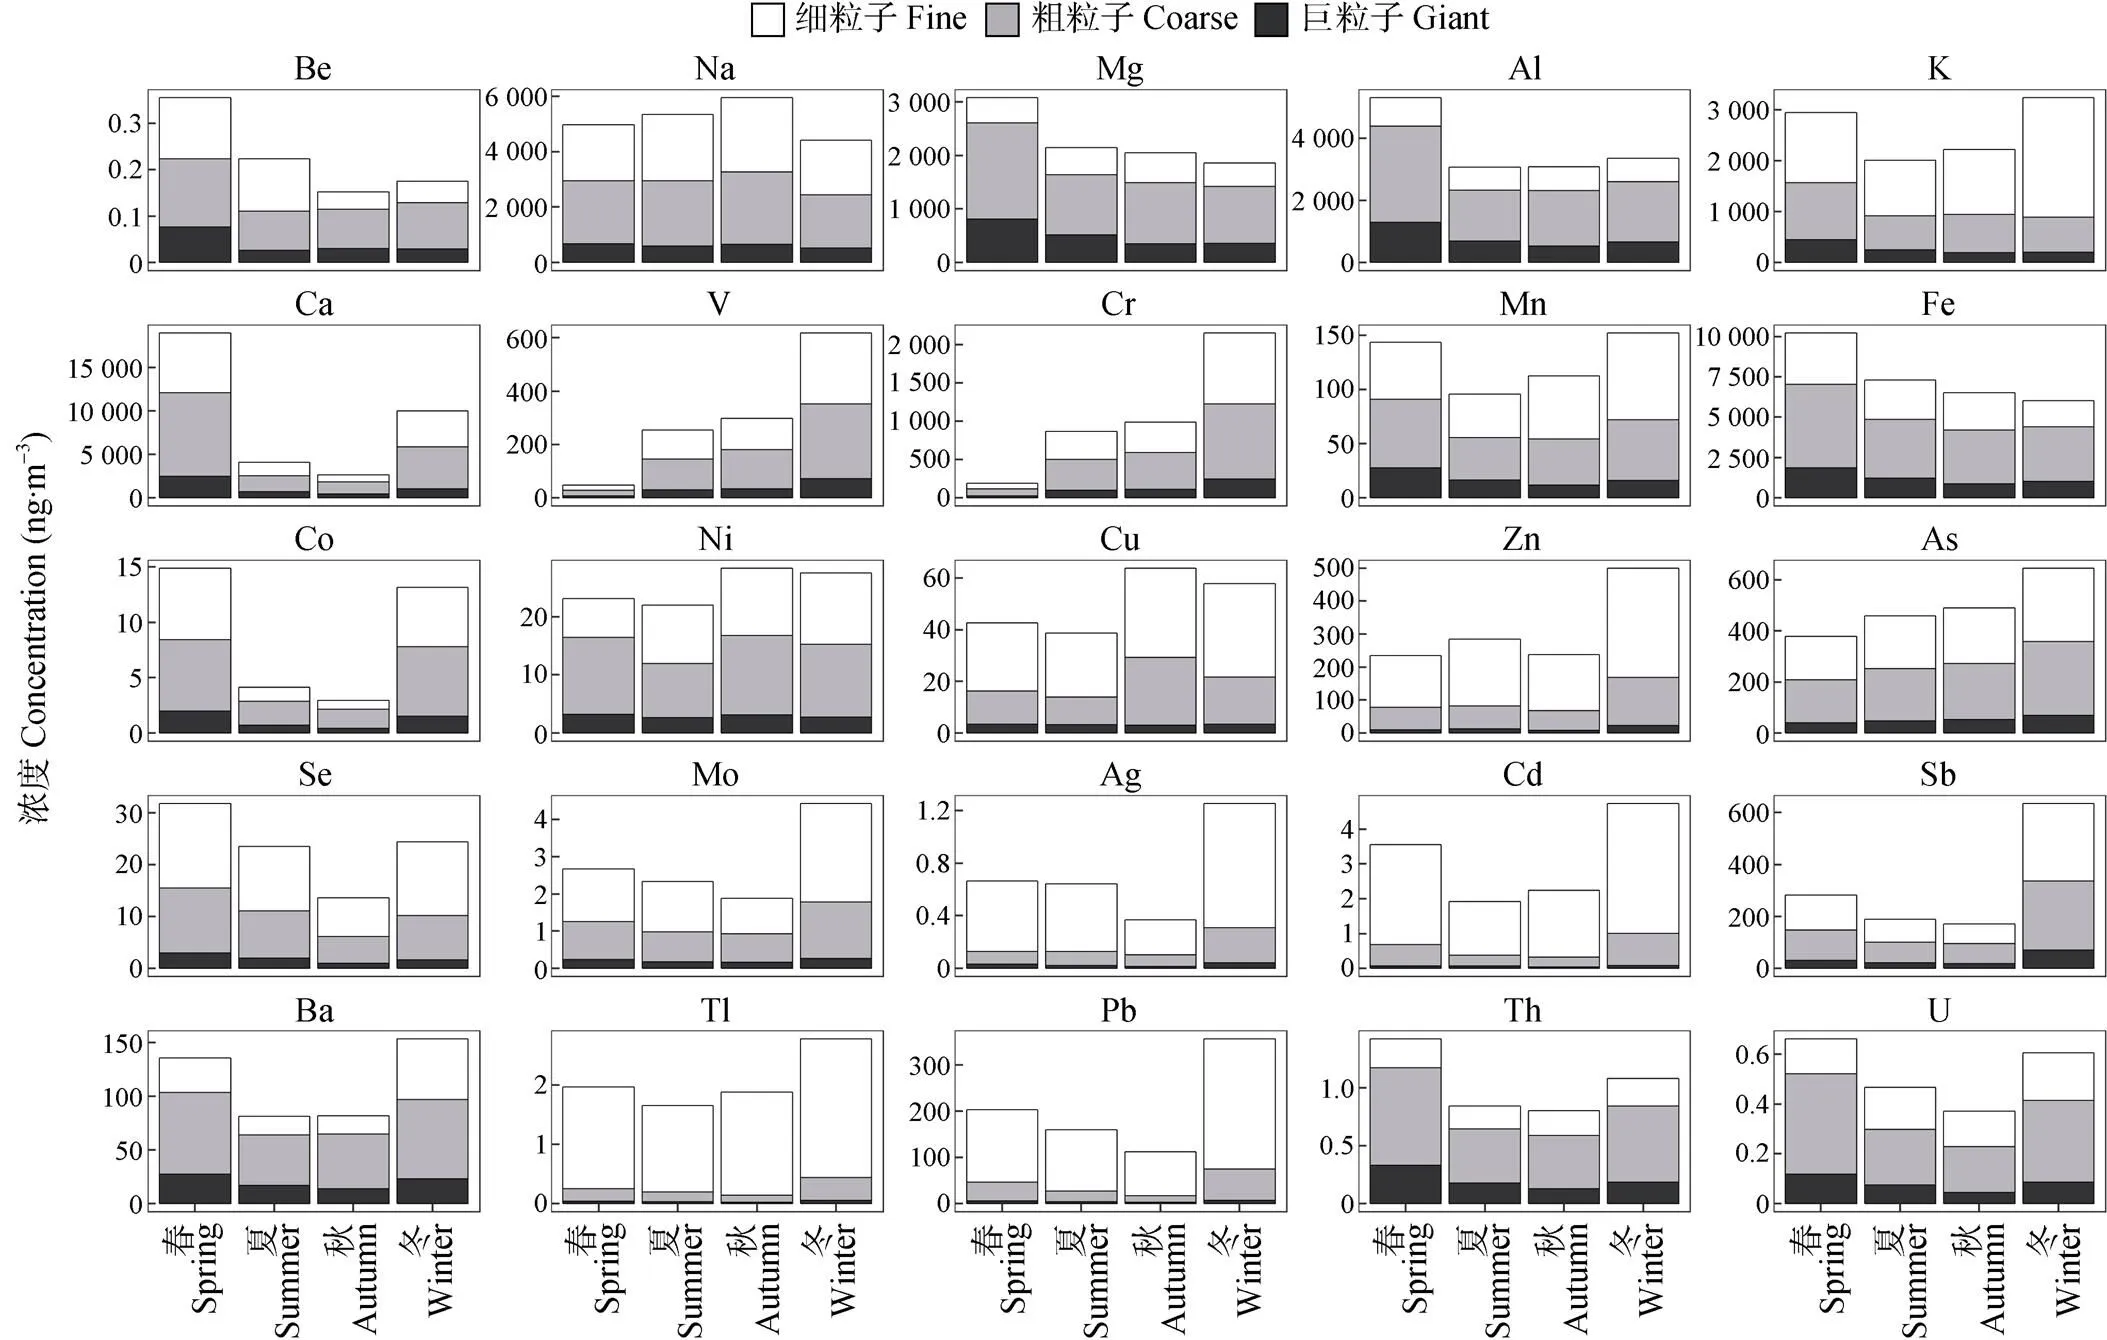
图4 研究区大气细、粗和巨粒子中金属元素浓度季节变化
Ca在细和粗粒子中的年平均浓度都是最高的, 其次是Fe和Na。细粒子中K的浓度高于Al和Mg, 但在粗粒子中低于Al和Mg。Cr是细粒子和粗粒子中质量浓度最高的重金属元素, 其次是As元素。Zn、Pb、Sb在细粒子中的浓度高于V, 但在粗粒子中低于V。总的来说, 地壳源元素(如Ca、Mg和Al)的平均质量浓度高出重金属元素(如As、Zn和Pb)1~4个数量级。
2.3 大气金属元素的干沉降量
本研究模拟的细粒子年平均干沉降速率为0.23 cm∙s-1, 变化范围为0.11~0.38 cm∙s-1; 粗粒子干沉降速率年平均值为0.26 cm∙s-1, 变化范围为0.20~0.36 cm∙s-1; 巨粒子干沉降速率年平均值为7.09 cm∙s-1, 变化范围为4.08~14.01 cm∙s-1。本文模拟的干沉降速率与大部分文献较为吻合(0.2~12 cm∙s-1)[27-28], 但高于台湾地区的模拟值(细粒子年均值为0.09~ 0.19 cm∙s-1, 粗粒子年均值为0.20~0.22 cm∙s-1, 巨粒子年均值为3.75~4.58 cm∙s-1)[29]。这些差异可能是不同地区的气象条件和地形等因素造成的。
图5为细、粗和巨粒子中25种金属元素的年平均干沉降量。细粒子中25种金属元素干沉降量变化范围为5.2~231.3 mg∙m-2∙a-1, 粗粒子中为8.4~354.9 mg∙m-2∙a-1, 巨粒子中为66.0~2 596.9 mg∙m-2∙a-1。巨粒子中金属元素的干沉降量在总沉降中的占比最大, 显著高于细粒子和粗粒子。除Cd、Tl和Pb外, 巨粒子中金属元素干沉降量占总沉降量的52%~88%(图6)。虽然巨粒子中金属元素浓度所占的比例较低(<22%), 但由于巨粒子的沉降速率明显高于细粒子和粗粒子, 因此沉降量较高[30]。
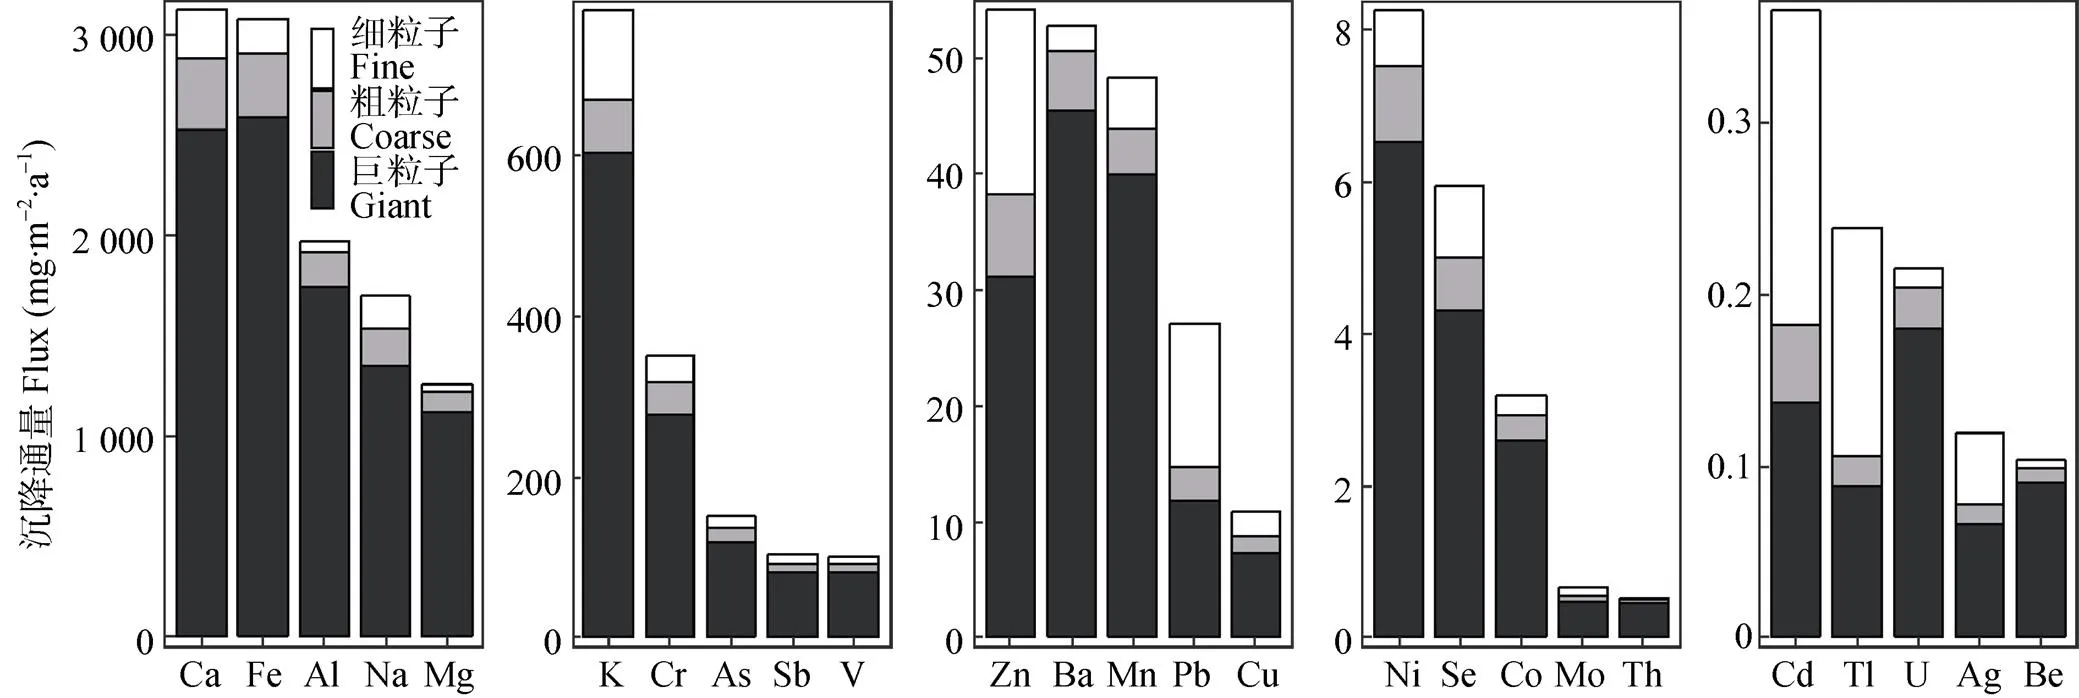
图5 研究区大气细、粗和巨粒子中金属元素年平均干沉降通量
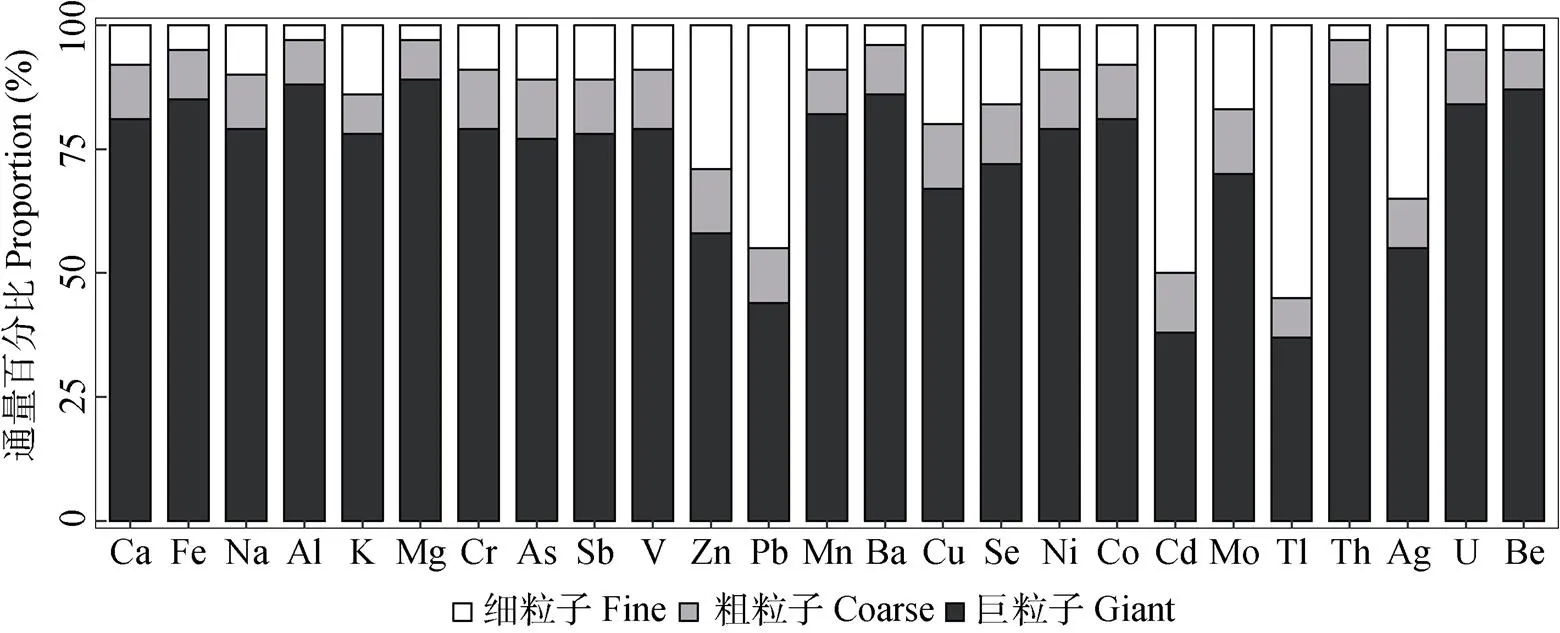
图6 研究区大气细、粗和巨粒子中金属通量在其总通量中的占比
25种金属元素的沉降量排序与其浓度变化基本一致。Ca的沉降量最高, 为3 116.5 mg∙m-2∙a-1。Cr是沉降量最高的重金属, 为350.7 mg∙m-2∙a-1。虽然Na的总质量浓度高于Al, 但Na的总沉降量低于Al, 这主要是因为巨粒子具有更高的沉降速率(Al在巨粒子中的质量浓度为781.8 ng∙m-3, Na为604.1 ng∙m-3)。同样, Mg的沉降量大于K, Ba的总沉降量大于Pb, Ni元素的总沉降量大于Se, Th元素的总沉降量大于Cd。
本研究测算的金属元素沉降量处于以前研究报道的范围内(图7)。例如, Fe的沉降量(3 084.6 mg∙m-2∙a-1)在文献观测范围的偏高位置(14.1~4 413.0 mg∙m-2∙a-1)[31-32], Pb的沉降量(26.2 mg∙m-2∙a-1)在文献观测范围的偏低位置(0.9~80.3 mg∙m-2∙a-1)[28,32], Mn的沉降量(48.1 mg∙m-2∙a-1)在文献观测范围的中间(1.0~62.0 mg∙m-2∙a-1)[28,33]。但Cr和V沉降量(350.7 mg∙m-2∙a-1和102.3 mg∙m-2∙a-1)高于文献中的观测结果(0.3~22.3 mg∙m-2∙a-1和2.2~31.0 mg∙m-2∙a-1)[28,33-34]。
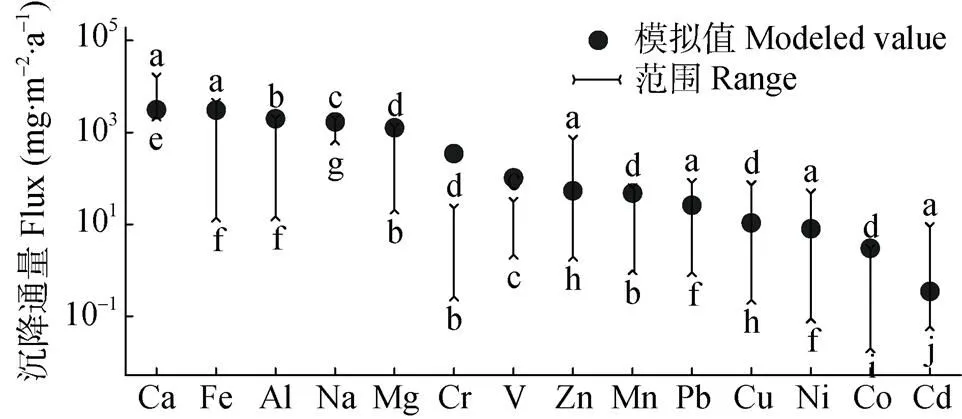
图7 本文计算的干沉降通量值与其他地区通量值范围的比较
观测值来源于文献, 其中: a代表文献[31]; b代表文献[33]; c代表文献[34]; d代表文献[28]; e代表文献[27]; f代表文献[32]; g代表文献[35]; h代表文献[36]; i代表文献[37]; j代表文献[38]。Observed values are derived from literatures,where: “a” stands for the literature [31]; “b” stands for the literature [33]; “c” stands for the literature [34]; “d” stands for the literature [28]; “e” stands for the literature [27]; “f” stands for the literature [32]; “g” stands for the literature [35]; “h” stands for the literature [36]; “i” stands for the literature [37]; “j” stands for the literature [38].
2.4 富集因子分析
为进一步分析自然源和人为源对不同粒径颗粒物中金属元素质量浓度的影响, 评估了金属元素在细、粗和巨粒子中的富集因子(EF)。Al通常被作为地壳的指示元素来区分自然源和人为源, 通过公式(7)来计算金属元素的富集因子[39]:

式中: Celement和CAl分别为某元素和Al在大气颗粒物和地壳中的浓度[40]。图8为计算的细、粗和巨粒子中25种金属元素EF值, 其变化范围从1(Al)到78 913(Sb)。通常, EF在0.1~10表明金属元素主要来自于土壤、沙尘或者岩石等自然源; 更高的EF表明金属元素可能来自于人为源, EF在10~500表明金属元素中等富集, EF>500表明金属元素较强富集[41-42]。基于上述判断, Al、Mg、Be、Th、Fe、K、Mn、Ba、Na、Ca和U主要来自于自然源, 其在细、粗和巨粒子中的EF值都低于10; As、Se和Sb主要来自于人为源, 其在细、粗和巨粒子中的EF值都高于500。其余元素在细、粗和巨粒子中具有不同的富集程度。例如Cu和Tl在细粒子中表现为中等富集, 其EF值分别为57和375, 主要来自于人为源; 但它们在巨粒子中的EF值都低于10, 可能更多来地自于自然源。
总的来看, 细粒子中金属元素的EF值(EF细)比粗粒子中的EF值(EF粗)和巨粒子中的EF值(EF巨)高。除Mg和Th外, 其余金属元素的EF细/EF粗和EF细/EF巨都大于1, 表明它们在细粒子中更易富集, 特别是重金属。例如, Pb和Tl, 其EF细/EF粗分别为13和22, EF细/EF巨分别为34和49。这与以往在我国北方城市的研究结果一致[17]。
2.5 PMF源解析
为进一步量化不同源对巨、粗和细粒子中金属元素的相对贡献, 使用PMF 5.0(美国EPA)开展了大气金属的来源解析[43]。图9为PMF模型源解析结果, 5个因子被确定为大气金属元素的可能来源。因子1以高占比的地壳类元素(Mg、Al、Th等)和Mn、Ba为特征, 表明其可能与道路扬尘源相关[44]; 因子2以高占比的V、Cr、As、Sb元素为特征, 这些重金属与工业过程紧密相关[45], 表明其可能为工业源; 因子3以高占比的地壳元素Ca、Be和Co为特征, 表明其可能为矿尘源[46]; 因子4以高占比的Na、Fe、As和Se为特征, 这些元素与煤炭燃烧密切相关[47], 表明其可能为燃煤源; 因子5以高占比的K、Zn、Cd、Tl和Pb为特征, K、Zn和Pb与机动车尾气排放密切相关[48], 表明其可能为机动车源。
图10汇总了不同源对巨、粗和细粒子中金属元素的相对贡献。可以看到, 矿尘源在巨粒子和细粒子中的占比最高, 分别为62.0%和42.5%, 并且其贡献随着粒径减小而明显的下降, 在细粒子中的占比仅为3.9%。燃煤和机动车源在细粒子中的占比较高, 分别为39.5%和16.9%, 明显高于其在粗粒子和巨粒子中的占比, 且其占比随着粒径增大而出现明显的下降。道路扬尘源在巨、粗和细粒子中都有较高的占比, 分别为28.4%、21.2%和15.7%, 这可能与道路扬尘源为地壳源和人为源的混合属性相关。
3 讨论与结论
我国土壤普查显示耕地重金属的点位超标率为20%, 但来源不清。华北大气污染严重, 但污染物的去向不明。本文尝试结合观测实验和数值模型探讨大气中金属元素的粒径分布和干沉降量, 评估大气沉降对农田重金属污染的输入量和来源。研究发现, 河北典型农业区大气中金属元素的粒径分布有明显的差异。大多数重金属(如: Zn、Cd和Pb等)主要富集在细粒径段, 而地壳源的金属元素(如: Al、Fe和Th等)主要富集在粗粒径段。以往在北京城区的研究表明, 大气重金属所富集的粒径会在重污染时段出现粒径转移的现象[25-26], 同样的现象在香河农田观测站点也得到验证。这一观测事实表明区域尺度内的大气污染物传输对农田环境质量存在潜在影响。
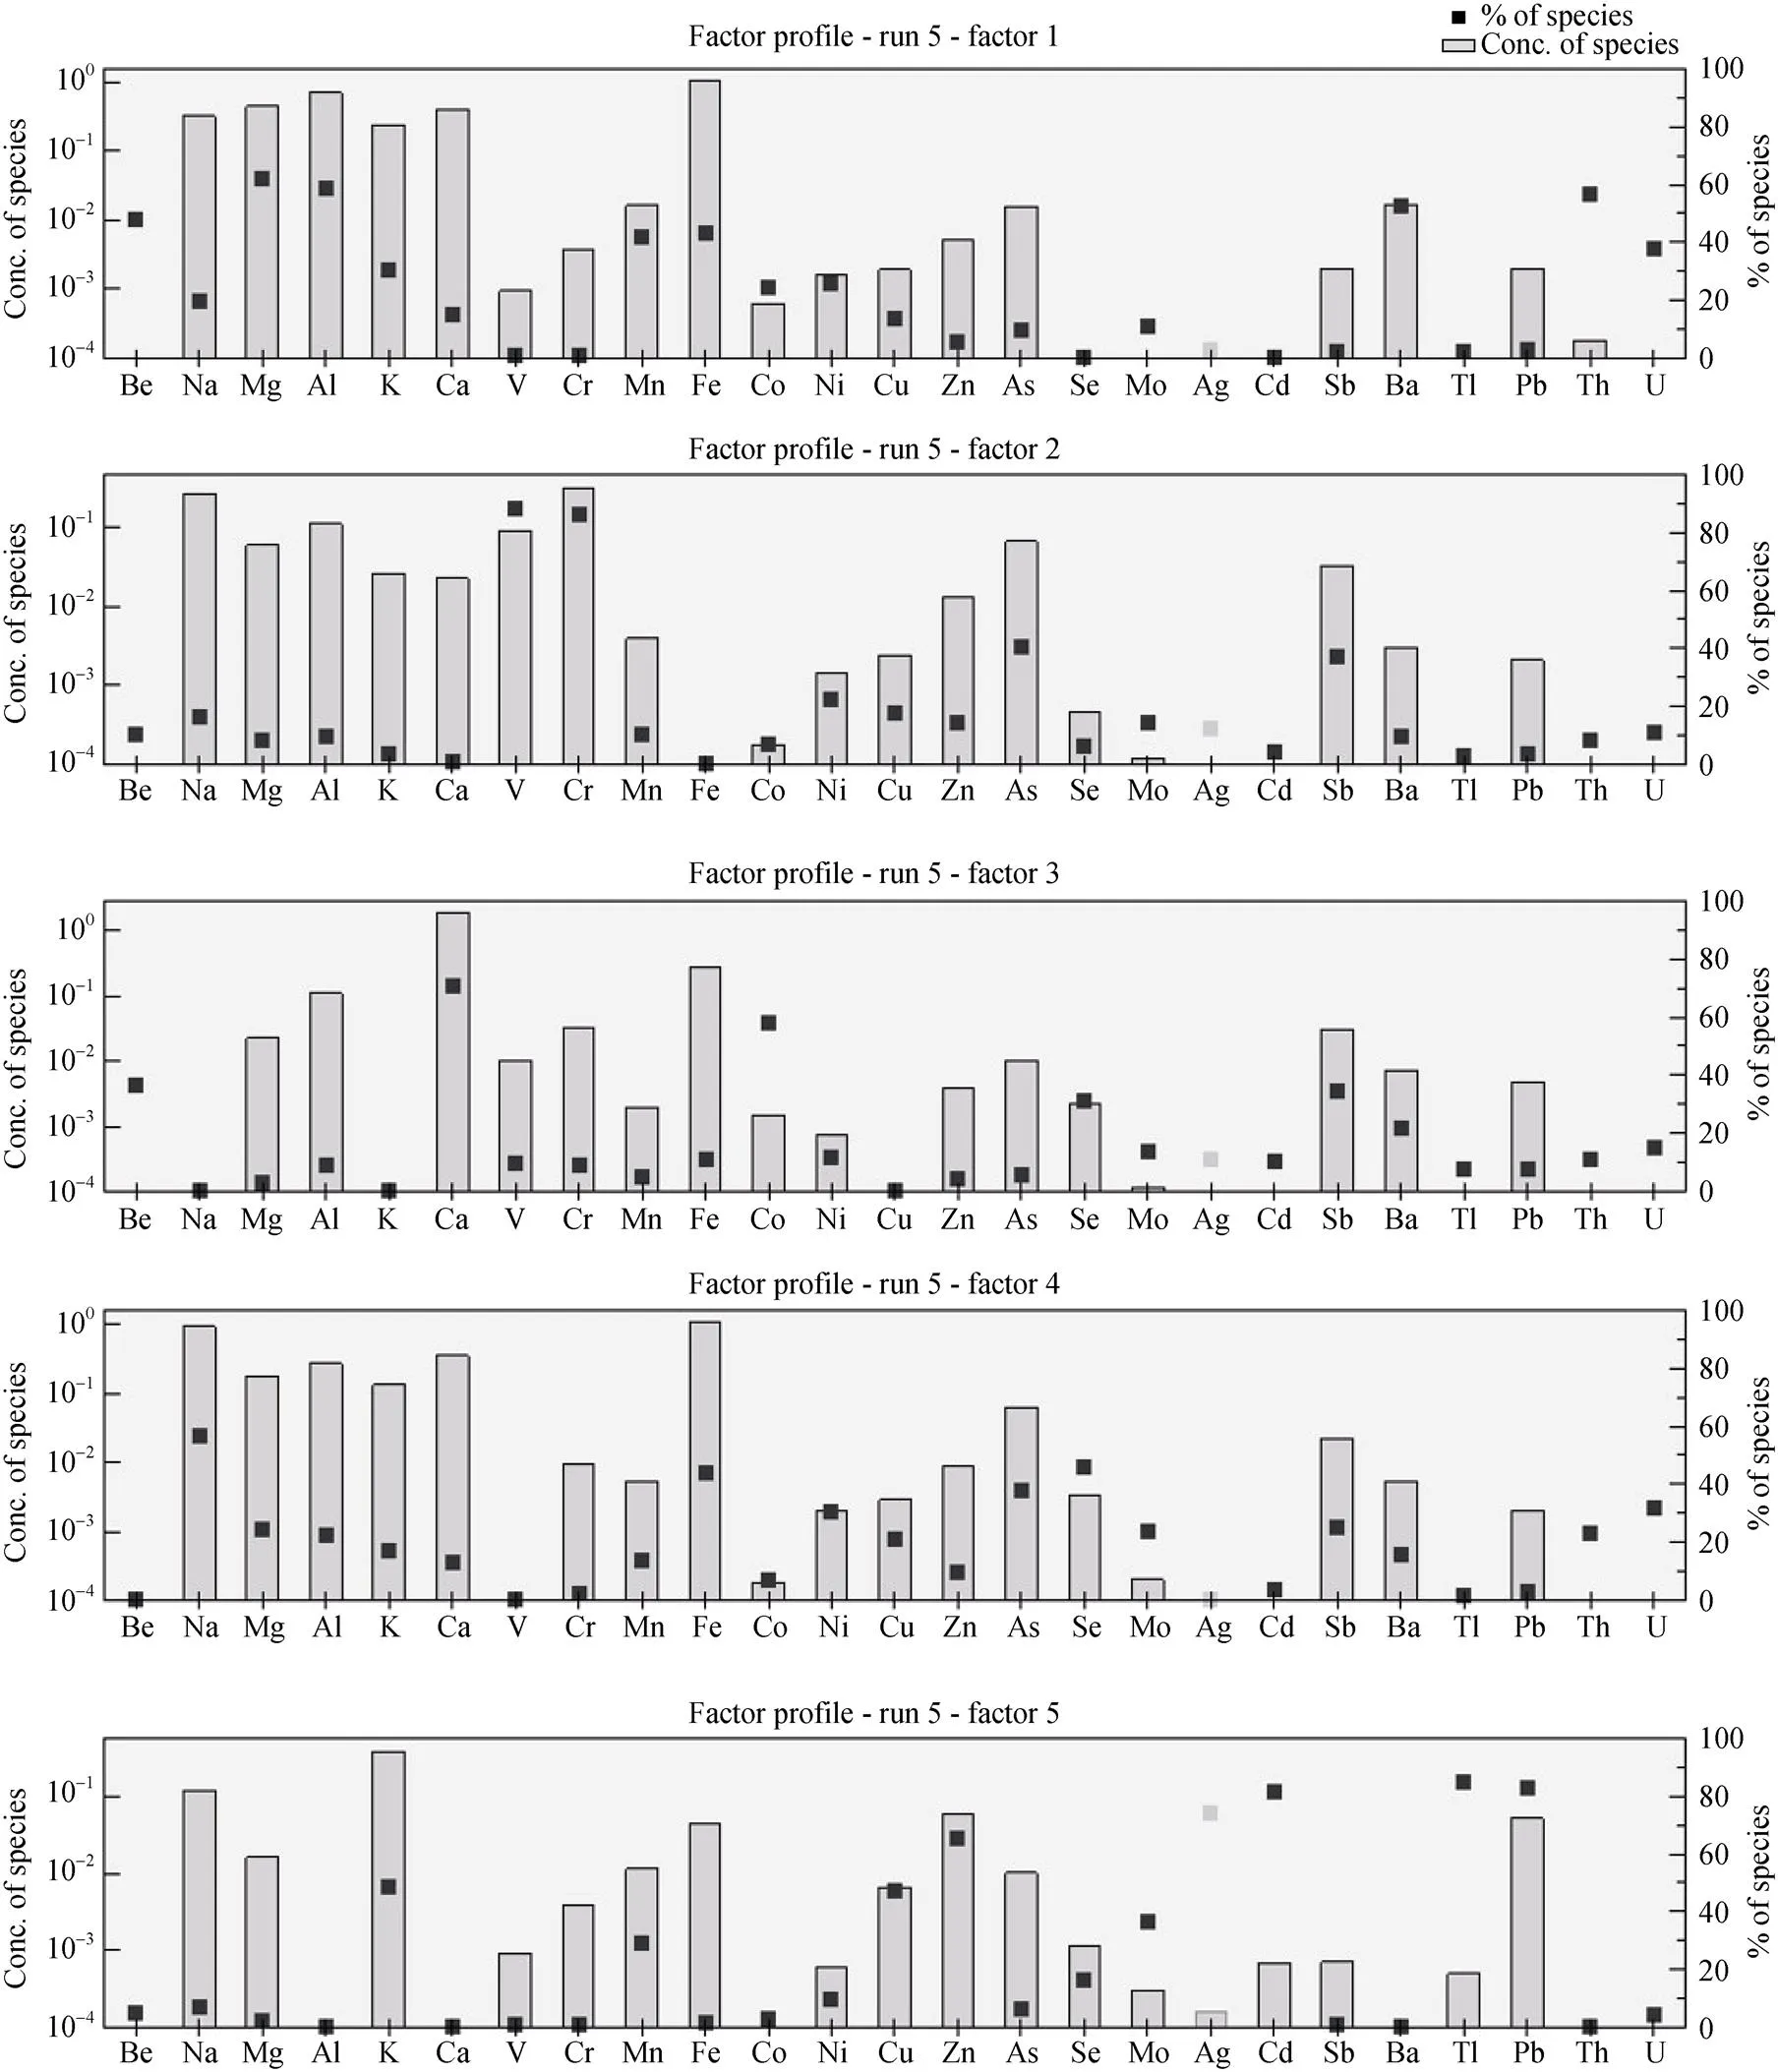
图9 研究区大气颗粒物中不同金属元素PMF源解析结果
通过计算不同粒径段颗粒物的金属干沉降, 显著改善了以往单一粒径段颗粒物估算大气金属干沉降量的技术缺陷[9]。本研究基于观测和模拟计算的金属元素干沉降量与国内外以往观测范围一致[31-38], 充分表明分粒径模拟的干沉降速率达到了预期结果; 个别元素(如: Cr和V)沉降速率与以往观测结果存在差异, 可能是由研究区域的空间异质性所引起的[17]。本文估算25种金属元素在细、粗和巨粒子中的干沉降量分别为5.6~ 231.3 mg∙m-2∙a-1、8.4~ 354.9 mg∙m-2∙a-1和66.0~2 596.9 mg∙m-2∙a-1, 这些基础数据可以作为评估该区域大气中金属沉降量的参考范围。
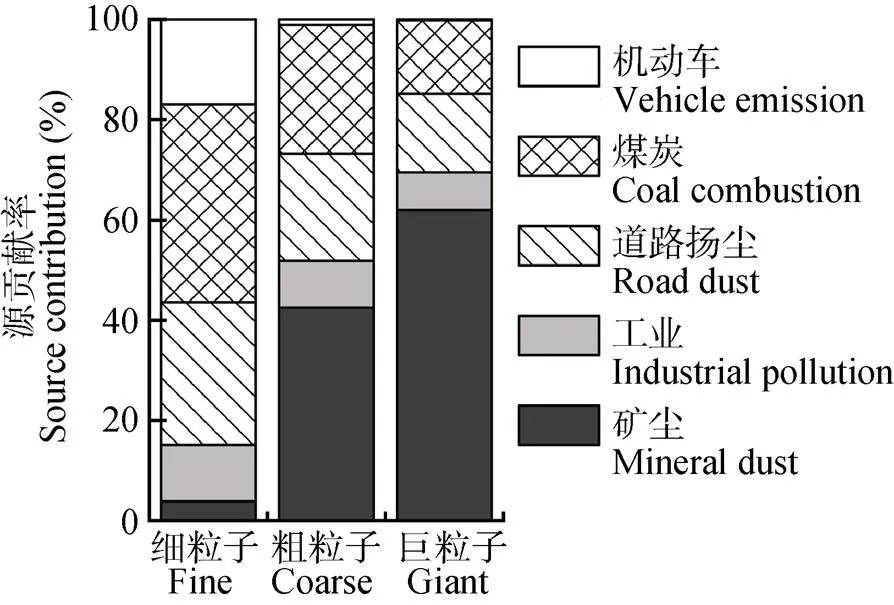
图10 研究区不同源在大气细、粗、巨粒子中金属元素的相对贡献
本研究发现, 农田区域大气颗粒物中多数重金属都有不同程度的富集, 其中As、Se和Sb等富集程度较高, 风险较大, 它们主要来自于人为源。不同粒径的金属元素EF值依次为EF细>EF粗>EF巨。对同一种元素而言, 富集程度越高, 它们在细、粗、巨粒子中的EF值差别越大。进一步的PMF源解析分析发现, 道路扬尘、工业、矿尘、燃煤和机动车排放为该农业区大气金属元素的主要来源。矿尘源在巨粒子中的贡献最高, 燃煤、机动车和工业等人为源在细粒子中的贡献明显高于它们在粗粒子和巨粒子中的贡献, 这表明细粒子受到人为活动影响更大。
综上所述, 本研究基于外场观测、试验分析和数值模拟, 分粒径测算了大气中金属元素的干沉降量, 弥补了区域内农田大气重金属干沉降输入量长期缺测的研究空白, 为研究农田重金属的输入和输出规律提供了基础数据。同时, 本研究确定了该农业区大气金属元素的主要来源, 发现人为污染物的排放对干沉降中重金属贡献较大, 这也是未来农田土壤重金属防治工作亟需考虑的减排方向。
[1] LI Z Y, MA Z W, VAN DER KUIJP T J, et al. A review of soil heavy metal pollution from mines in China: Pollution and health risk assessment[J]. Science of the Total Environment, 2014, 468/469: 843–853
[2] NAGAJYOTI P C, LEE K D, SREEKANTH T V M. Heavy metals, occurrence and toxicity for plants: A review[J]. Environmental Chemistry Letters, 2010, 8(3): 199–216
[3] NICHOLSON F A, SMITH S R, ALLOWAY B J, et al. An inventory of heavy metals inputs to agricultural soils in England and Wales[J]. Science of the Total Environment, 2003, 311(1/3): 205–219
[4] TÓTH G, HERMANN T, DA SILVA M R, et al. Heavy metals in agricultural soils of the European Union with implications for food safety[J]. Environment International, 2016, 88: 299–309
[5] XIA X Q, YANG Z F, CUI Y J, et al. Soil heavy metal concentrations and their typical input and output fluxes on the southern Song-nen Plain, Heilongjiang Province, China[J]. Journal of Geochemical Exploration, 2014, 139: 85–96
[6] PAN Y P, WANG Y S. Atmospheric wet and dry deposition of trace elements at 10 sites in northern China[J]. Atmospheric Chemistry and Physics, 2015, 15(2): 951–972
[7] ZHU J X, WANG Q F, YU H L, et al. Heavy metal deposition through rainfall in Chinese natural terrestrial ecosystems: Evidences from national-scale network monitoring[J]. Chemosphere, 2016, 164: 128–133
[8] MOHAN S M. An overview of particulate dry deposition: Measuring methods, deposition velocity and controlling factors[J]. International Journal of Environmental Science and Technology, 2016, 13(1): 387–402
[9] ZHANG L M, GONG S L, PADRO J, et al. A size-segregated particle dry deposition scheme for an atmospheric aerosol module[J]. Atmospheric Environment, 2001, 35(3): 549–560
[10] MIJIĆ Z, STOJIĆ A, PERIŠIĆ M, et al. Seasonal variability and source apportionment of metals in the atmospheric deposition in Belgrade[J]. Atmospheric Environment, 2010, 44(30): 3630–3637
[11] LUO X S, IP C C M, LI W, et al. Spatial-temporal variations, sources, and transport of airborne inhalable metals (PM10) in urban and rural areas of northern China[J]. Atmospheric Chemistry and Physics Discussions, 2014, 14(9): 13133–13165
[12] AMIL N, LATIF M T, KHAN M F, et al. Seasonal variability of PM2.5composition and sources in the Klang Valley urban-industrial environment[J]. Atmospheric Chemistry and Physics, 2016, 16(8): 5357–5381
[13] COMERO S, VACCARO S, LOCORO G, et al. Characterization of the Danube River sediments using the PMF multivariate approach[J]. Chemosphere, 2014, 95: 329–335
[14] KUMAR A, ATTRI A K. Biomass combustion a dominant source of carbonaceous aerosols in the ambient environment of western Himalayas[J]. Aerosol and Air Quality Research, 2016, 16(3): 519–529
[15] 张志刚, 高庆先, 韩雪琴, 等. 中国华北区域城市间污染物输送研究[J]. 环境科学研究, 2004, 17(1): 14–20 ZHANG Z G, GAO Q X, HAN X Q, et al. The study of pollutant transport between the cities in North China[J]. Research of Environmental Sciences, 2004, 17(1): 14–20
[16] 潘月鹏, 王跃思, 胡波, 等. 北京奥运时段河北香河大气污染观测研究[J]. 环境科学, 2010, 31(1): 1–9 PAN Y P, WANG Y S, HU B, et al. Observation on atmospheric pollution in Xianghe during Beijing 2008 Olympic games[J]. Environmental Science, 2010, 31(1): 1–9
[17] PAN Y P, WANG Y S, SUN Y, et al. Size-resolved aerosol trace elements at a rural mountainous site in northern China: Importance of regional transport[J]. Science of the Total Environment, 2013, 461/462: 761–771
[18] ZHANG L, HE Z. Technical note: An empirical algorithm estimating dry deposition velocity of fine, coarse and giant particles[J]. Atmospheric Chemistry and Physics, 2014, 14(7): 3729–3737
[19] SUN Z Q, MU Y J, LIU Y J, et al. A comparison study on airborne particles during haze days and non-haze days in Beijing[J]. Science of the Total Environment, 2013, 456/457: 1–8
[20] ALLEN A G, NEMITZ E, SHI J P, et al. Size distributions of trace metals in atmospheric aerosols in the United Kingdom[J]. Atmospheric Environment, 2001, 35(27): 4581–4591
[21] GAO J J, TIAN H Z, CHENG K, et al. Seasonal and spatial variation of trace elements in multi-size airborne particulate matters of Beijing, China: Mass concentration, enrichment characteristics, source apportionment, chemical speciation and bioavailability[J]. Atmospheric Environment, 2014, 99: 257–265
[22] HIEU N T, LEE B K. Characteristics of particulate matter and metals in the ambient air from a residential area in the largest industrial city in Korea[J]. Atmospheric Research, 2010, 98(2/4): 526–537
[23] DUAN F K, LIU X D, YU T, et al. Identification and estimate of biomass burning contribution to the urban aerosol organic carbon concentrations in Beijing[J]. Atmospheric Environment, 2004, 38(9): 1275–1282
[24] TIAN S L, PAN Y P, LIU Z R, et al. Size-resolved aerosol chemical analysis of extreme haze pollution events during early 2013 in urban Beijing, China[J]. Journal of Hazardous Materials, 2014, 279: 452–460
[25] TAN J H, DUAN J C, ZHEN N J, et al. Chemical characteristics and source of size-fractionated atmospheric particle in haze episode in Beijing[J]. Atmospheric Research, 2016, 167: 24–33
[26] SUN Y L, WANG Z F, FU P Q, et al. Aerosol composition, sources and processes during wintertime in Beijing, China[J]. Atmospheric Chemistry and Physics, 2013, 13(9): 4577–4592
[27] YI S M, SHAHIN U, SIVADECHATHEP J, et al. Overall elemental dry deposition velocities measured around Lake Michigan[J]. Atmospheric Environment, 2001, 35(6): 1133–1140
[28] TASDEMIR Y, KURAL C. Atmospheric dry deposition fluxes of trace elements measured in Bursa, Turkey[J]. Environmental Pollution, 2005, 138(3): 462–472
[29] ZHANG L, FANG G C, LIU C K, et al. Dry deposition fluxes and deposition velocities of seven trace metal species at five sites in central Taiwan —A summary of surrogate surface measurements and a comparison with model estimations[J]. Atmospheric Chemistry and Physics, 2012, 12(7): 3405–3417
[30] FANG G C, ZHANG L, HUANG C S. Measurements of size-fractionated concentration and bulk dry deposition of atmospheric particulate bound mercury[J]. Atmospheric Environment, 2012, 61: 371–377
[31] ODABASI M, MUEZZINOGLU A, BOZLAKER A. Ambient concentrations and dry deposition fluxes of trace elements in Izmir, Turkey[J]. Atmospheric Environment, 2002, 36(38): 5841–5851
[32] HSU S C, WONG G T F, GONG G C, et al. Sources, solubility, and dry deposition of aerosol trace elements over the East China Sea[J]. Marine Chemistry, 2010, 120(1/4): 116–127
[33] YI S M, LEE E Y, HOLSEN T M. Dry deposition fluxes and size distributions of heavy metals in Seoul, Korea during yellow-sand events[J]. Aerosol Science and Technology, 2001, 35(1): 569–576
[34] 潘月鹏, 王跃思, 杨勇杰, 等. 区域大气颗粒物干沉降采集及金属元素分析方法[J]. 环境科学, 2010, 31(3): 553–559 PAN Y P, WANG Y S, YANG Y J, et al. Determination of trace metals in atmospheric dry deposition with a heavy matrix of PUF by inductively coupled plasma mass spectroscopy after microwave digestion[J]. Environmental Science, 2010, 31(3): 553–559
[35] ZHENG M, GUO Z G, FANG M, et al. Dry and wet deposition of elements in Hong Kong[J]. Marine Chemistry, 2005, 97(1/2): 124–139
[36] HERUT B, NIMMO M, MEDWAY A, et al. Dry atmospheric inputs of trace metals at the Mediterranean coast of Israel (SE Mediterranean): Sources and fluxes[J]. Atmospheric Environment, 2001, 35(4): 803–813
[37] CHESTER R, NIMMO M, PRESTON M R. The trace metal chemistry of atmospheric dry deposition samples collected at Cap Ferrat: A coastal site in the Western Mediterranean[J]. Marine Chemistry, 1999, 68(1/2): 15–30
[38] SAKATA M, ASAKURA K. Atmospheric dry deposition of trace elements at a site on Asian-continent side of Japan[J]. Atmospheric Environment, 2011, 45(5): 1075–1083
[39] DUCE R A, HOFFMAN G L, ZOLLER W H. Atmospheric trace metals at remote northern and southern hemisphere sites: Pollution or natural?[J]. Science, 1975, 187(4171): 59–61
[40] MASON B, MOORE C B. Principles of Geochemistry[M]. 2nd ed. New York: Wiley, 1982
[41] PEARSON C, HOWARD D, MOORE C, et al. Mercury and trace metal wet deposition across five stations in Alaska: Controlling factors, spatial patterns, and source regions[J]. Atmospheric Chemistry and Physics Discussions, 2018, 2018: 1–28
[42] CARLING G T, FERNANDEZ D P, JOHNSON W P. Dust-mediated loading of trace and major elements to Wasatch Mountain snowpack[J]. Science of the Total Environment, 2012, 432: 65–77
[43] U.S. Environmental Protection Agency Office of Research and Development. EPA positive matrix factorization (PMF) 5.0 fundamentals and user guide[EB/OL]. United States Environmental Protection Agency. [2015-02-01]. https://www. epa.gov/sites/production/files/2015-02/documents/pmf_5.0_user_guide.pdf
[44] LI J W, CHEN B, DE LA CAMPA A M S, et al. 2005–2014 trends of PM10 source contributions in an industrialized area of southern Spain[J]. Environmental Pollution, 2018, 236: 570–579
[45] YANG L X, CHENG S H, WANG X F, et al. Source identification and health impact of PM2.5in a heavily polluted urban atmosphere in China[J]. Atmospheric Environment, 2013, 75: 265–269
[46] TIAN S L, PAN Y P, WANG Y S. Size-resolved source apportionment of particulate matter in urban Beijing during haze and non-haze episodes[J]. Atmospheric Chemistry and Physics, 2016, 16(1): 1–19
[47] FERNÁNDEZ J A, EDERRA A, NÚÑEZ E, et al. Biomonitoring of metal deposition in northern Spain by moss analysis[J]. Science of the Total Environment, 2002, 300(1/3): 115–127
[48] HU S H, MCDONALD R, MARTUZEVICIUS D, et al. UNMIX modeling of ambient PM2.5near an interstate highway in Cincinnati, OH, USA[J]. Atmospheric Environment, 2006, 40(S2): 378–395
Dry deposition flux of atmospheric heavy metals and its source apportionment in a typical farmland of Hebei Province*
ZHANG Guozhong1,2, HUANG Wei2, PAN Yuepeng2, GU Mengna2, LYU Xuemei2, NI Xue2,HE Yuexin2, LIU Bowen2, WANG Yuesi1,2**, TIAN Shili2**
(1. College of Forestry, Gansu Agricultural University, Lanzhou 730070, China; 2. State Key Laboratory of Atmospheric Boundary Layer Physics and Atmospheric Chemistry / Institute of Atmospheric Physics, Chinese Academy of Sciences, Beijing 100029, China)
Atmospheric deposition is a major contributor of heavy metals contaminating the farmland, which endangers the quality of soil as well as agricultural products. Because of the paucity of relevant observational data, the dry deposition flux and sources of atmospheric heavy metals in agricultural areas have for long remained unclear. Based on a year of field observation in a typical farmland in Hebei Province, we measured the content of 25 elements in nine size-segregated particles. The dry deposition flux of atmospheric metal elements was estimated by employing resistance modeling. In addition, the sources of atmospheric metal elements were apportioned using the PMF model. The results indicated that there were large differences in the concentrations of 25 metals between the fine particles (P≤ 2.1 μm, aerodynamic diameter, the same below), coarse particles (2.1
Farmland; Atmospheric dry deposition; Heavy metals; Source apportionment; Pollution control
X592
2096-6237(2019)08-1245-10

10.13930/j.cnki.cjea.190092
* 国家重点研发计划项目(2016YFD0800302, 2016YFC0201802)资助
王跃思, 主要研究方向为大气化学与环境, E-mail: wys@dq.cern.ac.cn; 田世丽, 主要研究方向为大气化学, E-mail: tianshili@mail.iap.ac.cn
张国忠, 主要研究方向为大气沉降、生态与环境。E-mail: zhangguozhong@dq.cern.ac.cn
2019-02-01
2019-03-27
* This study was supported by the National Key Research and Development Program of China (2016YFD0800302, 2016YFC0201802).
WANG Yuesi, E-mail: wys@dq.cern.ac.cn; TIAN Shili, E-mail: tianshili@mail.iap.ac.cn
Feb. 1, 2019;
Mar. 27, 2019
张国忠, 黄威, 潘月鹏, 顾梦娜, 吕雪梅, 倪雪, 何月欣, 刘博文, 王跃思, 田世丽. 河北典型农田大气重金属干沉降通量及来源解析[J]. 中国生态农业学报(中英文), 2019, 27(8): 1245-1254
ZHANG G Z, HUANG W, PAN Y P, GU M N, LYU X M, NI X, HE Y X, LIU B W, WANG Y S, TIAN S L. Dry deposition flux of atmospheric heavy metals and its source apportionment in a typical farmland of Hebei Province[J]. Chinese Journal of Eco-Agriculture, 2019, 27(8): 1245-1254
