MicroRNA expression in the hippocampal CA1 region under deep hypothermic circulatory arrest
2019-07-18XiaoHuaWangDongXuYaoXiuShuLuanYuWangHaiXiaLiuBeiLiuYangLiuLeiZhaoXunMingJiTianLongWang
Xiao-Hua Wang , Dong-Xu Yao Xiu-Shu Luan Yu Wang Hai-Xia Liu Bei Liu Yang Liu Lei Zhao Xun-Ming Ji , Tian-Long Wang
1 Department of Anesthesiology, Xuanwu Hospital, Capital Medical University, Beijing, China
2 Institute of Geriatrics, Beijing, China
3 National Clinical Research Center for Geriatric Disorders, Beijing, China
4 Department of Neurosurgery, Xuanwu Hospital, Capital Medical University, Beijing, China
5 Cerebrovascular Research Center, Xuanwu Hospital, Capital Medical University, Beijing, China
Abstract Using deep hypothermic circulatory arrest, thoracic aorta diseases and complex heart diseases can be subjected to corrective procedures.However, mechanisms underlying brain protection during deep hypothermic circulatory arrest are unclear. After piglet models underwent 60 minutes of deep hypothermic circulatory arrest at 14°C, expression of microRNAs (miRNAs) was analyzed in the hippocampus by microarray. Subsequently, TargetScan 6.2, RNA22 v2.0, miRWalk 2.0, and miRanda were used to predict potential targets, and gene ontology enrichment analysis was carried out to identify functional pathways involved. Quantitative reverse transcription-polymerase chain reaction was conducted to verify miRNA changes. Deep hypothermic circulatory arrest altered the expression of 35 miRNAs. Twenty-two miRNAs were significantly downregulated and thirteen miRNAs were significantly upregulated in the hippocampus after deep hypothermic circulatory arrest. Six out of eight targets among the differentially expressed miRNAs were enriched for neuronal projection (cyclin dependent kinase, CDK16 and SLC1A2), central nervous system development (FOXO3, TYRO3, and SLC1A2), ion transmembrane transporter activity(ATP2B2 and SLC1A2), and interleukin-6 receptor binding (IL6R) - these are the key functional pathways involved in cerebral protection during deep hypothermic circulatory arrest. Quantitative reverse transcription-polymerase chain reaction confirmed the results of microarray analysis. Our experimental results illustrate a new role for transcriptional regulation in deep hypothermic circulatory arrest, and provide significant insight for the development of miRNAs to treat brain injuries. All procedures were approved by the Animal Care Committee of Xuanwu Hospital, Capital Medical University, China on March 1, 2017 (approval No. XW-INI-AD2017-0112).
Key Words: nerve regeneration; cerebral protection; deep hypothermic circulatory arrest; gene ontology enrichment analysis; microRNA;hippocampus; post-transcriptional expression; microarray; bioinformatics; neural regeneration
Graphical Abstract
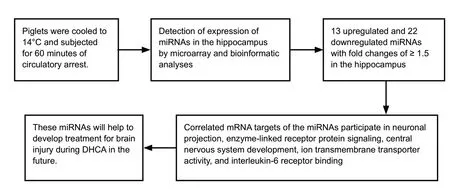
Novel role of microRNA (miRNA) in the regulation of transcription during deep hypothermic circulatory arrest (DHCA) detected by microarray and bioinformatic analyses
Introduction
During the past 60 years, deep hypothermic circulatory arrest (DHCA) with cardiopulmonary bypass has been used during surgeries involving thoracoabdominal aorta, complex congenital heart, aortic arch, or cerebral vasculature (Amir et al., 2005; McKenzie et al., 2005; Stier and Verde, 2007).Circulatory arrest provides a bloodless field and good view,while deep hypothermia is used to prolong the tolerated duration of circulatory arrest (Amir et al., 2005; McKenzie et al., 2005). Recently, gene expression in the hippocampus after DHCA has been shown to play a critical role in the pathogenesis of neurological protection (Allen et al.,2010). Compared with other neuroprotective mechanisms of DHCA, information regarding the post-transcriptional regulation of microRNAs (miRNAs) during DHCA-induced cerebral injury is limited.
miRNAs are endogenous, small, noncoding RNAs. As a result of their size, tissue specificity, and inherent molecular stability, miRNAs have become attractive substrates to detect, track, predict, and even treat diseases (John et al., 2004;Martinez and Peplow, 2017). Indeed, miRNAs have been implicated in cerebral infarction (Amir et al., 2005), stroke (Tan et al., 2009), and traumatic brain injury (Laterza et al., 2009;Redell et al., 2010; Hu et al., 2012). Additionally, studies have suggested that ischemic stroke, brain hemorrhage, and kainate-induced seizures elicit common and unique miRNA expression profiles in the hippocampi of injured brains (Liu et al., 2010). Moreover, this unique expression of miRNAs might regulate the expression of proteins after different neurologic diseases (Lu et al., 2005; Guarnieri and DiLeone,2008).
In the present study, we aimed to explore specific changes in miRNA expression at the post-transcriptional level in the hippocampal CA1 region after circulatory arrest under deep hypothermia protection conditions.
Materials and Methods Animal preparation for DHCA
All animal procedures were performed in strict accordance with the National Institutes of Health Guide for the Care and Use of Laboratory Animals, and were approved by the local Animal Care Committee on March 1, 2017 (approval No.XW-INI-AD2017-0112). Neonatal piglets were purchased from Beijing Vital River Laboratory Animal Technology Co.,Ltd., which is affiliated to Charles River Laboratories, Beijing,China (license No. SCXK2010-0016). Piglets were housed at the Capital Medicine University Animal Care Facilities in compliance with legal and ethical international guidelines for animal care. Piglets aged 7-8 days and weighing 2.0-2.5 kg were intramuscularly injected with ketamine (25 mg/kg), and then intubated and ventilated. The anesthetic condition was maintained with ketamine and diazepam during cardiopulmonary bypass or DHCA. Experimental piglets were placed on a cooling/warming blanket. An arterial catheter was inserted into the right femoral artery, while a central venous catheter was inserted in the right femoral vein. Temperature probes were positioned in the nasopharynx and rectum.DHCA piglets (n = 3) were cooled to 14°C (nasopharyngeal temperature) and subjected to 60 minutes of circulatory arrest at this temperature before rewarming. Subsequently, perfusion was re-established and the piglets were rewarmed to 37°C. After the start of rewarming, piglets were weaned from the bypass (Chen et al., 2012; Pastuszko et al., 2014; Liang et al., 2016). The control group (n = 3) had continuous bypass flow. All piglets were maintained on anesthesia until they were sacrificed 1 hour after cardiopulmonary bypass. The manipulation procedure is shown in Figure 1.
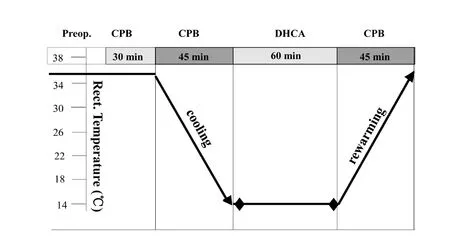
Figure 1 Manipulation procedure for deep hypothermic circulatory arrest (DHCA) with cardiopulmonary bypass (CPB).min: Minutes; Preop.: pre-operation.
Hippocampal harvest and total RNA extraction
Piglets were sacrificed by over-dosage of pentobarbital anesthesia. The hippocampal CA1 region was dissected as quickly as possible, frozen, and stored at -80°C until further analysis. The hippocampal CA1 region was chosen because it can reflect memory function and is vulnerable to injury. Total RNA (plus miRNA) was isolated from hippocampi using an Ambion mirVanaTMmiRNA Isolation kit (Cat #AM 1560;Ambion, Carlsbad, CA, USA). Concentration and purity of total RNA were determined by the ratio of absorbances at 260 and 280 nm using a ND-1000 spectrophotometer(NanoDrop, ND-1000; Thermo Scientific, Wilmington, DE,USA). RNA integrity was evaluated by denaturing agarose gel electrophoresis and nucleic acid staining. RNA samples were stored at -80°C for miRNA microarray and quantitative reverse transcription-polymerase chain reaction (qRTPCR) analyses.
Microarray scan analysis
To determine the expression of miRNAs in the hippocampi of DHCA piglets, an Affymetrix GeneChip miRNA 2.0 array(Affymetrix, Santa Clara, CA, USA) was used. The microarray cohort of subjects included three DHCA-treated piglets and three cardiopulmonary bypass-treated piglets. The Affymetrix GeneChip®miRNA Array service was supplied by Capitalbio Corporation, which is certified by Affymetrix.The content was derived from the Sanger miRBase: miRNA database v11.0 (http://microrna.sanger.ac.uk; cited on April 15, 2008). Microarray probes included 1105 human, 389 rat,772 mouse, and 189 mature pig miRNAs from the miRNA registry. Total RNA (µg) was labeled using a Biotin FlashTag Biotin Labeling Kit (Genisphere, Hatfield, PA, USA). Hybridization was performed using a Hybridization Oven 640(Affymetrix) at 48°C for 16 hours at 60 r/min. The array was then stained with a Fluidics Station 450 using the fluidics script FS450_0003 (GeneChip®Fluidics Station 450; Affymetrix). Fluorescence scanning was carried out using a Scanner 3000 7G (GeneChip®System GCS3000; Affymetrix). Expression of miRNAs was analyzed following a pipeline that includes background detection and adjustment, quantile normalization, and probeset signal summarization using miRNA QC Tool software (www.affymetrix.com). Differentially expressed miRNAs were analyzed using significance analysis of microarrays software (version 3.02; Stanford University, Palo Alto, CA, USA). The statistical significance of differential expression was measured at the false discovery rate significance level of < 5% combined with a fold change of ≥ 1.5 and ≤ 1.5. The unsupervised hierarchical clustering algorithm in CLUSTER 3.0 software (Stanford University)was used with a log2-transformed, median-centered by genes, and average-linkage agglomeration.
qRT-PCR
All reactions were run in triplicate on a LightCycler480 Real-Time PCR system (Roche, Basel, Switzerland). Candidate miRNAs with altered expression were validated using SYBR FAST qPCR Kit Master Mix (2×) Universal (KAPA Biosystem, Wilmington, MA, USA). Using the comparative threshold cycle (Ct), relative expression was calculated (relative expression = 2-ΔΔCt) and normalized to expression of the universally expressed U6 from the same samples as an internal control. All miRNA-specific primers were designed according to the miRNA sequences. The reverse transcriptase reaction mixture contained 1 µg of purified total RNA,2 µL of miRNA-specific stem-loop reverse transcription (10µM) primer, and 0.5 µL of U6 reverse transcription (10 µM)primer. The mixture was incubated for 5 minutes at 70°C,and then placed on ice for 2 minutes. Subsequently, 4 µL of 5× first-strand buffer, 2 µL of dNTPs (2.5 mM), 0.5 µL of RNasin, and 1 µL of TIANScript M-MLV were added. The reaction mixture was incubated for 50 minutes at 42°C, 5 minutes at 95°C, and then held at 4°C until the next step. All reverse transcriptase reactions were run in duplicate. The PCR mixture (20 µL) contained 1 µL of reverse transcription product, 10 µL of SYBR FAST Qpcr Kit Master Mix (2×)Universal, 0.4 µL of forward primer (10 µM), and 0.4 µL of reverse primer (10 µM). The mixture was incubated in a qRT-PCR thermocycler (Roche Light Cycler 480) at 95°C for 3 minutes, followed by 45 cycles at 95°C for 3 seconds, 60°C for 20 seconds, and 72°C for 1 second. Products were analyzed using a LIMS/Bar-Code software analysis system. All reagents from KAPA Biosystems were used according to the manufacturer's protocols. Relative expression of 20 miRNAs was normalized to expression of the internal control (U6) by the 2-ΔΔCTmethod. P values were calculated using a two-sided Student's t-test. Mean values are reported along with the standard deviation.
Correlating miRNA and mRNA expression
mRNA targets of specific miRNA were predicted from TargetScan 6.2 (http://www.targetscan.org), miRanda(http://34.236.212.39/microrna/home.do), miRWalk 2.0(http://zmf.umm.uni-heidelberg.de/apps/zmf/mirwalk2/),and RNA22 v2.0 (https://cm.jefferson.edu/rna22/). Only mRNA targets predicted by all four databases were considered for further analysis. miRNA and mRNA expression data were downloaded from the Gene Expression Omnibus database of the National Center for Biotechnology Information(Series accession number GSE46269) (https://www.ncbi.nlm.nih.gov/geo) (Liu et al., 2013); data were considered in the log2 scale. Statistical evaluations for multiple comparisons were carried out by one-way analysis of variance within the R program (version 3.0.1; http:/www.Rproject.org) with a significance level of < 0.05. Pearson correlation coefficients were generated for each differentially expressed miRNA and its targeted mRNA expression. Consistency between predicted mRNA targets and gene expression data was examined using density plots, which compared the distribution of Pearson correlation coefficients of all predicted targets with a control distribution of randomly selected nonpredicted targets for each differentially expressed miRNA. Compared with the control distribution, differentially expressed miRNAs with correlation coefficients of predicted mRNA targets that inclined to the left (more negative) were considered to be significant if the P value was < 0.05 as calculated by t-test.Density plots were generated using the R program 3.0.1. The resulting miRNA-mRNA interaction network was plotted using the Cytoscape platform (http://apps.cytoscape.org/).
Functional enrichment analysis of miRNA targets
Anti-correlated predicted targets of differentially expressed miRNAs (miR-194, miR-23a*, miR-27a*, miR-135a*, miR-122, and miR-10b) with Pearson correlation coefficients <-0.6 were included in functional enrichment analysis, which was performed with ClueGO in Cytoscape (http://apps.cytoscape.org/apps/cluego) (Bindea et al., 2009). Gene ontology(GO) terms with a Bonferroni corrected P value < 0.05 were considered to be significantly enriched.
Results
Identification of differentially expressed miRNA after DHCA
For a comprehensive understanding of miRNA expression after DHCA, the Affymetrix GeneChip array (miRNA version 2.0) system, which includes miRNAs of multiple organisms on a single chip, was used. miRNAs are highly conserved in different species; this aspect was exploited for heterologous hybridization because of limited probe numbers available for Sus scrofa, but a significantly large number of probe sets for Homo sapiens. Q-T testing reflected the high quality of the microarray scan (Additional Figure 1). Significance analysis of microarrays was performed to identify differences in miRNA expression in the hippocampi of DHCA and sham groups. Based on changes in gene expression, the significance analysis of microarrays calculated a score for each gene relative to the SDt. We identified 13 upregulated and 22 downregulated miRNAs with fold changes of ≥ 1.5 in hippocampal samples from the DHCA group. Supervised clustering, based on differentially expressed miRNAs, was used to generate heat maps indicating differentially expressed microRNAs between sham and DHCA subjects (Figure 2).

Figure 3 Density plots of Pearson correlation coefficients of predicted miRNA-mRNA pairs.(A-C) For each miRNA that was significantly expressed, the correlation between expression of miRNA and predicted target mRNAs was evaluated in six samples by calculating the Pearson correlation coefficient. This was repeated for all predicted target mRNAs of the corresponding miRNA;the distribution of these coefficients (red line) is shown in the density plot. The control curve (blue line) was used to illustrate the distribution of an equal number of coefficients, whereby each coefficient was obtained from the correlation of miRNA expression and expression of a randomly non-predicted mRNA. Compared with the control curve, a left shift of the red curve indicates that predicted mRNA targets are significantly more inversely correlated with that miRNA. Only the identified miRNAs exhibiting a significant left shift (Student's t-test P < 0.05) are shown: miR-194(A), miR-23a* (B), and miR-27a* (C). The X axis represents r, the Pearson correlation coefficient.
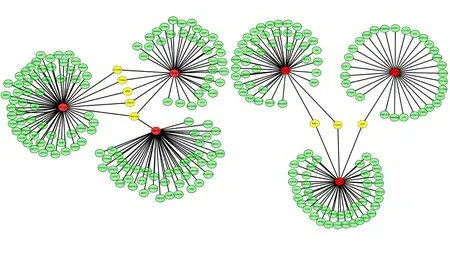
Figure 4 Network of inverse correlation between each differentially expressed miRNA and its putative mRNA targets.Red represents differentially expressed miRNA. Green represents inversely correlated mRNA targets of each miRNA. Yellow represents anti-correlated mRNAs shared among differentially expressed miRNAs.
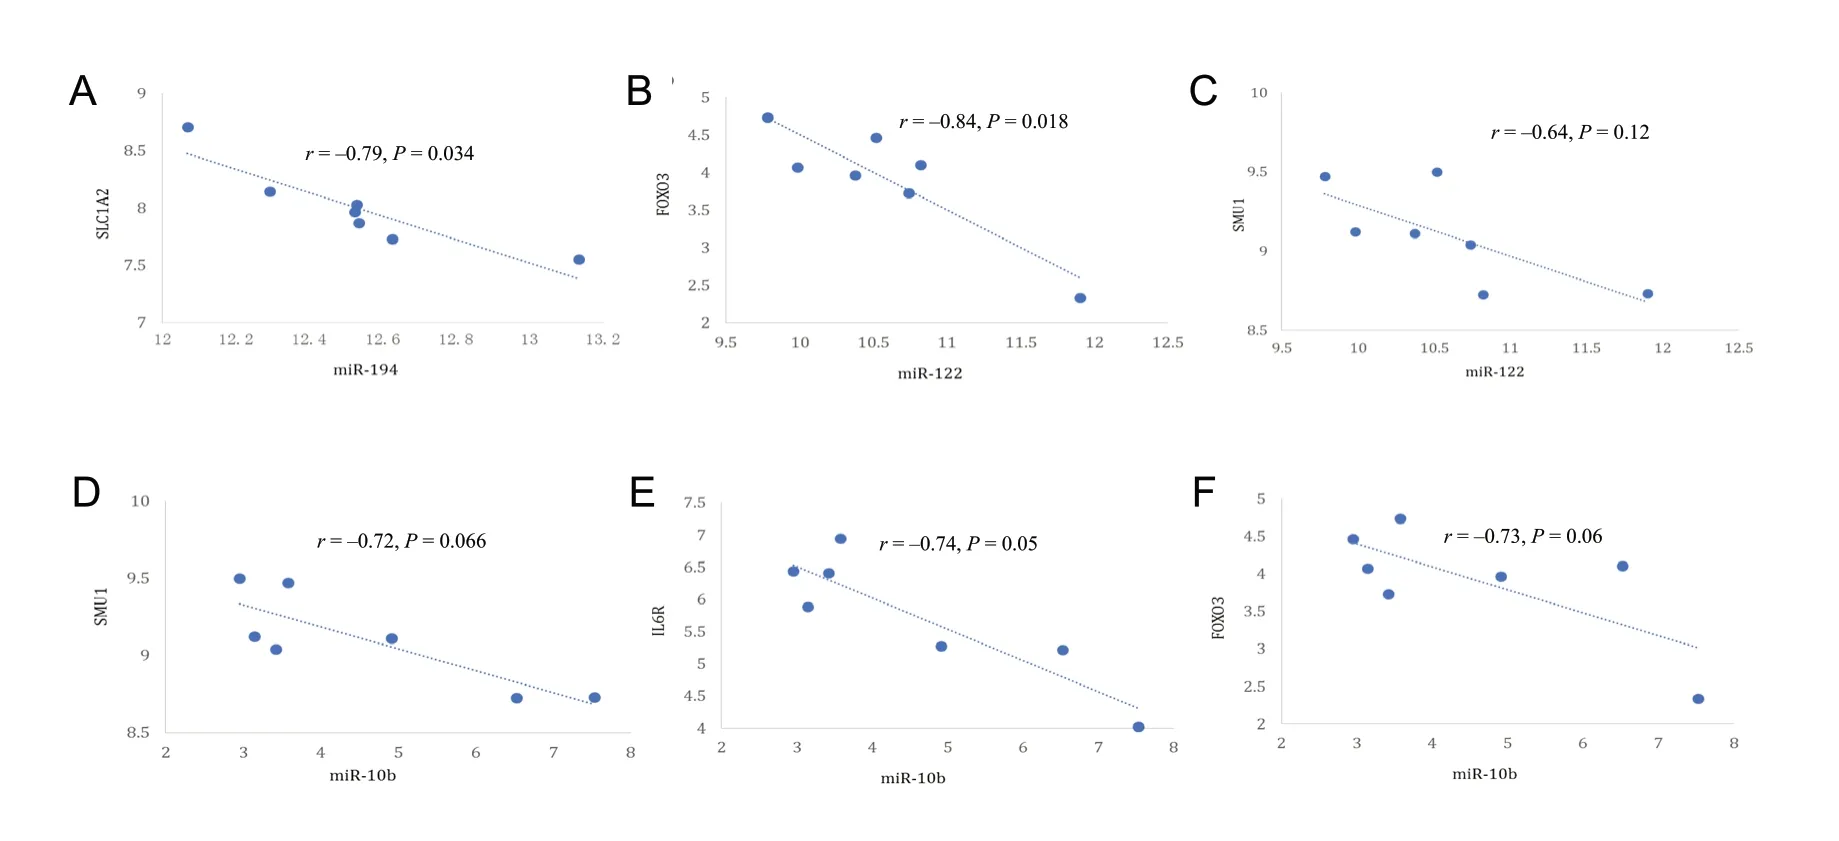
Figure 5 Select miRNA-mRNA pairs with strong inverse correlation.(A) miR-194-SLC1A2 (r = -0.79, P = 0.034); (B) miR-122-FOXO3 (r = -0.84, P = 0.018); (C) miR-122-SMU1 (r = -0.64, P = 0.12); (D) miR-10b-IL6R (r = -0.72, P = 0.066); (E) miR-10b-FOXO3 (r = -0.74, P = 0.05); (F) miR-10b-SMU1 (r = -0.73, P = 0.06).
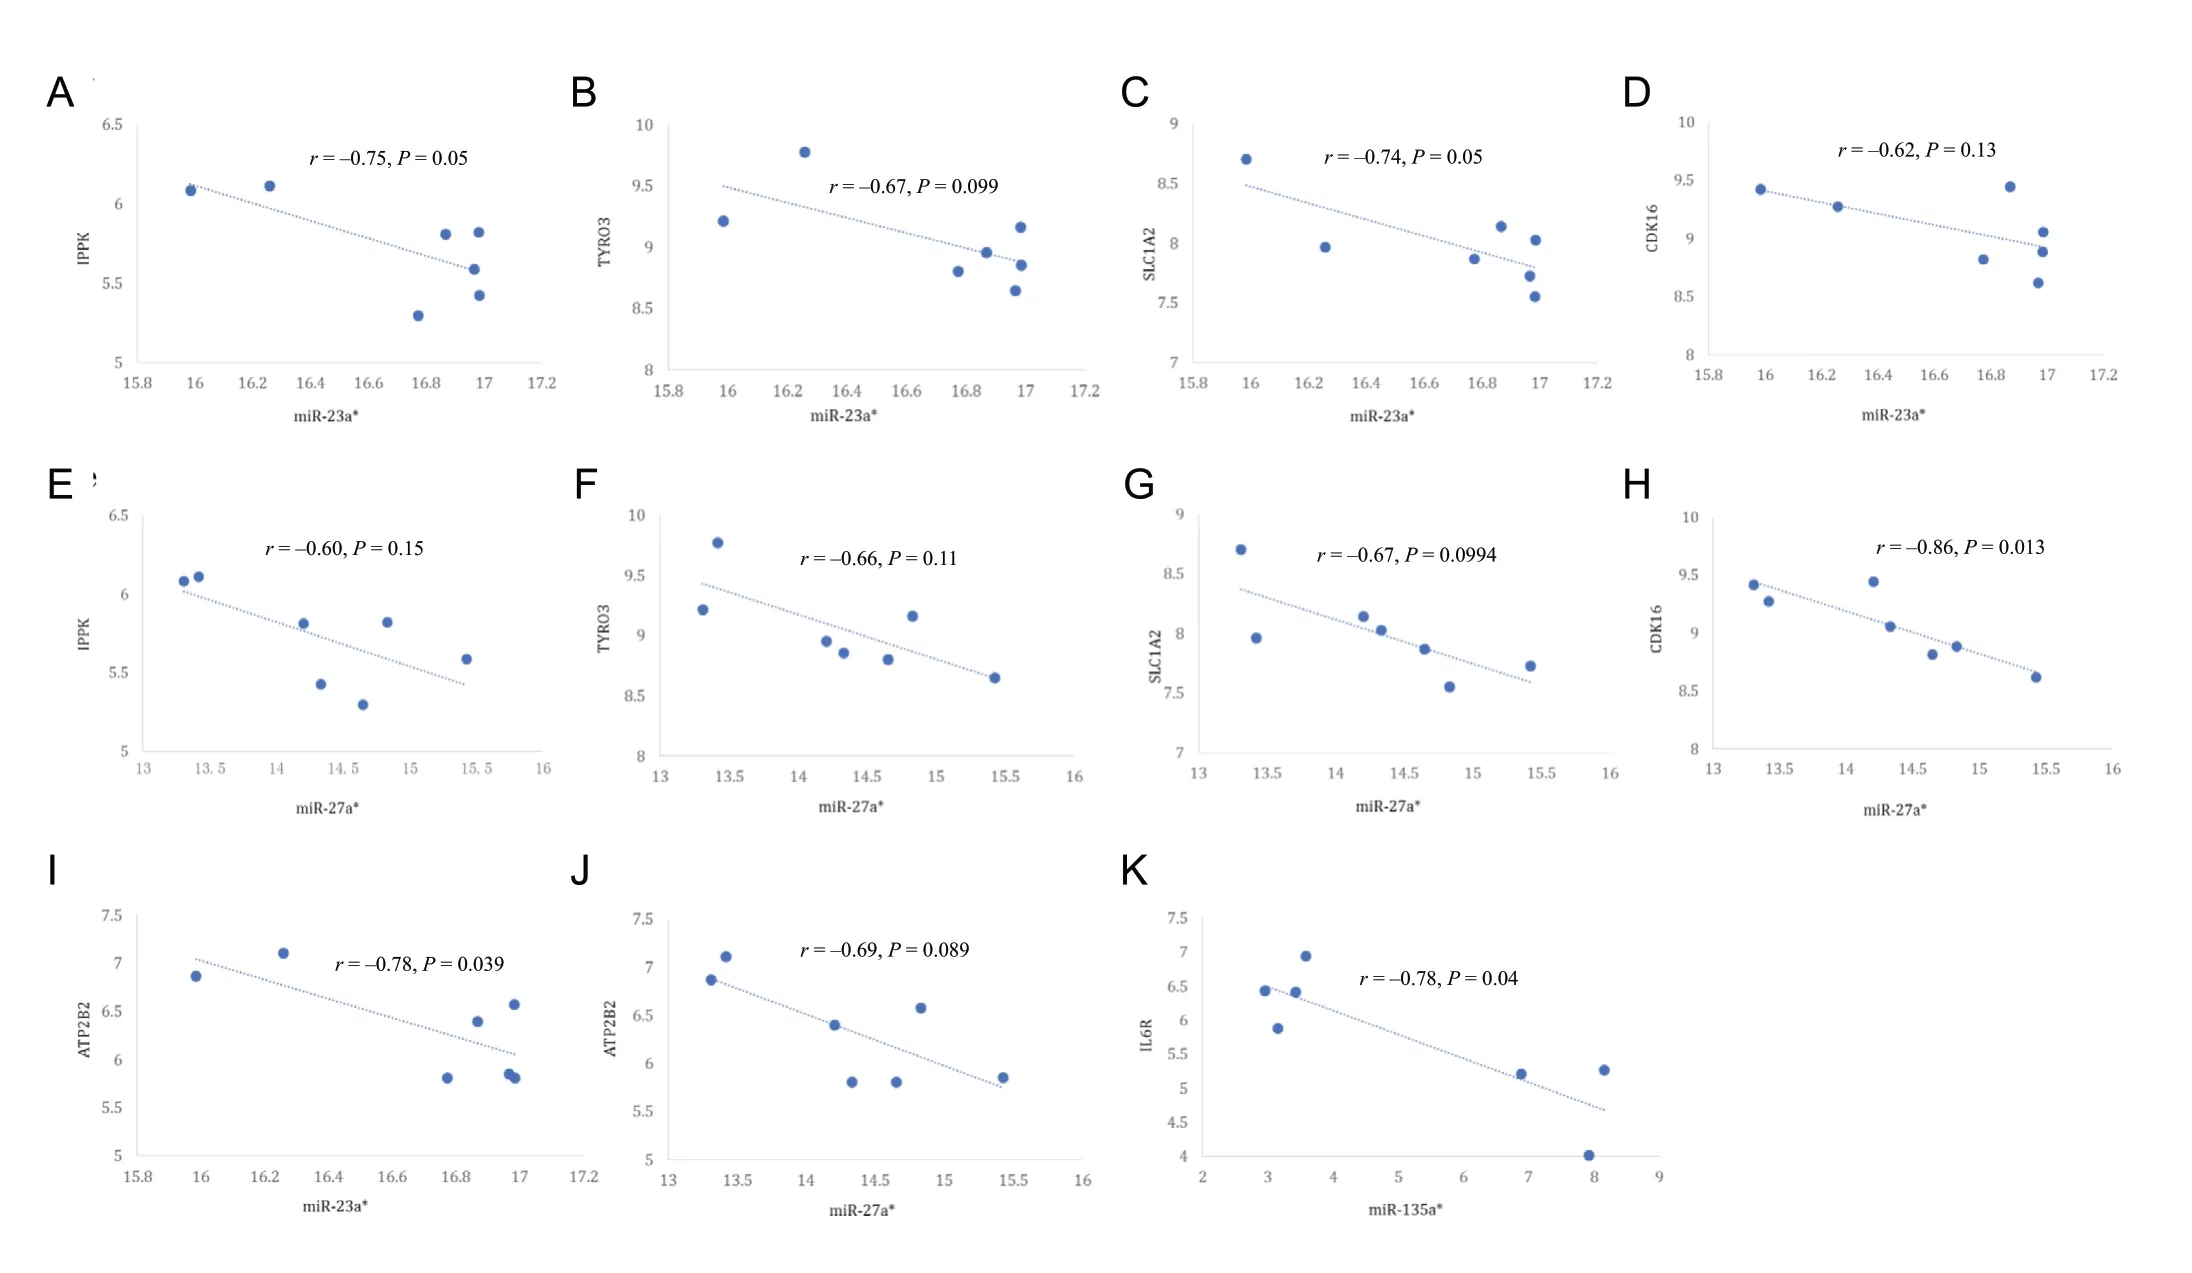
Figure 6 Inverse correlation of each differentially expressed miRNA with expression of its target mRNA.(A) miR-23a*-IPPK (r = -0.75, P = 0.05); (B) miR-23a*-TYRO3 (r = -0.67, P = 0.099); (C) miR-23a*-CDK16 (r = -0.74, P = 0.05); (D) miR-23a*-SLC1A2 (r = -0.62, P = 0.13); (E) miR-27a*-ATP2B2 (r = -0.60, P = 0.15); (F) miR-27a*-TYRO3 (r = -0.66, P = 0.11); (G) miR-27a*-IPPK (r = -0.67,P = 0.0994); (H) miR-27a*-SLC1A2 (r = -0.86, P = 0.013); (I) miR-23a*-ATP2B2 (r = -0.78, P = 0.039); (J) miR-27a*-CDK16 (r = -0.69, P = 0.089); (K)miR-135a*-IL6R (r = -0.78, P = 0.04). IPPK: Inositol-pentakisphosphate 2-kinase; CDK: cyclin dependent kinase.
qRT-PCR profiling of miRNA and the negative correlation between the expression of miRNA and mRNA targets
Four databases (TargetScan 6.2, miRanda, miRWalk 2.0, and RNA22 v2.0) were used to generate a list of mRNAs capable of serving as direct miRNA targets (Figure 3). As miRNA negatively modulates target mRNAs, we expected a left shifttoward anti-correlation in the predicted target distribution compared with the control. To explore this possibility, Pearson correlation coefficients of the six identified miRNAs(miR-194, miR-23a*, miR-27a*, miR-135a*, miR-122, and miR-10b) were compared with their predicted targets. We found that miR-194 (P = 0.0049), miR-23a*(P = 0.0017),and miR-27a*(P = 0.03) were highly inversely correlated with their putative targets compared with randomly selected no-predicted target mRNAs (Figure 4).
Furthermore, putative mRNA targets of each differentially expressed miRNA were refined by pair-wise Pearson correlation coefficient analysis between each miRNA target. Inversely correlated target mRNAs of each miRNA with a Pearson correlation coefficient < -0.6 were selected for further analysis. There were 255 mRNA targets for the six remaining miRNAs. Figure 5 shows the network of inverse correlation between each miRNA and its predicted mRNAs. We found that miR-194, miR-23a*, and miR-27a*shared five predicted mRNA targets: ATP2B2, TYRO3, inositol-pentakisphosphate 2-kinase (IPPK), CDK16, and SLC1A2. In addition, miR-135a*, miR-122, and miR-10b shared three predicted mRNA targets (FOXO3, SMU1, and IL6R) that strongly anti-correlated with identified miRNAs (Figures 6-8). Microarray profiling data were validated using the six miRNAs from 35 dysregulated miRNAs based on their fold changes, q values,and the results of microarray expression analysis by stemloop qRT-PCR. We found that expression of these miRNAs was consistent with microarray results (Figure 7).
Functional enrichment analysis of miRNA targets
Gene ontology enrichment analysis of the 255 anti-correlated mRNA targets of the six miRNAs revealed genes significantly enriched in seven GO terms (Figure 8), including neuronal projection (correlated P = 1.56 × 10⁻³), enzyme-linked receptor protein signaling (correlated P = 2.63 × 10⁻³), central nervous system (CNS) development (correlated P = 5.74 ×10⁻³), ion transmembrane transporter activity (correlated P =2.20 × 10⁻²), and interleukin-6 receptor binding (correlated P= 2.75 × 10⁻²). Six out of eight targets among the differentially expressed miRNAs were enriched for neuronal projection(CDK16 and SLC1A2), CNS development (FOXO3, TYRO3,and SLC1A2), ion transmembrane transporter activity (ATP2B2 and SLC1A2), and interleukin-6 receptor binding (IL6R).
Discussion
Studies have shown that miRNA expression profiles in the hippocampus during DHCA can regulate the expression of numerous target genes. The present study explored changes of miRNA expression in piglet hippocampus after experimental DHCA. Among the 1100 unique mature miRNAs examined, there was a change in the expression of 35 miRNAs.Dysregulated miRNAs included 22 downregulated miRNAs and 13 upregulated miRNAs. Changes of such a large number of miRNAs might noticeably affect the pathophysiology of DHCA. Studies have suggested the potential involvement of miRNAs in neurodegeneration (Saugstad, 2010), and they may also contribute to chronic brain diseases (Madathil et al., 2011). Specifically, miR-194, miR-10b, miR-200c, and miR-122 have been implicated in regulation of ischemic injury (Godwin et al., 2010), apoptosis (Bourguignon et al.,2010), oxidative stress (Magenta et al., 2011), and neurological injury (Stammet et al., 2012). Some of these differentially expressed miRNAs are also reportedly involved in ischemic brain damage. For instance, a recent study showed that miR-194 is associated with ischemic reperfusion (Godwin et al.,2010). Whereas, miR-10b expression is reportedly dysregulated during stroke and ischemic brain injury (Bourguignon et al., 2010). Notably, differentially expressed miR-122 is believed to be a brain injury-specific miRNA (Stammet et al., 2012); whereas, miR-720, miR-182, and miR-663 are involved in myelodysplastic syndrome (Borze et al., 2011),learned helplessness (Smalheiser et al., 2011), and autistic disorder (Talebizadeh et al., 2008). In addition, studies have reported that p53-induced activation of miR-194 during ischemia can promote angiogenesis and facilitate tissue repair (Sundaram et al., 2011). Moreover, the involvement of miR-122 has been reported in neurological injury after cardiac arrest (Bourguignon et al., 2010). Notably, high miR-10b expression has been shown to increase levels of phosphorylated ERK and its targets RHOC, RAP2A, and PTEN,indicating that miR-10b modulates RAS signaling (Chai et al., 2010; Godwin et al., 2010). Moreover, miR-10b plays a major role in neural cell differentiation (Foley et al., 2011).
The present study provides evidence that miR-27a*and miR-23a*exhibit a protective function during DHCA. However, studies on miRNAs*are required to further explore their protective function. As pre-miRNAs stems are imperfectly double stranded, the miRNA*is the small RNA that resides on the other side of the pre-miRNA stem opposite of the miRNA. Overall, our findings about the function of miR-27a and miR-27a*as pro-metastatic miRNAs contribute to a growing body of evidence that star miRNAs, which were originally viewed primarily as degraded byproducts,are functional and might drive functions in the tumorigenesis process. Recently, Wu et al. (2013) suggested that miR-27a*acts as a tumor suppressor by targeting the epidermal growth factor receptor signaling axis. They also reported tumor-suppressing effects of miR-27a*overexpression in the PC3 cell line. In the present study, microarray and bioinformatic analyses indicated that miR-23a*and miR-27a*shared several predicted mRNA targets: ATP2B2, TYRO3, IPPK,CDK16, and SLC1A2. ATP2B2, which is correlated with autism (Carayol et al., 2011), encodes a human Ca2+-pumping ATPase (Brandt et al., 1992). TYRO3 is one of three receptor protein tyrosine kinases that influence synaptic function in the CNS. Furthermore, Tyro3 signaling may be involved in synaptic plasticity in the dendritic compartment of hippocampal and cortical neurons (Prieto et al., 2007). In most living organisms, IPPK maintains cell autonomous circadian clocks that synchronize critical biological functions with daily environmental cycles. In mammals, the circadian clock is regulated by inputs from signaling pathways and knockdown of IPPK, which decreases rhythm amplitude, thus lengthening the sleep period (Wei et al., 2018). CDK16 is an important member of the CDK family and key regulator of vesicle trafficking, neurite outgrowth, and cell proliferation(Dixon-Clarke et al., 2017). Furthermore, CDK16 is required for neuronal differentiation within the brain (Yanagi and Matsuzawa, 2015). The SLC1A2 gene encodes the excitatory amino acid transporter 2 (EAAT2), which is responsible for clearing glutamate - the major mediator of excitatory neurotransmission - from the synaptic cleft. Notably, genetic variation in SLC1A2 has been implicated in a range of neurological and neuropsychiatric conditions, including schizophrenia, autism, and bipolar disorder (Fiorentino et al.,2015). Moreover, axon terminals expressing SLC1A2 (GLT-1; EAAT2) are common in the forebrain and, thus, are not limited to the hippocampus (Zhou et al., 2019).
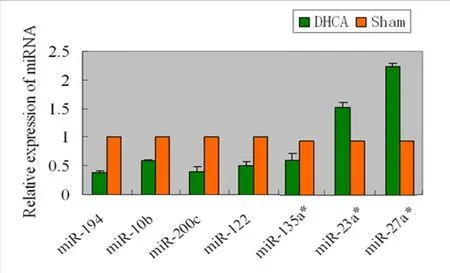
Figure 7 Validation of miRNA microarray data by quantitative reverse transcription-polymerase chain reaction.Relative expression of six miRNAs was normalized to the expression of an internal control (U6) using 2-ΔΔCT to calculate the difference in expression. P values were calculated using a two-sided Student's t-test.*P < 0.05, **P < 0.01, vs. sham group. Temporal expression profiles of selected regulated miRNAs as determined by quantitative reverse transcription-polymerase chain reaction analysis of hippocampal RNA.miRNAs, such as miR-194, -200c, -10b, and -122, were selected from the panel of downregulated miRNAs; and miR-27a* and -23a* were selected from the panel of upregulated miRNAs to confirm the findings of microarray and bioinformatic analyses. Data represent changes in threshold cycle between DHCA and sham groups (ΔCt = Ctsham-CtDHCA;n = 3). DHCA: Deep hypothermic circulatory arrest.
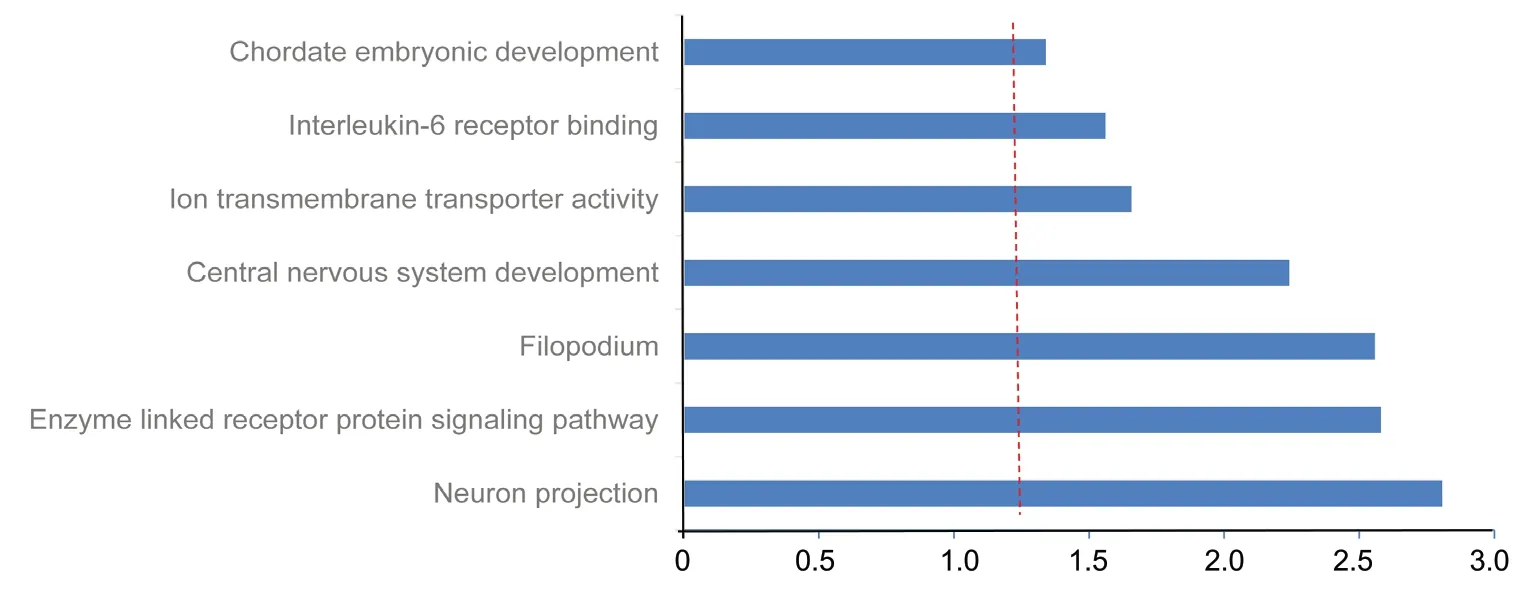
Figure 8 Functional enrichment analysis of 255 inversely correlated target mRNAs of selected miRNAs.Red vertical line represents Bonferroni correlated P = 0.05.
The results of the present study provide a mechanistic understanding of neurologic protection during DHCA,especially the pathway involved in cerebral protection. We examined miRNA profiles in the CA region of the piglet hippocampus by microarray analysis to elucidate post-transcriptional gene regulation after DHCA. Our results suggest that changes in neuronal projections, enzyme-linked receptor protein signaling, CNS development, ion transmembrane transporter activity, and interleukin-6 receptor binding pathways can affect the longtime outcome of DHCA and play a core role in DHCA, thus eliciting cerebral protection. Neuronal projection is essential for CNS function. Furthermore,enzyme-linked receptor protein signaling pathways and ion transmembrane transporter activity play important roles in energy metabolism and ion exchange during ischemia and hypothermia. Whereas, the interleukin-6 receptor binding pathway plays a key role in inflammation control after hypoxygenation and ischemia. These results support the development of new cerebral protective strategies for patients undergoing DHCA.
Nevertheless, there are several caveats that should be addressed in the future. Our data implicate candidate pathways and mRNAs involved in DHCA. However, we did not test these mRNAs and pathways in vivo or in vitro. As such,further studies are required to elucidate mRNA expression,which is a potential target of these miRNAs in the model.A second caveat involves the role of miRNAs. We observed changes in the expression of 33 miRNAs, but how these miRNAs interact with other miRNA networks remains to be explored. Although our microarray and GO analyses revealed common target mRNAs of the critical microRNAs, clustered microRNAs directing a common function demand further exploration. Using the DHCA model, we only evaluated changes in the expression of miRNAs in the CA1 hippocampal region, as this part is considered to be fragile after global ischemia. Considering that other parts of the brain, such as the striatum and cortex, might reveal different miRNA expression profiles, a comparative study will be carried out in the future. Indeed, extensive studies are required to identify whether these miRNAs function in neurons and other neurovascular systems. Regardless, the present study elucidates a novel role for the regulation of transcription during DHCA;these miRNAs will facilitate the development of future treatments for brain injury.
Author contributions:Experimental implementation and manuscript draft-ing: XHW, XSL, DXY; data acquisition and experimental repetition: LZ, YL,YW; data analysis and interpretation: BL, HXL; manuscript revision: XMJ;study design: TLW. All authors approved the final version of the paper.
Conflicts of interest: The authors declare that the article content was composed in the absence of any commercial or financial relationships that could be construed as a potential conflict of interest.
Financial support:This study was supported by the National Natural Science Foundation of China, No. 81401084 (to XHW); the Beijing Municipal Administration of Hospital Ascent Plan in China, No. DFL20150802 (to TLW); the Beijing 215 High Level Healthcare Talent Plan Academic Leader in China, No.008-0027 (to TLW); the Beijing Municipal Commission of Health and Family Planning in China, No. PXM2017_026283_000002 (to TLW); the Beijing Municipal Administration of Hospitals Clinical Medicine Development of Special Funding Support in China, No. ZYLX201706 (to TLW), 303-01-005-0137-11(to TLW), 65683.00 (to TLW). The funding bodies played no role in the study design, in the collection, analysis and interpretation of data, in the writing of the paper, and in the decision to submit the paper for publication.
Institutional review board statement: The study was approved by the Animal Care Committee of Xuanwu Hospital, Capital Medical University, China on March 1, 2017 (approval No. XW-INI-AD2017-0112).
Copyright license agreement:The Copyright License Agreement has been signed by all authors before publication.
Data sharing statement:Datasets analyzed during the current study are available from the corresponding author on reasonable request.
Plagiarism check:Checked twice by iThenticate.
Peer review:Externally peer reviewed.
Open access statement: This is an open access journal, and articles are distributed under the terms of the Creative Commons Attribution-Non-Commercial-ShareAlike 4.0 License, which allows others to remix, tweak, and build upon the work non-commercially, as long as appropriate credit is given and the new creations are licensed under the identical terms.
Additional file:
Additional Figure 1: Quality control for the microarray analysis with the QC tool software.
杂志排行
中国神经再生研究(英文版)的其它文章
- Etomidate affects the anti-oxidant pathway to protect retinal ganglion cells after optic nerve transection
- Pain inhibition through transplantation of fetal neuronal progenitors into the injured spinal cord in rats
- Atsttrin reduces lipopolysaccharide-induced neuroinflammation by inhibiting the nuclear factor kappa B signaling pathway
- Association between PPARG genetic polymorphisms and ischemic stroke risk in a northern Chinese Han population: a case-control study
- Silencing Huwe1 reduces apoptosis of cortical neurons exposed to oxygen-glucose deprivation and reperfusion
- Paired associative stimulation improves synaptic plasticity and functional outcomes after cerebral ischemia
