Interleukin-4 affects microglial autophagic flux
2019-07-17RunHongTangRuiQunQiHuaYanLiu
Run-Hong Tang, Rui-Qun Qi, Hua-Yan Liu,
1 Department of Neurology, the First Hospital of China Medical University, Shenyang, Liaoning Province, China
2 Department of Dermatology, Key Laboratory of Immunodermatology, the First Hospital of China Medical University, Shenyang, Liaoning Province, China
Abstract Interleukin-4 plays an important protective role in Alzheimer's disease by regulating microglial phenotype, phagocytosis of amyloid-β,and secretion of anti-inflammatory and neurotrophic cytokines. Recently, increasing evidence has suggested that autophagy regulates innate immunity by affecting M1/M2 polarization of microglia/macrophages. However, the role of interleukin-4 in microglial autophagy is unknown. In view of this, BV2 microglia were treated with 0, 10, 20 or 50 ng/mL interleukin-4 for 24, 48, or 72 hours. Subsequently,light chain 3-II and p62 protein expression levels were detected by western blot assay. BV2 microglia were incubated with interleukin-4(20 ng/mL, experimental group), 3-methyladenine (500 μM, autophagy inhibitor, negative control group), rapamycin (100 nM, autophagy inductor, positive control group), 3-methyladenine + interleukin-4 (rescue group), or without treatment for 24 hours, and then exposed to amyloid-β (1 μM, model group) or vehicle control (control) for 24 hours. LC3-II and p62 protein expression levels were again detected by western blot assay. In addition, expression levels of multiple markers of M1 and M2 phenotype were assessed by real-time fluorescence quantitative polymerase chain reaction, while intracellular and supernatant amyloid-β protein levels were measured by enzyme-linked immunosorbent assay. Our results showed that interleukin-4 induced microglial autophagic flux, most significantly at 20 ng/mL for 48 hours. Interleukin-4 pretreated microglia inhibited blockade of amyloid-β-induced autophagic flux, and promoted amyloid-β uptake and degradation partly through autophagic flux, but inhibited switching of amyloid-β-induced M1 phenotype independent on autophagic flux. These results indicate that interleukin-4 pretreated microglia increases uptake and degradation of amyloid-β in a process partly mediated by autophagy, which may play a protective role against Alzheimer's disease.
Key Words: nerve regeneration; Alzheimer's disease; interleukin-4; amyloid-β; microglial autophagy; microglial polarization; microglia; M1 phenotype; M2 phenotype; peptide degradation; neural regeneration
Graphical Abstract
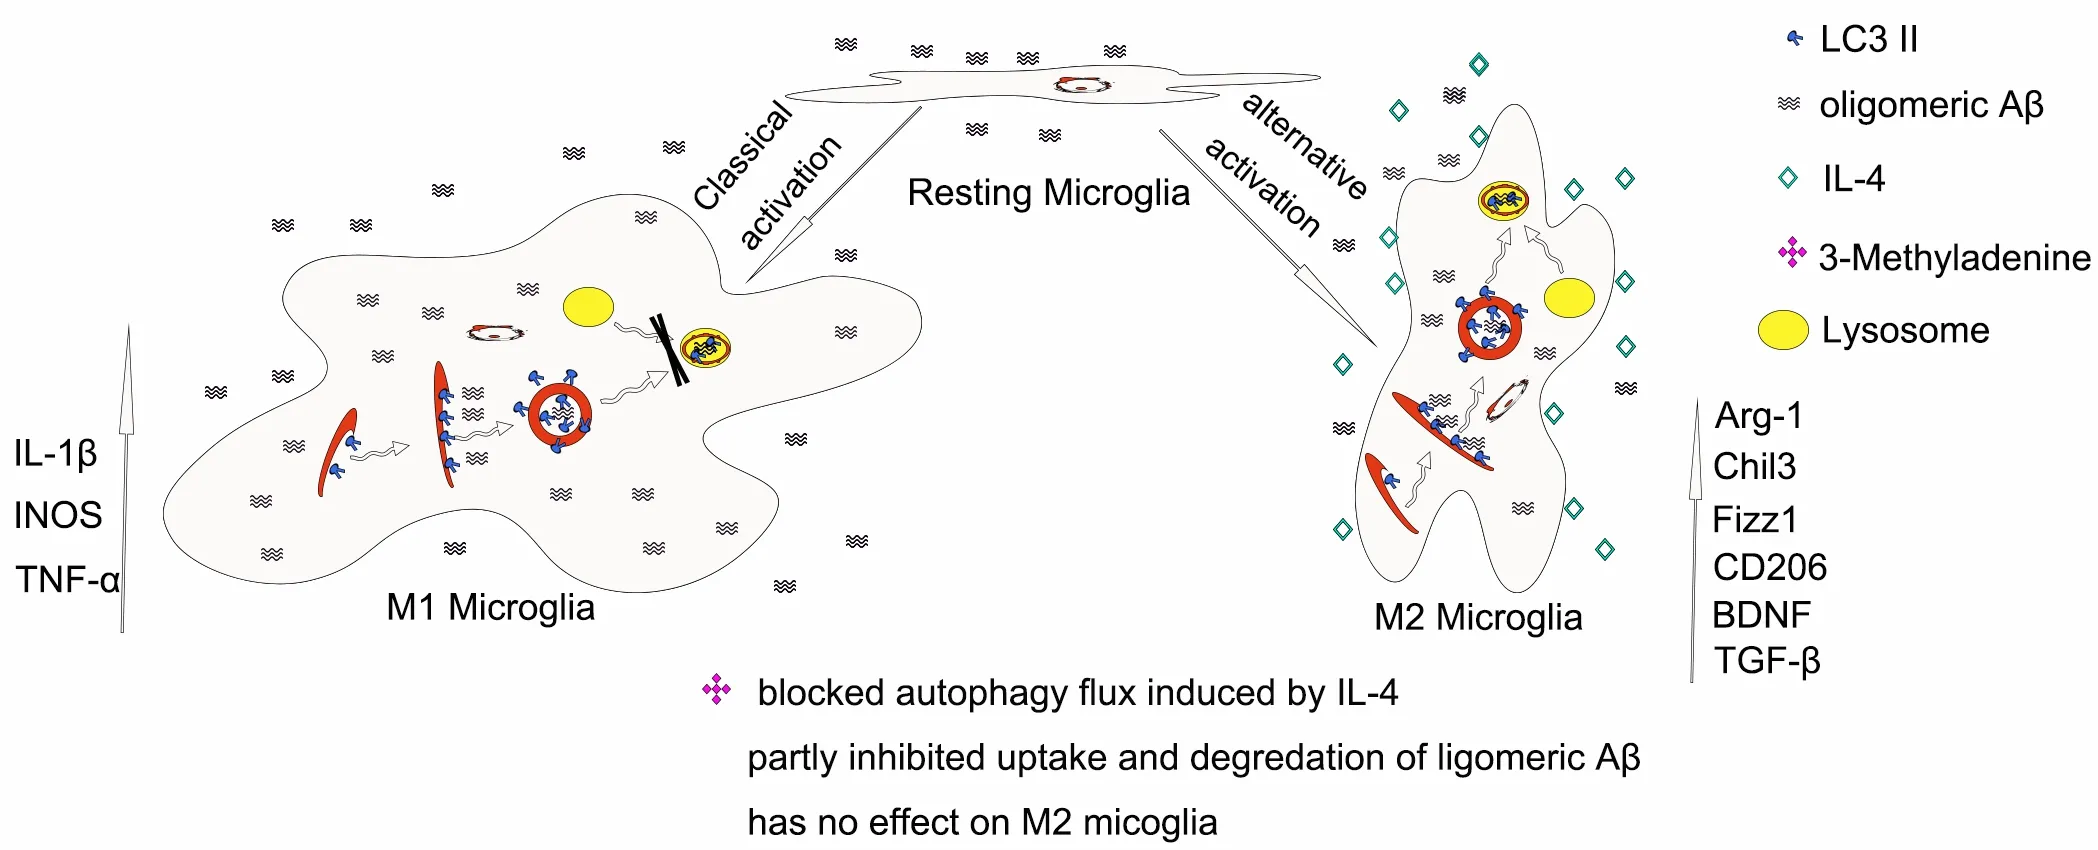
New mechanistic insights into the protective effects of interleukin-4 (IL-4) in Alzheimer's disease
Introduction
Alzheimer's disease (AD), the most common type of dementia, is characterized by extracellular accumulation of amyloid-β (Aβ) (Zlokovic et al., 2000; Mokhtar et al., 2018),especially oligomeric Aβ, which is considered to be both a toxic molecular agent that causes loss of synapses and is strong stimulus for microglial M1 activation (Huang and Mucke, 2012). Microglial activation is attributed to an imbalance between production and clearance of Aβ, with disrupted clearance rather than increased production being associated with the etiology of sporadic AD (Mawuenyega et al., 2010; Xin et al., 2018). Aβ is cleared from the brain by drainage of cerebrospinal fluid and cerebral blood flow, each being responsible for approximately 25% of clearance, while local uptake and degradation by microglia is responsible for the remaining 50% (Heneka, 2017). However, microglia are a double-edged sword that can exert neurotoxicity or neuroprotection depending on their diverse functional phenotypes(Morris et al., 2013; Colonna and Butovsky, 2017). Classically activated microglia, known as M1 phenotype, are characterized by an amoebic appearance, secretion of inflammatory cytokines, and impaired phagocytosis (Tang and Le, 2016).However, an alternative activated form of microglia, defined as M2 phenotype, is characterized by distal ramification,small cell bodies, strong phagocytic activity, and secretion of anti-inflammatory cytokines (Franco and Fernandez-Suarez,2015). Thus, balancing microglial polarization is of great significance in AD.
Autophagy is a lysosomal-dependent catabolic process by which cytoplasm containing aggregated proteins and abnormal organelles is isolated into autophagosomes, which are then delivered to lysosomes for degradation (Feng et al.,2014). Microglia isolated from the brains of patients with AD exhibit downregulated autophagy (Lucin et al., 2013).Moreover, deficient autophagy in microglia can impair synaptic pruning and elicit social behavioral defects (Kim et al.,2017). However, induction of microglial autophagy promotes degradation of extracellular Aβ and decreases the NLRP3 inflammasome (Cho et al., 2014). Notably, increasing evidence suggests that autophagy regulates innate immunity by affecting the polarization of microglial/macrophages M1/M2 phenotypes (Chen et al., 2014; Liu et al., 2015). However, it remains unclear whether autophagy regulates shifts between M1/M2 microglial polarization.
Interleukin-4 (IL-4), the strongest polarizing factor of the M2 phenotype (Gordon and Martinez, 2010), not only polarizes microglia to M2 (Kawahara et al., 2012) and reduces inflammatory production (Suh et al., 2013), but also promotes the proliferation of neural stem/progenitor cells and participates in memory and learning (Gadani et al., 2012; Nunan et al., 2014). Decreased IL-4 observed in aging animals was accompanied by increased inflammatory cytokines, such as IL-1β and IL-6 in the hippocampus, whereby they contributed to the impairment of long-term potentiation (Maher et al., 2005; Li et al., 2017). Conversely, IL-4 treatment was shown to reverse AD pathology (Kiyota et al., 2010) and cognitive impairment (Derecki et al., 2010). Recently, several studies have suggested that the effects of IL-4 on autophagy vary by cell type and environment. For example, Terawaki et al. (2015) showed that exposure to IL-4 during dendritic cell differentiation enhanced autophagic flux to promote endogenous antigen presentation, while Xia et al. (2018) reported that IL-4 induced autophagy of B cells through an mTOR-independent and PtdIns3K-dependent pathway. In addition,Yamamoto et al. (2006) suggested that activation of insulin receptor substrate 2 increased autophagic flux, while a contrasting study showed that IL-4 inhibited autophagy induced by starvation or interferon γ in macrophages to inhibit the elimination of intracellular Mycobacterium tuberculosis (Harris et al., 2007). However, the role of IL-4 in microglial autophagy is unknown. Therefore, we observed the effect of IL-4 on microglial autophagy and examined whether microglial polarization or phagocytosis are dependent on autophagy.
Materials and Methods
Cell culture and drug intervention
The BV2 microglial cell line, a gift from Guowei Ma, MD,and Liqing Guo, MD (Cell Resource Center, Institute of Basic Medical Sciences, Chinese Academy of Medical Sciences& Peking Union Medical College, China), were cultured in Dulbecco's Modified Eagle's Medium/High Glucose with 10% fetal bovine serum (Cat. No. S601P-500, SeraPro, South America) and 1% PenStrep, in a suitable carbon dioxide incubator (37°C, 5% CO2). For western blot assay and real-time fluorescence quantitative polymerase chain reaction(qPCR), cells were plated in 6-well plates. For enzyme-linked immunosorbent assay (ELISA), cells were grown in 24-well plates for the indicated times (3, 6, 12, or 18 hours). For the above experiments, microglia were grouped as follows:(1) control group: no treatment; (2) model group (Aβ): no pre-treatment for 24 hours followed by Aβ (1 μM, Cat#20276; AnaSpec, Fremont, CA, USA) for 24 hours to induce the AD cell model of microglia; (3) experimental group (Aβ+ IL-4): pre-treated with IL-4 (20 ng/mL, Cat#214-14, Peprotech, Rocky Hill, NJ, USA) for 24 hours, followed by Aβ for 24 hours to observe the effect of IL-4 on autophagic flux in the AD cell model of microglia; (4) negative control group(Aβ + 3-MA): pre-incubated with 3-methyladenine (3-MA,500 μM, Cat# A8353; APExBIO, Houston, TX, USA) for 24 hours, followed by Aβ for 24 hours as a negative control for autophagy inhibition in the AD cell model of microglia;(5) positive control group (Aβ + RAPA): pre-treated with rapamycin (100 nm, Cat# A8167; APExBIO) for 24 hours followed by Aβ for 24 hours as a positive control for autophagy induction in the AD cell model of microglia; (6) rescue group (Aβ + 3-MA + IL-4): pre-incubated with 3-MA and IL-4 for 24 hours, followed by Aβ for 24 hours to observe whether IL-4-induced microglial polarization and phagocytosis are dependent on autophagy.
Preparation of oligomeric Aβ
Aβ1-42was purchased from AnaSpec (Cat# 20276; AnaSpec)and prepared according to a previous method (Stine et al.,2003) with one minor modification: the peptide solution was prepared in phosphate-buffered saline instead of F12.
Western blot assays
To observe the effect of IL-4 on microglial autophagy, BV2 microglia in the logarithmic growth phase were plated into 6-well plates for 24 hours, then treated with 0, 10, 20,or 50 ng/mL of IL-4 for 24, 48, or 72 hours. Total protein was extracted with nondenaturing lysis buffer at indicated times, quantified with a BCA Protein Assay Kit, boiled for 10 minutes, and then separated by polyacrylamide gel electrophoresis and transferred onto polyvinylidene fluoride membranes (Thermo Fisher Scientific, Waltham, MA, USA).After blocking with 5% skim milk at room temperature for 2 hours, membranes were incubated overnight at 4°C with the following primary antibodies: anti-light chain 3B (LC3B)(1:1000; Cat#3868S, rabbit monoclonal, Cell Signaling Technology, Danvers, MA, USA), anti-p62/SQSTM1 (1:1000:Cat. #.5114S, rabbit polyclonal, Cell Signaling Technology),and β-actin (1:1000; Cat# A01010BIO, mouse monoclonal,ZSGB-BIO, Beijing, China). The primary antibody was recycled and membranes were washed three times with Tris-buffered saline Tween-20 for 10 minutes each, then incubated with horseradish peroxidase-conjugated goat anti-rabbit or goat anti-mouse secondary antibodies (1:5000;ZSGB-BIO, Beijing, China) for 1 hour at room temperature.Membranes were washed three times with Tris-buffered saline containing Tween-20 for 10 minutes each. Protein bands were detected with an enhanced chemiluminescence reagent kit (Beyotime, Haimen, China). Relative protein levels were quantified using ImageJ v1.37 software (Media Cybernetics,Silver Springs, MD, USA) and normalized to β-actin. To further observe the effect of IL-4 on microglial autophagy in the AD cell model of microglia induced with 1 μM Aβ, BV2 microglia cells were treated as described above, and LC3B and p62 were detected and analyzed by the same method.
Real-time fluorescence quantitative PCR (qPCR)
After confirming the effect of IL-4 on microglial autophagy by western blot assay, we performed RT-qPCR. BV2 microglia in logarithmic growth phase were treated as described in Materials and Methods before extracting total RNA using an Takara MiniBEST Kit (Cat# 9767; Takara, Shiga, Japan)according to the manufacturer's instructions. cDNA was prepared by reverse transcription of 1 μg of total RNA using a PrimeScriptTMRT reagent Kit (Cat# 047A; Takara) with gDNA Eraser at 37°C for 15 minutes, followed by 85°C for 5 seconds, and then held at 4°C. qPCR was performed using TB GreenTMPremix Ex TaqTMII (Cat# 820A; Takara) with the following conditions: initial denaturation at 95°C for 30 seconds, followed by 40 cycles of 95°C for 5 seconds and 60°C for 34 seconds. After normalization to GAPDH mRNA levels, relative mRNA expression values were calculated using the 2-ΔΔCtmethod (Avnet et al., 2017). Primers used for qPCR are listed in Table 1.
Enzyme-linked immunosorbent assay (ELISA)
BV2 microglia were cultured in 75-cm2dishes. When cells were in logarithmic phase, they were plated in 24-well plates for 24 hours and then pre-treated with 20 ng/mL IL-4 for 24 hours, followed by Aβ for 3, 6, 12, or 18 hours. Supernatants and cells were collected separately. Intracellular contents were obtained by repeated freezing and thawing. The concentration of Aβ in conditioned media plus added Aβ was measured as the starting concentration. Cell supernatant and intracellular Aβ levels were measured using a human ELISA kit (Annuo Ruikang Technology, Tianjin, China), with a sensitivity range of 0-100 ng/mL, according to the manufacturer's instructions, which included diluting samples before addition to the ELISA plate. Furthermore, to observe whether IL-4 induced microglia phagocytosis of Aβ depends on autophagy, cells in the logarithmic growth phase were treated as described in Materials and Methods. Supernatant and intracellular Aβ was detected by the same method.
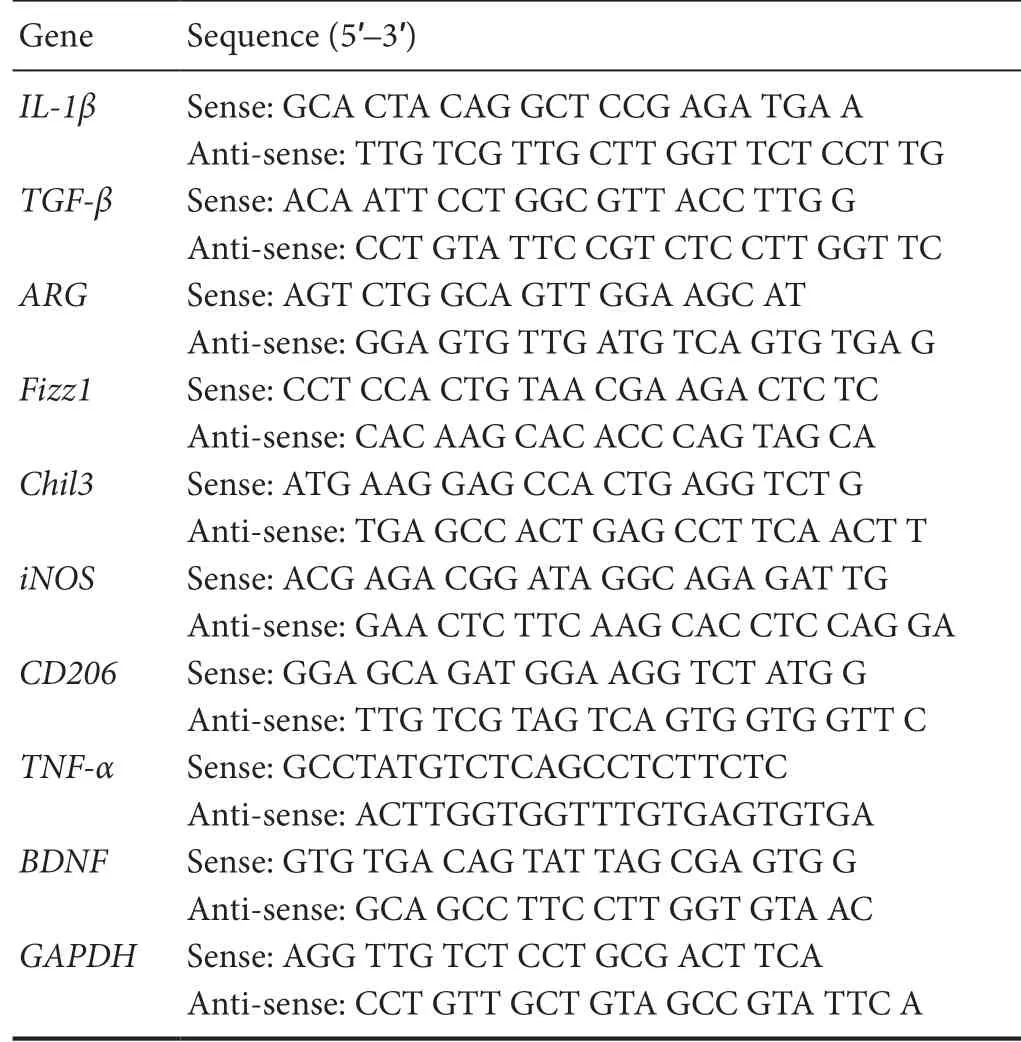
Table 1 Oligonucleotide primer sets for real-time fluorescence quantitative polymerase chain reaction
ARG: Arginase-1; BDNF: brain-derived neurotrophic factor; CD206:cluster of differentiation 206 (mannose receptor); Chil3: chitinase-like protein 3; Fizz1: found-in-the inflammatory zone; IL-1β: interleukin 1β; iNOS: inducible nitric oxide synthase; TNF: tumor necrosis factor;TGF-β: transforming growth factor β; GAPDH: glyceraldehyde-3-phosphate dehydrogenase.
Statistical analysis
Data are expressed as the mean ± SD. Statistical analysis for all data was performed using Prism 7.0 Software (GraphPad Company, San Diego, CA, USA). One-way and two-way analyses of variance were used for multiple comparisons as appropriate. P-values less than 0.05 were considered statistically significant.
Results
IL-4 induces microglial autophagic flux
Total proteins were extracted and used for western blot assay. LC3B-II, a lipidized form LC3B-I, is a trustworthy indicator for the formation of autophagy vacuoles; whereas, p62,an adapter for selective autophagy, is a marker for autophagic flux (Klionsky et al., 2016; Yoshii and Mizushima, 2017).LC3B-II levels (P < 0.01; Figure 1A) were rapidly increased in BV2 microglia treated with 20 ng/mL IL -4, and peaked at 48 hours, suggesting that autophagic vacuoles were induced. p62 levels were decreased in BV2 microglia treated with 20 ng/mL IL-4 for 48 hours (P < 0.01; Figure 1B), indicating that IL-4 both induced the formation of autophagic vacuoles and promoted the occurrence of autophagic flux in microglia.
IL-4 pretreated microglia inhibits blockade of Aβ-induced autophagy flux
Next, we observed the effect of IL-4 on microglial autophagy in the AD cell model of miccroglia. Microglia were processed as described in Materials and Methods. Our results showed that in model group, the protein expression level of LC3-II/LC3-I was not significantly different compared with control (P = 0.690; Figure 2A), but the protein expression level of P62 was significantly up-regulated (P < 0.001; Figure 2B), suggesting that autophagy vacuoles could be induced by Aβ, but autophagic flux was blocked. In IL-4 pretreated microglia, the protein expression level of LC3-II/LC3-I was not significantly changed compared with that in the model group (P = 0.500), but the protein expression level of P62 was significantly decreased (P < 0.0001), suggesting that IL-4 pretreated microglia inhibited blockade of Aβ-induced autophagic flux and returned it to normal levels. However, combined IL-4 with 3-MA pretreated microglia did not inhibit the blockade of Aβ-induced autophagic flux (Figure 2).
IL-4 pretreated microglia inhibits switching of Aβinduced M1 phenotype independent on autophagy
The results described above suggest that IL-4 pretreated microglia maintained normal level of autophagic flux in AD cell model of microglia. Therefore, we examined the dependency of the IL-4-induced M2 microglia phenotype on autophagy.Total RNAs were obtained and used for qPCR. Our results revealed significant increases in multiple markers of the M1 phenotype, such as IL-1β (P < 0.0001; Figure 3A), inducible nitric oxide synthase (iNOS) (P < 0.0001; Figure 3B),and tumor necrosis factor-α (TNF-α) (P < 0.05; Figure 3C).Moreover, multiple markers of the M2 phenotype, such as arginase-1 (ARG) (P = 0.999; Figure 3D), chitinase-like protein 3 (Chil3) (P = 0.493; Figure 3E), found-in-the inflammatory zone (Fizz1) (P < 0.0001; Figure 3F), brain-derived neurotrophic factor (BDNF) (P < 0.01; Figure 3G), cluster of differentiation (CD) 206 (P = 0.671; Figure 3H) and transforming growth factor β (TGF-β) (P < 0.001; Figure 3I),were unchanged or decreased in the model group, suggesting that Aβ activated and polarized microglia into the M1 phenotype. IL-4 pretreated microglia down-regulated multiple markers of M1 phenotype compared with the model group,such as IL-1β (P < 0.0001), iNOS (P < 0.0001) and TNF-α (P= 0.001), and up-regulated multiple markers of the M2 phenotype, such as Arg-1 (P < 0.0001), Fizz1 (P = 0.001), BDNF(P = 0.009), CD206 (P < 0.0001), and TGF-β (P < 0.0001),suggesting that IL-4 pretreated microglia inhibited switching of Aβ-induced M1 phenotype. Notably, the IL-4-induced M2 phenotype was not blocked by the autophagy inhibitor 3-MA,confirming that the IL-4-induced M2 phenotype occurred independent of autophagy. No significant changes were observed in various phenotypic markers of microglia, regardless of autophagy inhibition or induction. Consistent with a previous report (Su et al., 2016), autophagy induction could significantly reduce IL-1β levels (P < 0.0001; Figure 3A).
IL-4 pretreated microglia increases Aβ uptake and degradation partly through autophagic flux
To examine whether IL-4 promoted uptake or degradation of Aβ, microglia were plated on 24-well plates for 24 hours,and then incubated with Aβ or Aβ + IL-4 for 0, 3, 6, 12, or 18 hours. Supernatants and cell contents were collected to monitor dynamic changes in supernatant and intracellular Aβ levels by ELISA. Our results showed rapidly decreasing of Aβ levels in the supernatant of the experimental group, with a rate of decrease that was significantly faster than that observed in the model group (P < 0.0001; Figure 4A). Intracellular Aβ levels rapidly increased in the experimental group,peaking at 6 hours, suggesting that Aβ uptake was greater than its degradation before 6 hours; however, this trend was subsequently reversed (P < 0.0001; Figure 4B). It should be stressed that rates of uptake and degradation in the experimental group were higher than those in the model group at all time points. To further examine whether Aβ uptake and degradation in microglia treated with IL-4 depended on autophagy, BV2 microglia were treated as described in Materials and Methods, but with minor modifications in time (0, 6,12, and 18 hours). The results showed that the concentration of supernatant Aβ in the rescue group was higher than in the experimental group at different time points, but lower than in the model group (Figure 4C). The concentration of intracellular Aβ in the rescue group was lower than in the experimental group before 6 hours, and gradually higher than in the experimental group after 6 hours (Figure 4D), suggesting that IL-4 pretreated microglia increased Aβ uptake and degradation partly through autophagic flux. However,an autophagy inducer significantly increased Aβ uptake and degradation (P < 0.0001; Figure 4).
Discussion
Autophagic flux is defined as the overall progression of autophagy, which is initiated by the formation of autophagosomes - a double-membrane vesicle formed by an isolated membrane capturing cytoplasmic constituents. Subsequently, autophagosomes fuse to lysosomes to form autolysosomes that degrade cytoplasmic constituents using lysosomal proteases (Zhang et al., 2017). In this study, exposure of microglia to Aβ leads to inhibition of autophagic flux, suggesting the involvement of dysfunctional autophagy in microglia during the pathogenesis of AD (Pomilio et al., 2016). Consistent with our results, microglia derived from the brains of AD patients exhibited reduced beclin 1 and increased mTOR,which impaired microglial autophagy (Deretic and Klionsky,2018). Moreover, autophagic flux of macrophages is obviously reduced in aged mice, resulting in increased inflammatory cytokines and impaired phagocytosis and surface antigen presentation (Koike et al., 1999; Henry et al., 2009). Results from this study showed that IL-4 pretreated microglia induced autophagic flux and inhibited blockade of Aβ-induced autophagic flux. Our study added new mechanistic insights into how IL-4 exerts protective effects in AD. In short, it has been suggested that restoring autophagy homeostasis in microglia is beneficial for the prevention and treatment of AD.Recently, the view that autophagy regulates innate immunity by affecting the polarization of microglial/macrophage M1/M2 phenotypes has garnered increasing attention. In this study, Aβ activated and polarized microglia to an M1 phenotype, suggesting that an imbalance of microglial phenotypes is a potential pathological basis for AD. Genome-wide association studies have reported CR1, HLA-DRB5-DRB1,INPP5D, MEF2C, CD33, and TREM2, which are involved in immune response and inflammation, as genetic risk factors for AD (Naj et al., 2011; Lambert et al., 2013). Pro-inflammatory cytokines such as lipopolysaccharide, IL-1β, and interferon-γ inhibit the phagocytic activity of microglia,which is reversed by anti-inflammatory factors, such as IL-4, IL-10 and TGF-β (Tang and Le, 2016). Previous studies showed that activated microglia undergo morphological and functional transformations, switching from an alternative activation state with distal ramification, small cell bodies,and phagocytic capability to a classically activated phenotype with amoebic appearance accompanied by secretion of inflammatory cytokines (Jimenez et al., 2008; Fan et al., 2017).Therefore, strategies for balancing microglial M1/M2 phenotypes may be beneficial for halting the progression of AD. In our study, IL-4-pretreated microglia inhibited Aβ-induced M1 phenotype. Consistent with our results, previous studies suggested that IL-4 induces clearance of oligomeric Aβ by rat primary M2 microglia (Shimizu et al., 2008). However,microglia polarization after IL-4 pretreatment was not associated with microglial autophagy. It has been emphasized that autophagy induction polarizes microglia/macrophages to an M2 phenotype (Yang et al., 2014; Ji et al., 2018; Jin et al., 2018; Zhou et al., 2018), although some studies indicated that autophagy induction polarizes microglia/macrophages to an M1 phenotype (Fukushima et al., 2018; Jiang et al.,2018). This divergence may be arise from the use of different cells or models. Thus, how autophagy regulates the shifting between M1/M2 phenotypes in microglia requires further confirmation.
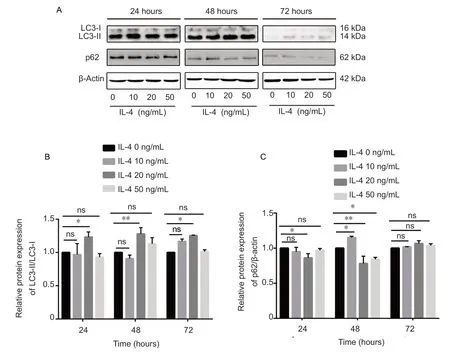
Figure 1 IL-4 induces microglial autophagic flux (western blotassay).(A) Changes of LC3 and p62 levels in microglia after IL-4 stimulation. BV2 microglial cells in logarithmic growth phase were plated in 6-well plates for 24 hours, and then incubated with 0, 10, 20 ,or 50 ng/mL IL-4 for 24, 48, or 72 hours in an incubator supplemented with carbon dioxide. Representative western blots revealed significantly increased protein expression levels of LC3- II/LC3-I in BV2 microglia treated with 20 ng/mL IL-4, peaking at 48 hours. The protein expression levels of p62 were decreased in BV2 microglia treated with 20 ng/mL IL-4 for 48 hours. (B, C) Relative expression levels of LC3 and p62, which were quantified and analyzed using two-way analysis of variance, are expressed as the mean ± SD of two independent experiments. *P< 0.05, **P < 0.01. IL-4: Interleukin-4; LC3: light chain 3; ns: no significance.
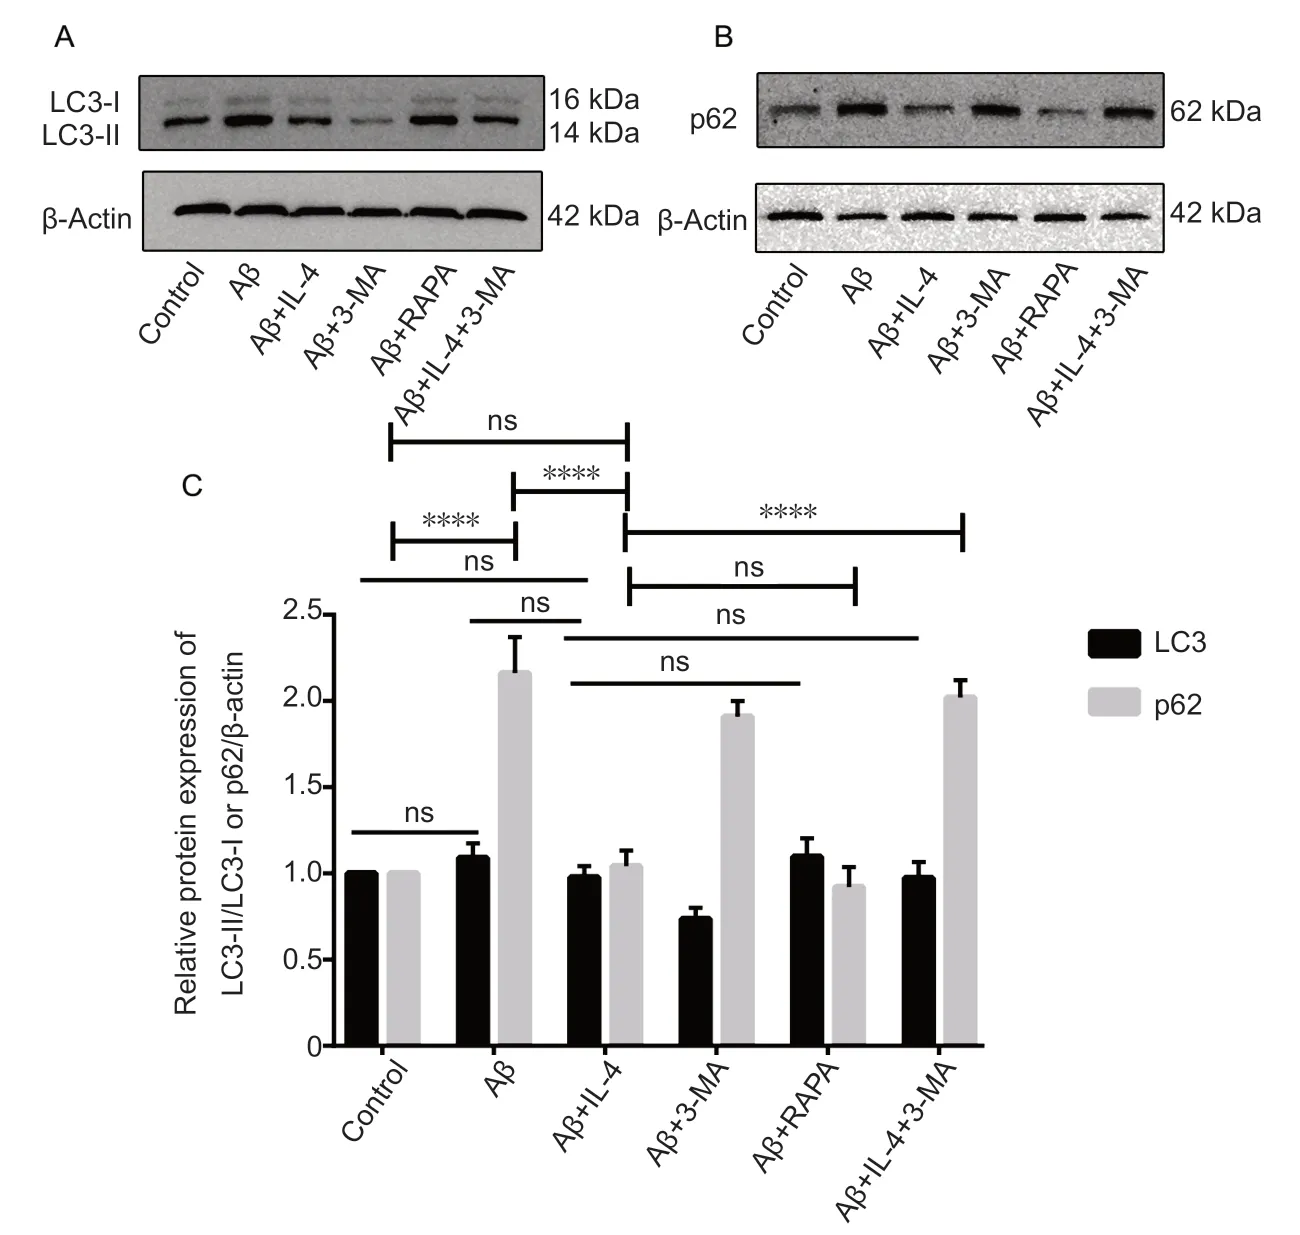
Figure 2 IL-4 pretreated microglia inhibitsblockade of Aβ-induced autophagic flux (western blot assay).(A, B) IL-4 pretreated microglia inhibited blockade of Aβ-induced autophagic flux. BV2 microglial cells in the logarithmic growth phase were plated in 6-well plates for 24 hours, and then processed as described in Materials and Methods. LC3-II, a lipidated form of LC3-I, is a trustworthy indicator for the formation of autophagic vesicles. P62, an adapter for selective autophagy, is a marker for autophagic flux. Representative western blots of LC3 and p62 staining revealed normal levels of LC3-II, but remarkably upregulated p62 levels in microglia exposed to Aβ. However, LC3-II was increased and p62 was decreased by IL-4. Combined IL-4 with 3-MA pretreated microglia didn't inhibit the blockade of Aβ-induced autophagic flux. (C)Relative expression levels of LC3-II/LC3-I and p62,which were quantified and analyzed using one-way analysis of variance, are expressed as the mean ± SD of three independent experiments. Solid lines are used to indicate comparisons of LC3-II/LC3-I with different groups. Capped lines are used to indicate comparisons of p62 with different groups. ****P< 0.0001. 3-MA: 3-Methyladenine, an autophagy inhibitor and negative control; Aβ: amyloid-β; IL-4:interleukin-4; LC3: microtubule-associated proteins 1A/1B light chain 3; RAPA: rapamycin autophagy induction, positive control; ns: no significance.
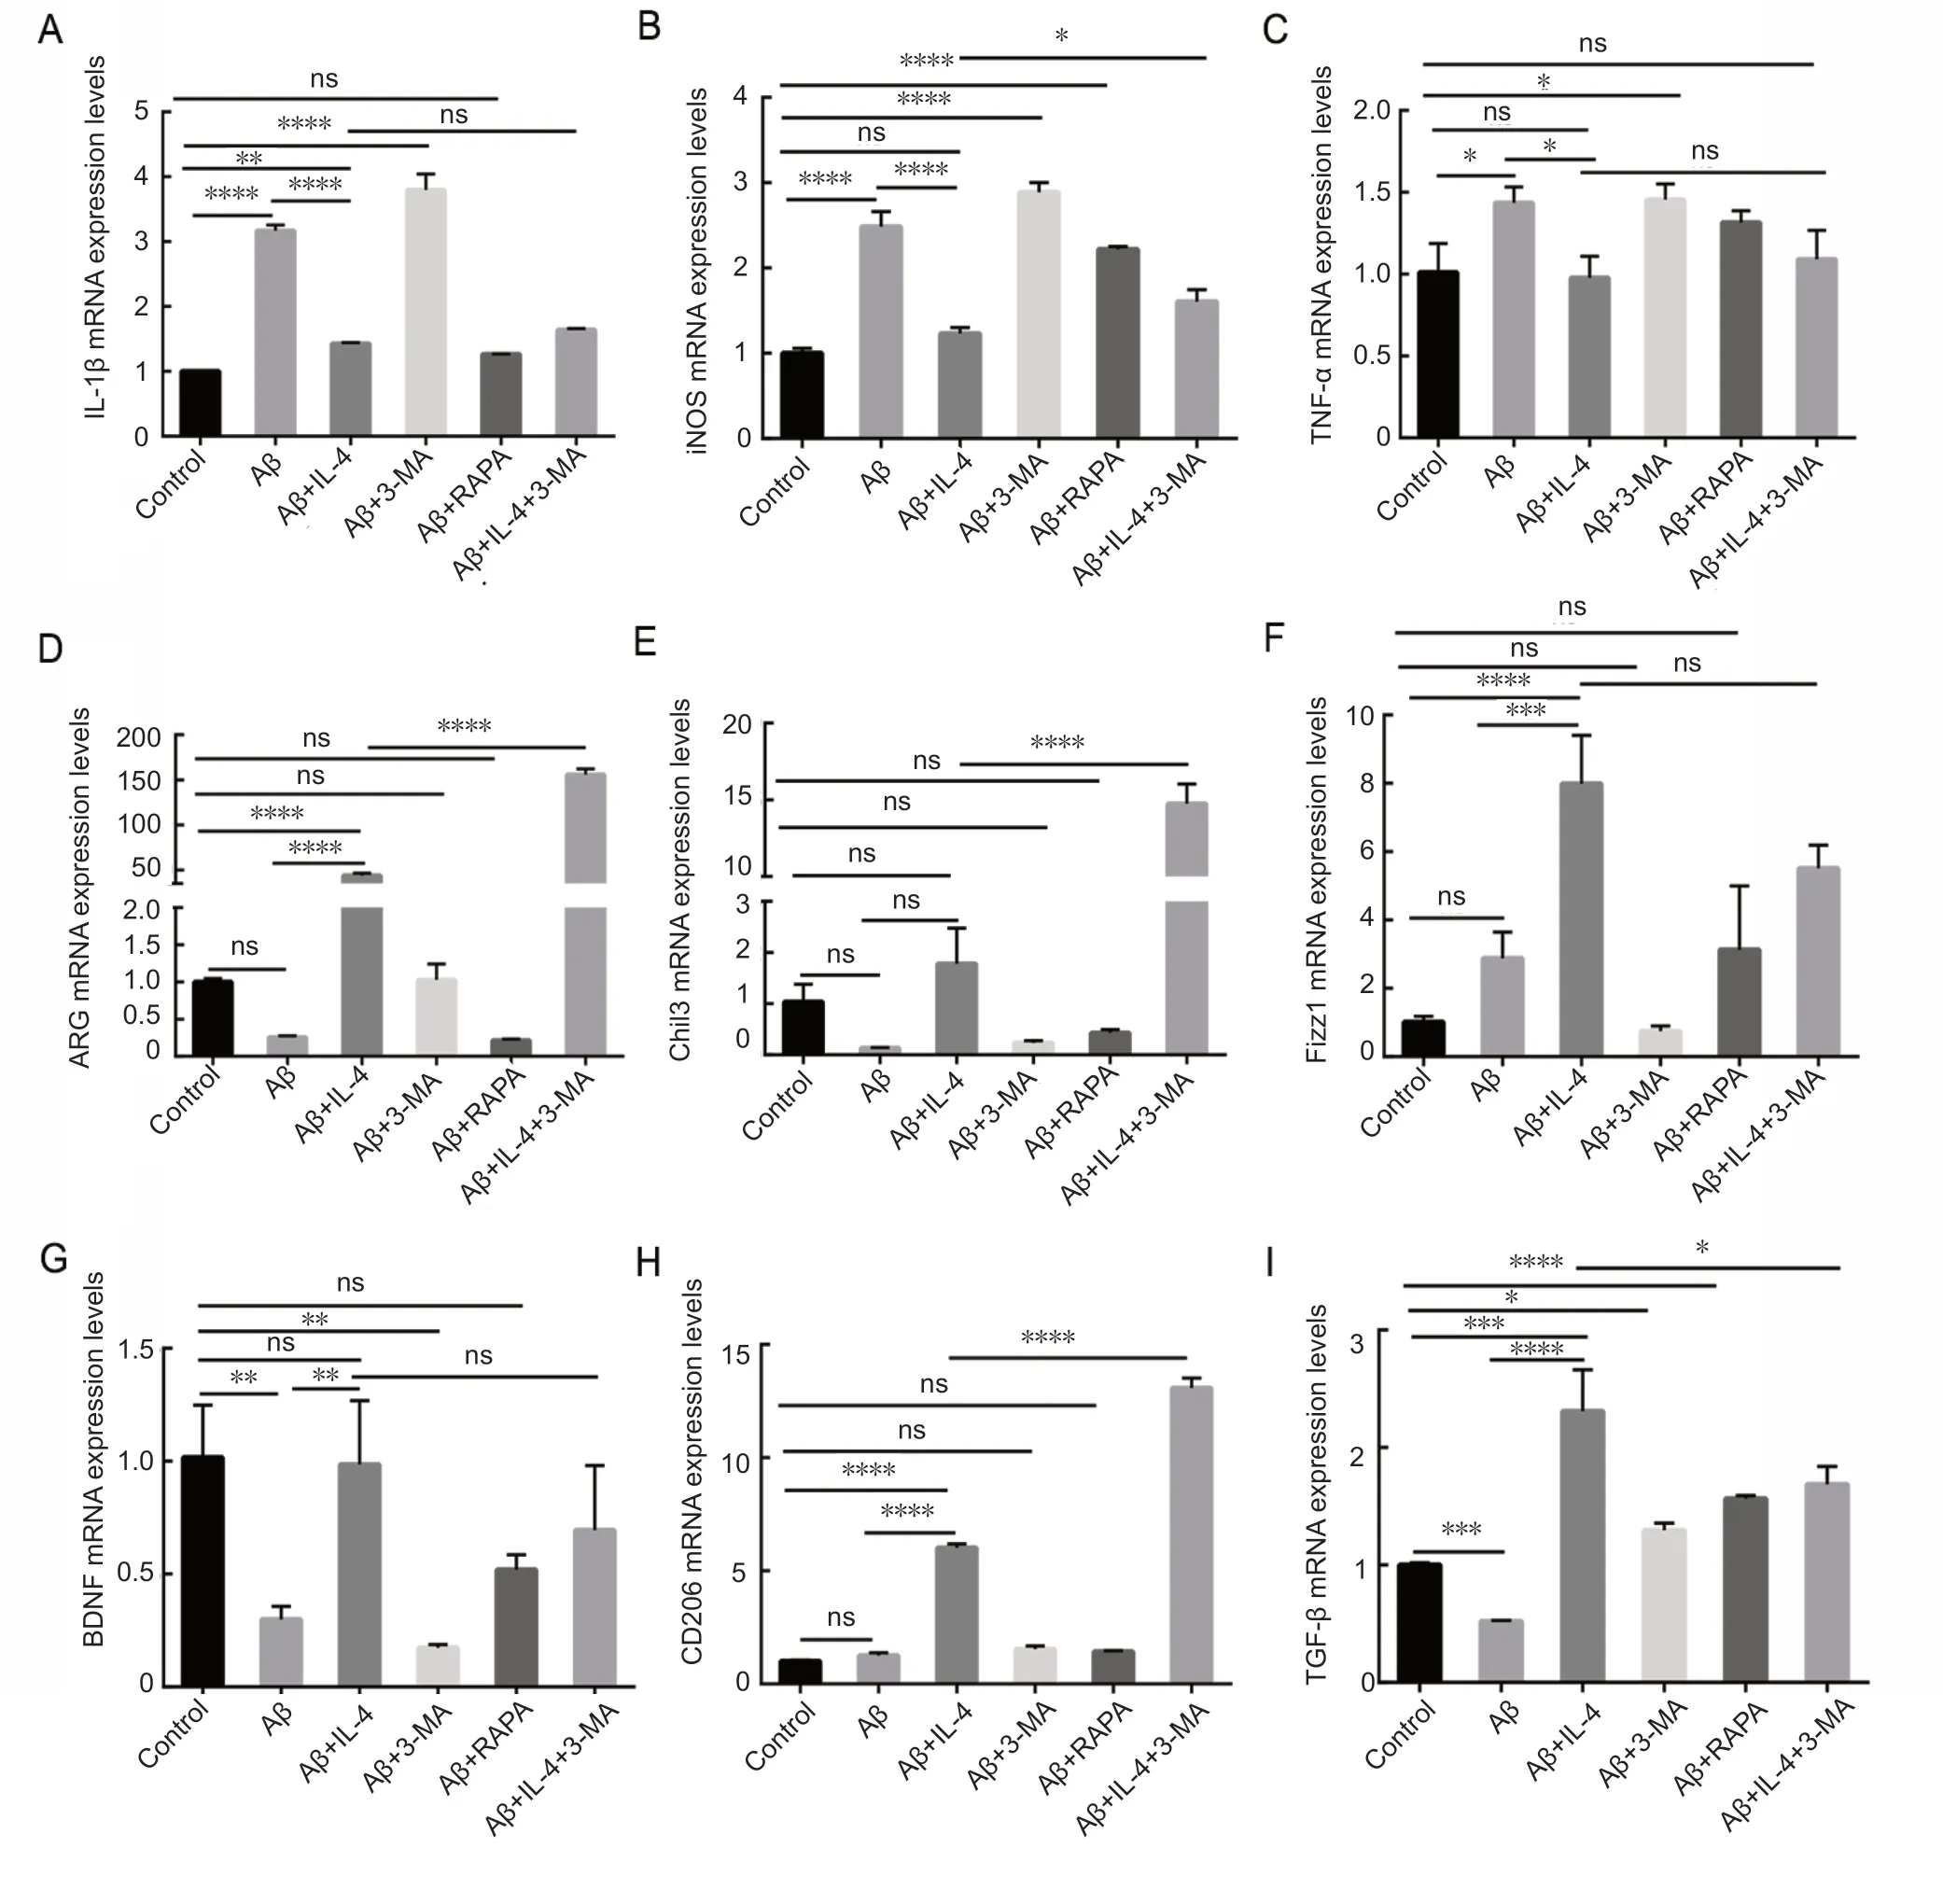
Figure 3 IL-4 pretreated microglia inhibits switching of Aβ-induced M1 phenotype independent of autophagy (quantitative polymerase chain reaction).Expression levels for multiple markers of M1 and M2 phenotype: IL-1β (A) and tumor necrosis factor (TNF)-α (C) exert a pro-inflammatory effect.iNOS (B) leads to oxidative damage, while ARG (D), Chil3 (E), and Fizz1 (F) are involved in repair and regeneration. BDNF (G) promotes neuronal survival. CD206 (H) facilitates antigen internalization and processing. TGF-β (I) elicits anti-inflammatory effects, regeneration, and upregulation of of Bcl-2 and Bcl-x1 levels. Multiple markers of an M1 phenotype including IL-1β, TNF-α, and iNOS, were remarkably upregulated, whereas multiple markers of an M2 phenotype, such as Arg-1, Chil3, Fizz1, CD206, BDNF, and TGF-β, were unchanged or decreased in microglia exposed to Aβ. However, multiple markers of an M1 phenotype were downregulated to nearly normal levels and multiple markers of an M2 phenotype were dramatically upregulated in microglia exposied to IL-4. IL-4-induced M2 phenotype was not blocked by the autophagy inhibitor 3-MA. Relative expression levels of multiple markers of M1 and M2 phenotypes, which were analyzed using one-way analysis of variance, are expressed as the mean ± SD of three independent experiments. *P < 0.05, **P < 0.01, ***P < 0.001, ****P < 0.0001. 3-MA: 3-Methyladenine: autophagy inhibitor(negative control); Aβ: amyloid β; ARG: arginase-1; BDNF: brain-derived neurotrophic factor; CD206: cluster of differentiation 206 (mannose receptor); Chil3: chitinase-like protein 3; Fizz1: found-in-the inflammatory zone; IL-1β: interleukin 1β; iNOS: inducible nitric oxide synthase; Rapa:rapamycin autophagy induction, as a positive control; TGF-β: transforming growth factor β; ns: no significance.
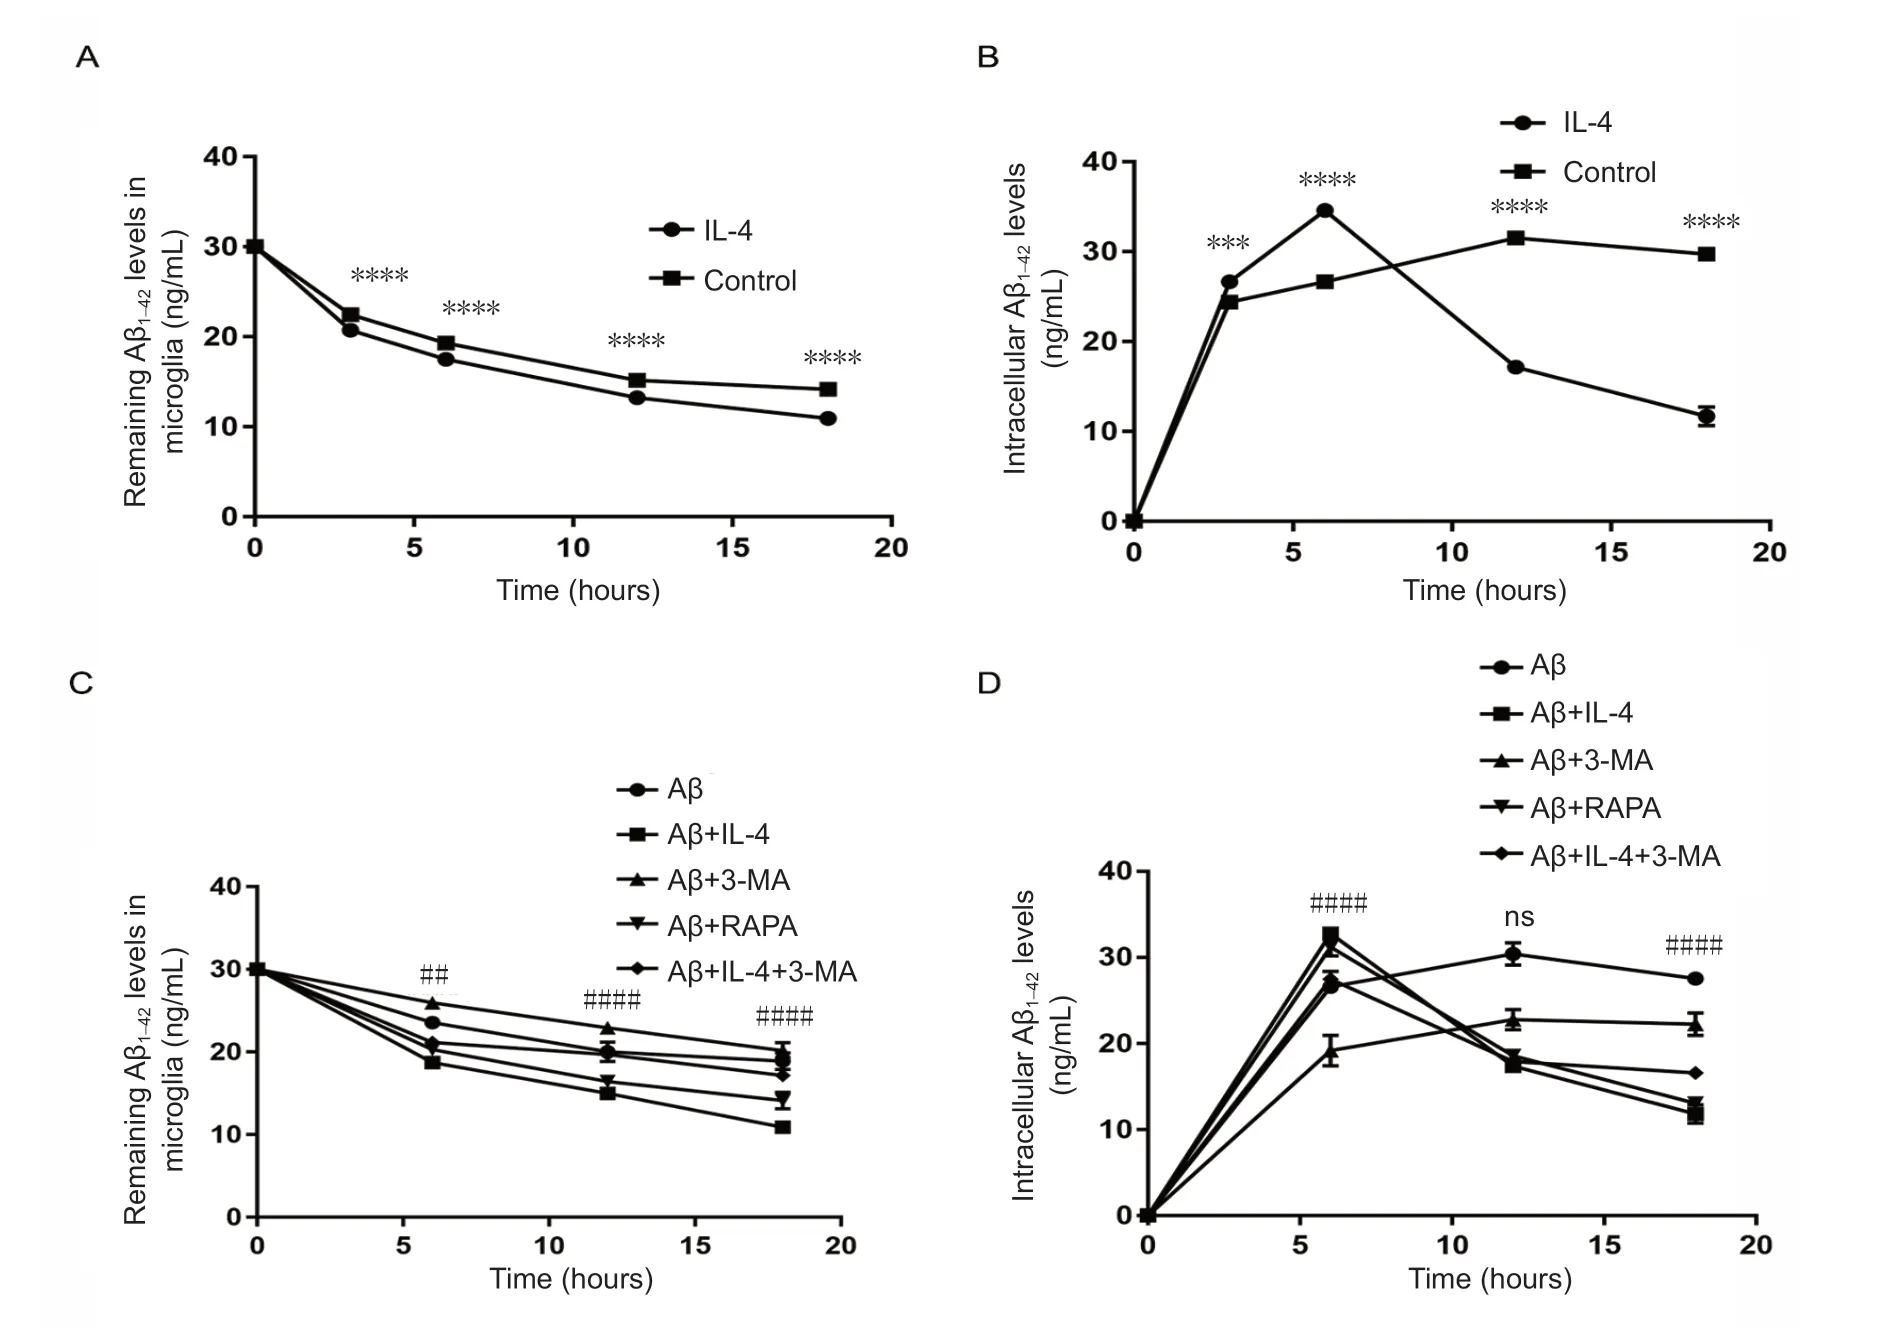
Figure 4 Increased Aβ uptake and degradation in microglia pretreated with IL-4 is partly dependent on autophagic flux (enzyme-linked immunosorbent assay).(A, B) Aβ uptake and degradation was increased in microglia pretreated with IL-4. BV2 microglia in the logarithmic growth phase were plated in 24-well plates for 24 hours, pretreated with 20 ng/mL IL-4 for 24 hours, and then exposed to Aβ for 3, 6, 12, or 18 hours. Cells and supernatants were harvested at indicated times, and cell contents were obtained by repeated freezing and thawing, followed by detection of supernatant and intracellular Aβ levels. The concentration of Aβ in conditioned media plus added Aβ were measured as the starting concentration. Exposure to IL-4 increased uptake and degradation of Aβ. There were statistical significances between the experimental group and the control group (***P < 0.001,****P < 0.0001). (C, D) IL-4 pretreated microglia increased Aβ uptake and degradation partly through autophagic flux. BV2 microglial cells in the logarithmic growth phase were placed into 6-well plates for 24 hours, and then processed as described in Materials and Methods. The concentration of supernatant Aβ in the rescue group was higher than in the experimental group at different time points, but lower than in the model group. The concentration of intracellular Aβ in the rescue group was lower than that in the experimental group before 6 hours, and gradually higher than that in the experimental group after 6 hours. There were significances between the experimental group (Aβ + IL-4 ) and the rescue group (Aβ + IL-4+ 3-MA) (##P < 0.01, ####P < 0.0001). The absolute quantification of supernatant and intracellular Aβ levels, which were analyzed using two-way analysis of variance, are expressed as the mean ± SD of three independent experiments. 3-MA: 3-Methyladenine: autophagy inhibitor, as a negative control; Aβ: amyloid β; IL-4: interleukin-4; Rapa: rapamycin autophagy induction, as a positive control; ns: no significance.
It is worth noting that autophagy has recently been discovered to degrade not only cellular self-components (Mizushima et al., 2008), but also extracellular substances (Levine et al., 2011). In this study, IL-4 pretreated microglia promoted Aβ uptake and degradation, which was partly inhibited by an autophagy inhibitor3-MA, suggesting that IL-4 induced uptake and degradation of Aβ partly through autophagy.Dysfunction of microglial autophagy was previously reported to impair the recycling of phagocytic receptors CD36 and Trem2, increase inflammatory cytokines, and reduce phagocytosis of Aβ (Lisi et al., 2011). However, induction of microglial autophagy promotes Aβ degradation, reduces the release of inflammatory mediators, and ameliorates cognitive deficits (Dello Russo et al., 2013; Shibuya et al.,2014). Therefore, autophagy induction plays an important role in promoting Aβ clearance and downregulation of inflammatory cytokines. However, Cho et al. (2014) suggested that Aβ-exposed BV2 microglia and primary microglia induce microglial autophagy and degrade Aβ fibrils in an mTOR-dependent manner after engulfing Aβ fibrils and exposing them to the cytosol, where they did not associate with insulin-degrading enzymes. Other reports suggested that microglia exposed to Aβ decreased beclin-1 and p62 without modification of the LC3B-II/LC3B-I ratio (Franco and Fernandez-Suarez, 2015). These discrepancies may arise from different modeling methods, such as the stimulation of microglia with Aβ fibrils or oligomers. Different Aβ1-42states have been reported to exert different effects on neuronal autophagy (Guglielmotto et al., 2014), thus this may also apply to microglial autophagy. Regardless, the results from this study showed that Aβ uptake and degradation were obviously increased by IL-4, and partly reduced by blocking autophagy, indicating that IL-4 may mediate Aβ uptake and degradation through other mechanisms such as neprilysin (Doens and Fernandez, 2014), insulin-degrading enzyme (Lee and Landreth, 2010), or the ubiquitin-proteasome system (Ries and Sastre, 2016).
This study has some limitations. First, we did not investigate the detailed molecular mechanisms underlying IL-4-induced microglial autophagy, which will be addressed in future experiments. Second, there is no validation for our experiments in vivo, and in vitro experiments were not performed in multiple cell lines.
In summary, the present study provides evidence that IL-4 pretreated microglia inhibited the blockade of Aβ-induced autophagic flux, and promoted Aβ uptake and degradation partly through autophagic flux, but inhibited switching of Aβ-induced M1 phenotype independent on autophagic flux.Thus, our experiments provide new insights into the protective role of IL-4 in AD.
Acknowledgments:We thank Department of Dermatology, First Affiliated Hospital of China Medical University and Key Laboratory of Immunodermatology, Ministry of Health and Ministry of Education, Shenyang,China for providing laboratory. We thank Guo-Wei Ma and Li-Qing Guo from Cell Resource Center, Institute of Basic Medical Sciences, Chinese Academy of Medical Sciences & Peking Union Medical College, China for giving BV2 cell line.
Author contributions:Study design: RHT, HYL; expermental implementation and data analysis: RHT; paper writing: RHT and RQQ; paper revision: RQQ. All authors approved the final version of the paper.
Conflicts of interest:The authors declare that there are no conflicts of interest associated with this manuscript.
Financial support:This work was financially supported by the Natural Science Foundation of Liaoning Province of China, No. 20170541036 (to HYL). The funding source had no role in study conception and design,data analysis or interpretation, paper writing or deciding to submit this paper for publication.
Copyright license agreement: The Copyright License Agreement has been signed by all authors before publication.
Data sharing statement:Datasets analyzed during the current study are available from the corresponding author on reasonable request.
Plagiarism check: Checked twice by iThenticate.
Peer review:Externally peer reviewed.
Open access statement:This is an open access journal, and articles are distributed under the terms of the Creative Commons Attribution-Non-Commercial-Share Alike 4.0 License, which allows others to remix, tweak, and build upon the work non-commercially, as long as appropriate credit is given and the new creations are licensed under the identical terms.
杂志排行
中国神经再生研究(英文版)的其它文章
- Novel miRNA, miR-sc14, promotes Schwann cell proliferation and migration
- Knowledge domain and emerging trends in Alzheimer's disease: a scientometric review based on CiteSpace analysis
- Lesions of mediodorsal thalamic nucleus reverse abnormal firing of the medial prefrontal cortex neurons in parkinsonian rats
- Mesenchymal stem cell-derived exosomes promote neurogenesis and cognitive function recovery in a mouse model of Alzheimer's disease
- Identification of microRNAs and messenger RNAs involved in human umbilical cord mesenchymal stem cell treatment of ischemic cerebral infarction using integrated bioinformatics analysis
- miR-15b-5p targeting amyloid precursor protein is involved in the anti-amyloid eflect of curcumin in swAPP695-HEK293 cells
