Single-cell Analysis of CAR-T Cell Activation Reveals AMixed TH 1/TH 2 Response Independent of Diあerentiation
2019-07-12IvAXhangolliBurakDuraGeeHeeLeeDongjooKiMYangXiaoRongFan
IvAXhangolli,Burak Dura,GeeHee Lee,Dongjoo KiM,Yang Xiao,Rong Fan*,f
1 Department of Biomedical Engineering,Yale University,NeWHaven,CT 06520,USA
2 Yale CanceRCenter,Yale School of Medicine,NeWHaven,CT 06520,USA
3 Yale SteMCell Center,Yale School of Medicine,NeWHaven,CT 06520,USA
KEYWORDS Single-cell transcriptoMics;Single-cell p roteoMics;CAR-T;T cell activation
Abstract The activation mechanisMof chimeric antigen receptor(CAR)-engineered T cellsmay diffeRsubstantially froMT cells carrying native T cell receptor,but this difference remains poorly understood.We present The first coMprehensive portrait of single-cell level transcriptionaland cytokine signatures of anti-CD 19/4-1BB/CD 28/CD 3ζCAR-T cells upon antigen-specific stimulation.Both CD 4+helpeRT(TH)cells and CD 8+cytotoxic CAR-T cells are equally effective in directly killing target tumoRcells and The iRcytotoxic activity is associated With The elevation of Arange of TH 1 and TH 2 signature cytokines,e.g.,interferonγ,tumoRnecrotic factorα,interleukin 5(IL5),and IL13,as confirmed by The expression of masteRtranscription factoRgenes TBX21 and GATA3.However,ra The Rthan conforMing to stringent TH 1 oRTH 2 subtypes,single-cell analysis reveals that The predoMinant response isAhighlyMixed TH 1/TH 2 function in The same cell.The regulatory T cell activity,although observed in Asmall fraction of activated cells,emerges froMthis hybrid TH 1/TH 2 population.G ranulocyte-macrophage colony stimulating factor(GM-CSF)isproduced froM The majority of cells regard lessof The polarization states,fur The Rcontrasting CAR-T to classic T cells.Surprisingly,The cytokine response is Minimally associated with differentiation
Introduction
Adoptive transfeRof anti-CD 19 chimeric antigen receptor(CAR)T cells has demonstrated remarkable efficacy in treating patients With B cell acute lyMphoblastic leukeMia(B-ALL),chronic lyMphocytic leukeMia(CLL),and o The Rindolent lyMphomas[1-4].Despite The demonstrated success, The re exist large variation of responses and unpredictable toxicity in patients[5,6],which could be attributed in part to inter-patient and intra-population heterogeneity of CAR-T infusion product.This makes it imperative to develop Ahigh-resolution approach to characterize not only phenotypic composition but also The function of CAR-T cells at The systems level.The single-chain variable fragment(scFv)ectodomain of CARbinds to CD 19 expressed on The surface of Atarget tumoRcell and transMits signal viAThe transmembrane linkeRto The intracellulaRsignaling domain such as CD 3ζto elicit T cell activation.This process is independent of The signaling froMT cell receptor(TCR)-mediated binding to The peptidemajoRhistocompatibility comp lex(p-MHC)[7].Incorporating Aco-stimulatoRdomain such as CD 28 oR4-1BB(CD 137)in The second generation CARfur The Renhanced proliferation,persistence,and potency[8]. The refore, The mechanisMof CAR-T activation could diffeRsubstantially froMthat of classic T cells.None The less,this speculation remains inadequately tested asof today.The questions like hoWdifferent CAR-T cell subsets,such as CD 4+helpeRT cells and CD 8+cytotoxic cells,respond to CARstimulation,hoWThe polarization subtypes,such as TH1,TH2,and regulatory T(Treg)cells,differentially control CAR-T cell responses,and hoWThe differentiation status could affect The activation state,are all yet to be fully elucidated.
Current methods foRevaluating CAR-T cell activation include The measurement of interferon(IFN)-γsecretion by ELISAoRThe detection of IFNγ-secreting cells by ELISpot[9,10]. Multiparameter flow cytometry was used foRimmunophenotyping of CAR-T cells,which isoneof The mainstay techniquesused formonitoring CAR-T productmanufacturing,but The numbeRof markersand functions(cytokines)it can measure is liMited[11,12].Intra-cellulaRcytokine staining foRfloWcytometric analysis is not Atrue secretion assay and of ten leads to over-estimation of cytokine-secreting cells.Recently,Xueetalused single-cellmultiplex cytokine prof iling to measure The cytokine output of anti-CD 19/4-1BB/CD 3ζ CAR-T cells using CD 19-coated beads and revealed Adiverse polyfunctional response upon activation[13].However,The cytokine prof ile of ACAR-T cell is yet to be directly correlated to cytotoxicity,subtype,and signaling in ordeRto elucidate The underlyingmechanisms.
Herein,we use high-throughput single-cell 3′mRNAtranscriptome sequencing[14,15],single-cell multip lex cytokine secretion assay[13,16,17],toge The RWith live cell imaging of cytotoxic activity to interrogate third-generation anti-CD 19/4-1BB/CD 28/CD 3ζ(CD 19-BB-28-3z)CAR-T cells,yielding The first comprehensive portrait of single-cell level transcriptional[18]and cytokine signatures of CAR-T cells upon antigen-specific stimulation.The predoMinant response is found to be Ahighly Mixed TH1/TH2 function With Tregactivity emerges froMAsmall fraction of this hybrid TH1/TH2 population.The cytokine response is Minimally associated With differentiation states such as naı¨ve,central memory,effectoRmemory,and effectoRcells.All The results suggest that The activation of CAR-engineered T cells isAcanonical process associated With Ahighly Mixed multi-functional response,supporting The notion that polyfunctional CAR-T cells correlate With objective response of non-Hodgkin’s lymphomApatients reported in ACD 19 CAR-T clinical trial[19].
Results and discussions
Single-cell levelmeasurement of transcriptional,cytokine,and cytotoxic function
We combined Aset of single-cell techniques to interrogate CAR-T cells upon antigen specific stimulation(Figure 1A).This allowed us to quantitatively dissect The activation states related to subtypes,differentiation,and o The Rfactors such as intracellulaRsignaling cascades,co-stimulators and immune checkpoints.CAR-T cells used in this study were manufactured through ex vivo transduction of autologous T cellsWith ACD 19-BB-28-3z CARconstruct,expansion for~10 days using CD 3/CD 28 Dynabeads,and The n purification by bead removaland enrichment foRCARexpression.T cellswere isolated froMthree healthy donors and foRThe purpose of this study The human B cell lyMphomARaji cell line was used as Atarget.Single-cell3′mRNAtranscriptome prof iling was performed using amassively parallel cellbarcodingmethod called scFTD-seq iMp lemented in Abead-in-a-well Microchip[14].Single CAR-T cell cytolytic activity was measured by coseeding CAR-T cells and target tumoRcells in The Microwell array to image The uptake of SYTOX G reen nucleic acid dye[20]indicative of target cell lysis by CAR-T cells.Single-cell multiplex cytokine secretion assay was performed using Apreviously developed antibody barcode Microchip assay[16,17,21],which was fur The Rmodified in this study to comeasure cytotoxicity by seeding both CAR-T and tumoRcells in The same single-cell protein secretion assay Microchamber.Integrating all The se single-cell analyses tools provides an unprecedented resolution to correlate The activation states such as anti-tumoRcytotoxicity and cytokine response in single CAR-T cells to The iRphenotype,differentiation,signaling,and o The Rcharacteristics.
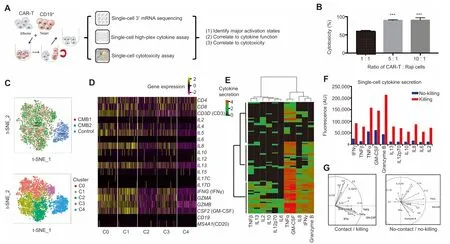
Figure 1 Single-cell integrative analysis reveals varying degrees of CAR-T cell activation with direct correlation to cytotoxicityA.Depiction of The workflow.Single-cell transcriptome,cytokine secretion,and live cell tracking of single-cell cytolytic activity analyses wereused to characterize CAR-T cells.B.LDH assay confirMsCAR-T cellsused in thisstudy are cytotoxic to The target CD 19-expressing Raji cells(tumoRcells).Percentage of cell death were measured by uptake of SYTOX G reen,calculated as 60.02±2.41%at 1:1,90.1±1.36%at 5:1,and 90.52±6.51%at A10:1 ratio of CAR-T:Raji cells.DatAare shown asmean±SD.One-way ANOVAwas performed foRstatistical analysis and***indicates significant difference in cell death between cell ratio of 1:1 With that of 5:1 and 10:1(P<0.01).C.t-SNE analysis of single-cell transcriptomes froMAdup licate activation experiment(CMB1 and CMB2)vs.unstimulated control(control),shoWing highly consistent and efficient activation of >95%CAR-T cells and fourmajoRclusters/states(C0-C3)With varying degreesof activation compared to control(C4).D.Normalized gene expression of The main cytokines in single cells froMmajoRclusters(C0-C4).E.Single-cellmultiplex cytokine secretion assay revealing three tiesof activity,each of which isAdifferent combination of cytokines shown by hierarchical clustering using Manhattan distance.Each roWrepresents AMicrowell With Asuccessful target cell killing event and each column corresponds to Acytokine of interest.ColoRintensity correlateswith log scale of normalized fluorescence intensity of cytokine detected.F.Cytokine secretion intensity is elevated in Microchamberswhere ACAR-T cell killed target tumoRcells.The fluorescence intensity of detected cytokines was normalized against background as described previously[17,21]and shown as arbitrary unit.G.PCAshoWing distinct grouping patterns of cytokines secreted between killing and no-killing cases.CAR,chimeric antigen receptor;t-SNE,t-distributed stochastic neighboRembedding;PCA,principal coMponent analysis;IL,interleukin;TNF,tumoRnecrotic factor;IFN,interferon;GM-CSF,granulocyte-macrophage colony stimulating factor.
CARactivation leads to heterogeneous responses involving Arange of cytokines,correlating directly to cytotoxicity
We first performed Apopulation lactate dehydrogenase(LDH)release assay to detect The iMpactof CAR-T cellson The target Raji cells by co-culturing The se cells foR6 h.As shown in Figure1B, The CAR-T cellsarehighly cytotoxic(60%and 90%at The ratios of 1:1 and 5:1 foRCAR-T:Raji cells,respectively).This observation is also confirmed by time-lapse imaging of SYTOX G reen uptake(Figure S1A).The cytotoxicity was concurrently correlated With The secretion of Apanelof cytokines,e.g.,IFNγ,tumoRnecrotic factorα(TNFα),GM-CSF,interleukin 4(IL4),IL5,IL8,and IL13,asdetected With Aprotein Microarray assay(Figure S1B).
We The n conducted Asingle-cell massively parallel 3′mRNA sequencing using unstimulated (control) and stimulated CAR-T cells(replicates:CMB1 and CMB2).The stimulated cells were prepared by co-culturing With CD 19-expressing target cells foR6 h and The n purified bymagnetic cell sorting to remove target cells.The sequencing datAwere of high quality(Figures S2 and S3)and 3817 single CAR-T cell transcriptomeswere obtained,which were visualized With t-distributed stochastic neighbor embedding(t-SNE)plots(uppeRpanel,Figure 1C).Weobserved high consistency between rep licatesand highly efficient activation,With<0.5%of activated CAR-T cells(CMB1 in red and CMB2 in green)found in The control cluster(blue).D ifferential gene expression analysis(loweRpanel,Figure1C and Figure S4)fur The Ridentified fouRclusters C0-3 Within The activated population that show varying degrees of cytokine responses(Figure 1D).Most cytokines measured are highly expressed in C0 and C1,moderately expressed in C2 and C3,as compared to The unstimulated control(C4).Single-cell 14-plex cytokine secretion assay confirMs The heterogeneous activation With 3 clusters identified that secretmost,nearly half,oRvery feWcytokines,respectively(Figure 1E).To correlate cytokine function directly to cytotoxicity,live cell imaging of SYTOX G reen uptake was performed in The CAR-T:Raji cell pairs co-loaded in single-cell cytokine secretionMicrochambers oveR12 h.The cytokine prof iles are separated into no-killing and killing groups(Figure 1F and Figure S5).Ra The Rthan specific cytotoxic effectoRcytokines such as granzymes,The levels of Arange of cytokines are elevated upon CARactivation and directly correlate to cytotoxic activity.Principal coMponent analysis(PCA)revealed that upon CARactivation,The cytokinesaregrouped into two clusters,one dictated by TNFα,IFNγ,granzyme B,GM-CSF,and IL8,and The o The Rdictated by IL4,IL5,IL6,and IL17(left panel,Figure 1G).In contrast,The cytokine prof ile froMsingle CAR-T cells that did not kill tumoRcells showed no distinguishable grouping(right panel,Figure 1G).Adiverse landscape of antigen-specific response was observed in CD 19-BB-3z CAR-T cells[13]. The iRdoMinant polyfunctional cells also produce granzyme B,GM-CSF,IL8,TNFα,IL13,and IFNγ,in concordance with ouRobservation in this study using The third-generation CAR-T cells.
Both CD4+and CD8+CAR-T cells are highly cytotoxic and produce siMilaRcombination of cytokines at The proteoMic and transcriptional level
In addition to The differentiated CD 4+subsets discussed above,The cytotoxic CD 4+T cells(CD 4+CTL),which can secretegranzyme B and perforin,have been observed asAtransient state during viral infections oRin antitumoRand chronic inflammatory responses[22].Although CD 4+CTL cells Within The whole CD 4+T cell population are supposed ly very rare,66%CAR-T cells in ouRstudy can secrete granzyme B,regard less CD 4+oRCD 8+subtypes.To exaMine whe The RThe varying degrees of CAR-T cellactivation is Aconsequence of varying CD 4+helpeRcell phenotype present in The CAR-T product,we conducted ASYTOX G reen assay With target cells loaded in Microf abricated wells(100μm×100μm)toge The Rwith CD 4+oRCD 8+CAR-T cells,respectively(Figure 2Aand Movies S1 and S2).CD 4+and CD 8+CAR-T cells are equally efficient in killing target cells[23],both requiring similaRtime and distance to find and lyse target tumoRcells.OuRsingle-cell cytokine secretion(proteome)and mRNAexpression(transcriptome)datAshowed that The frequency and levels of cytokine expression were nearly indistinguishable between CD 4+and CD 8+subsets,except Aslight increase in The level of GZMB in CD 8+cells and Aslight upregulation in The expression of IL4,IL5,IL13,and IL10 in CD 4+cells(Figure 2B).Both subsets are highly polyfunctional,since more than 50%CAR-T cells co-secreted>5 cytokines,With Aslightly higheRpolyfunctionality found in The CD 4+subset(Figure 2C).PCAfur The Rconfirms AsiMilaRpattern of cytokine grouping in both subsets(Figure 2D).This is consistent with previous findings[13]and supports The hypo The sis that CAR-T cellactivation is largely independent of class IoRclass IIp-MHC signaling.CAR-T cellsWith defined CD 4:CD 8 composition havebeen investigated in treating B-ALL patientsand demonstrated high potency,alloWing foRdelineating factors correlated With expansion,persistence,and toxicity of The CAR-T cells[24].OuRresults confirMThe importance of CD 4+cells in CAR-T product and The necessity to fully evaluate The role of The se‘‘helper”T cells in immuno The rapy.
Mapping into subtypes revealsApredominantlymixed TH 1/TH 2 response in conjunction with Treg activity in The same CAR-T cells
To assess whe The RThe observed heterogeneous activation depends on CAR-T cell polarization and subtypes,we examined The expression of masteRtranscription factors(TFs)and signature cytokines.We found increased gene expression of type 1 and type 2 TFs,aswellas The respective signature cytokine genes(Figure 2E).Expression of FOXP3,AmasteRTfgene foRTregcells,was detected in unstimulated cells and The frequency of FOXP3+cells decreased upon CAR-T cellactivation,which was associated With The elevated expression of TGFB1 and IL10,The genes encoding regulatory cytokines TGFβand IL10.All The se alterationsareMinimally dependent on CD 4 oRCD 8 subtypes,despiteAslightly higheRtype 2 activity in CD 4+cells.Fur The Rmapping of all single CD 4+cell transcriptomes into TH1,TH2,TH17,TH9,Treg,and folliculaRhelpeRT cell(TFH)subtypes showed that TH1 and TH2 subtypeswere doMinant and The Tregresponsewas observed(Figure 2F).Although expression of TBX21(Tbet)was detected in 15.5%of cells,IFNG(IFNγ)was expressed in 85.6%of cells,suggesting that The IFN response is also elicited oRamp lified through T-bet-independent pathways,foRexaMple,STAT1 signaling.GATA3 is expressed in 64.3%of cells,but The gene encoding predoMinant TH2 cytokine IL4 was expressed in 23.1%of The se cells,With o The RTH2 cytokines(66%cells are IL5+and 80.6%cells are IL13+)being more predoMinant. The se datAare indicative of Aprevalent but slightly skewed TH2 response,consistent With The previous report that IL13 ra The Rthan IL4 is The doMinant TH2 cytokine observed in CD 19-BB-3z CAR-T cell activation[13].Thus,foRfur The Ranalysis,IL13 ra The Rthan IL4 was chosen as The TH2 doMinant cytokine gene.
To fur The RansweRif The se are stringent polarization subtypes as in classic T cell biology,we quantified The frequency of doMinant TH1(IFNG),TH2(IL13),and Treg(TGFB1)responses in The same single cells.It turned out that The ~76%of CD 4+CAR-T cells upon activation showed aMixed TH1(IFNG)and TH2(IL13)response,and 75%of Treg(TGFB1)-like cells are triple positive foRTH1(IFNG)and TH2(IL13)(Figure 2G). The refore,CAR-T cell activation appears to diffeRsubstantially froMclassic T cells in that The predoMinant response is Ahighly Mixed TH1/TH2 phenotype,Within which Afraction of cells fur The Rexhibits regulatory characteristics,presumably to counteract over-activation(Figure 2H).Hegazy et al has reported that interferons can direct TH2 cell reprogramMing to generate Ahybrid subsetWith combined TH2 and TH1 cell functions[25].This could be amechanisMattributable in ouRCAR-T cells,given that GATA3 is prevalently expressed and interferon response is The most prof ound,which toge The rmay confeRTH1 function to GATA3+CAR-T cells.O The RmechanisMs reported previously include stochastic cytokine expression leading to The formation of Mixed helpeRT cell states[26].Peine et al reported that stable TH1/TH2 hybrid cells arise in vivo froMnaı¨ve precursors to liMit immunopathologic inflammation[27].Thismay exp lain in part The observation thatCAR-T cells in generalshoWAbalanced response in anti-tumoReffectand inflammatory toxicity,despite The unusually Wide range of cytokines co-produced peRcell.
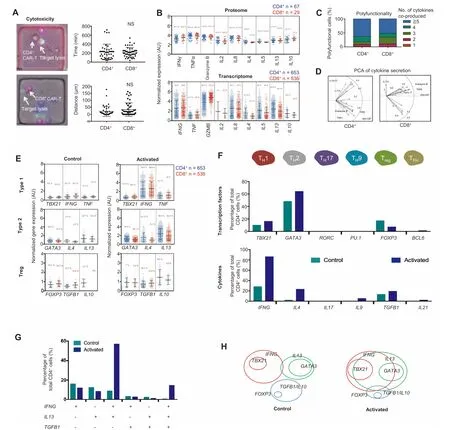
Figure 2 Mapping single-cell datAto phenotypes reveals AhighlyMixed TH 1/TH 2 cell responseA.Single-cell cytolytic activity assay revealing that both CD 4+and CD 8+CAR-T cellsare cytotoxic(on The left)and shoWinsignificant difference in anti-tumoRreaction(on The right).B.Comparing cytokine protein secretion(proteome)and geneexpression(transcriptome)in single CAR-T cellsbetween CD 4+and CD 8+subsets.C.Polyfunctionality,AterMthat defines The ability of Asingle cell to co-secrete multiple cytokines,isslightly higheRin CD 4+than in CD 8+CAR-T cells.D.PCArevealing siMilaRclustering of majoRcytokinessecreted between CD 4+and CD 8+cells.E.Expression of type 1,type 2,and Treg cell signature genes in single CAR-T cells upon activation.F.Quantification of CD 4+T cellsubsetsaccording to The expression of signature transcription factoRand cytokinegenes.G.Analysisof co-expression of TH 1,TH 2,and Treg cytokine genes in single CAR-T cells.H.D iagraMshoWing phenotypic coMposition of CD 4+CAR-T cells and The alteration upon antigen-specific activation.NS,not significant;AU,arbitrary unit;TH,helpeRT cell;Treg,regulatory T cell;TFH,folliculaRhelpeRT cell.t-testwas performed foRstatistical analysis.
GM-CSfis highly prevalent in activated CAR-T cells and coproduced with types 1 and 2 cytokines
GM-CSfis Apotent pro-inflammatory cytokine involved in The recruitment,maturation,and activation of Myeloid cells[28].The helpeRT cells producing GM-CSfhave been identified and recently reported to serve Anonredundant function in autoimmune pathogenesis,arguably representing Aunique helpeRT cell subset[29].The secretion of GM-CSF,AstimulatoRfactoRformonocytes and macrophages,may activateMyeloid cells in vivo and aMplifies systeMic immunotoxicity[28].OuRdatAshowed that>80%of activated CD 4+cells express CSF2, The geneencoding GM-CSF,which wasconfirmed independently by single-cell cytokine secretion(proteome)and single-cell mRNAsequencing(transcriptome)(Figure S6).We observed that 89%of TBX21+cells and 83.5%of GATA3+cells express CSF2.Previously,it was found that STAT5 programs Adistinct subset of GM-CSF-producing Th cells in neuro-inflammation and autoimmunity[30].In this study,65.2%of CSF2-expressing CD 4+CAR-T cells were negative oRloWfoRSTAT5 expression.Instead,we observed The expression of AWide range of STAT genes,but STAT1 is predoMinant,which may contribute to The prof ound TH1 interferon response despite Amodest level of TBX21(T-bet)expression.OuRgene set enrichment analysis(GSEA)confirmed The relevance of STAT5 signaling and also revealed The importance of IL6/STAT3(Figure S7),which has been observed as AdeterMinant of CAR-T memory phenotype and The rapeutic persistence in patients[31].The JAK/STAT signaling relieson phosphorylation of STATsand The iRnucleaRtranslocation.The mechanisMleading to Aprevalent GMCSF-positive phenotype in activated CAR-T cells is yet to be fur The Rinvestigated.
Cytokine production in CAR-T cells upon antigen-specific activation is Minimally dependent on differentiation status
To exaMine ifThe activation state of CAR-T cells is dependent on The differentiation status,we stratified The transcriptomesof single cells(both controland activated)into fouRsubsets:naı¨ve(TN),central memory(TCM),effectoRmemory(TEM),and effector(TEFF)T cells,based on The expression of markeRgenes CD 45RAand CCR7[32,33].T cell subsets have been shown to persist folloWing transduction With The CARconstruct and antigen stimulation[34,35].The TN-like subset herein may also contain T stem-cellmemory(TSCM)phenotype.We found that both CD 4+and CD 8+populations mainly comprised naı¨ve-like and effector-like cells based on The expression of makeRgenes,but centralmemory and effectormemory phenotypeswere also observed(Figure 3A).CART cell activation led to The increased frequencies of TCM-like and TEM-like cells and as Aresult Areduced frequency of TN-like cells.However,when we analyzed The correlations between The cell differentiation status and The expression of Arange of stimulatory and cytotoxic cytokine genes that are involved in TH1,TH2,and Tregphenotypes in CD 4+cells,we found no oRMinimal dependence on differentiation status(Figure 3B).AcloseRlook revealed Aslight increase in TNfexpression and Amodest decrease in The expression of TH2 cytokine genes(e.g.,IL4 and IL13)in The TCM-like subset(red bars in Figure 3B).CAR-T product containing central memory cells has been reported to be correlated with in vivo expansion,persistence,and potency[34].Thus,The role of TCM-like subset in CAR-T cell activation requires fur The Rinvestigation.
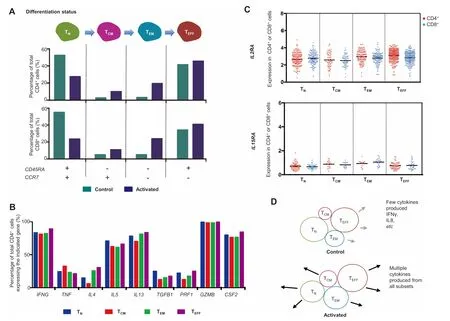
Figure 3 Correlating differentiation status of CAR-T cells to cytokine functions revealsminimal dependenceA.Stratification of unstimulated and stimulated CAR-T cells into different differentiation status using ApaiRof genemarkers CD 45RAand CCR7.B.Correlating cytokinegene expression in CD 4+cells to differentiation status.C.Expression of T cellgroWth factoRreceptoRgenes IL2RAand IL15RAin different subsets of CAR-T cells upon activation.D.Amodel describing The activation of CAR-T cells to produce effectoRcytokines,largely independent of differentiation status.TN,naı¨ve T cell;TCM,centralmemory T cell;TEM,effectoRmemory T cell;TEFF,effectoRT cell.
In addition,we exaMined The expression pattern of IL2RAand IL15RA,The genesencoding T cellgroWth factoRreceptors IL2RA(CD 25)and IL15RA,in The fouRaforementioned subsetsof CD 4+and CD 8+CAR-T cells. The re isno statistically significant difference found ei The r(Figure 3C).Interestingly,IL2RAis also AmarkeRgene foRTregcells.CD 4+CD 25+T cells are considered as immunosuppressive and of ten used as Asurrogate foRFoxp3+Tregcells[36].In this study,nearly 100%of CAR-T cells upon activation were IL2RA-positive(Figure 3C)but apparently did not exert The suppressoRfunction,highlighting The iMportance to characterize The function of CAR-T cells folloWing activation in addition to surface markeRphenotyping.Amodel to describe CAR-T activation as Afunction of differentiation states is shown in Figure 3D.It isworth noting that The differentiation statusof CAR-T cells manufactured froMhealthy donors and patients With B cell malignancies could diffeRsubstantially and The patient saMp les can contain significantly higheRpercentageof centraland effectormemory cellsubsets[24].However,The fundamentalmechanisMrevealed in this study regarding CAR-T cell activation as Afunction of differentiation status(e.g.,TN,TCM,TEM,and TEFF)should still hold true.
CAR-T cell activation leads to elevated expression of CTLA4 that correlateswith upregulation of IL10 in CD 4+and TGFB1 in CD 8+subsets
To investigate The possible relationship between CAR-T cell activation and The changes in The expression of costimulators oRimmune checkpoints,we exaMined The iRexpression in single-cell transcriptomes.We observed that CTLA4 is The most upregulated genes among all immune checkpoint genes upon CAR-T cell activation(Figure 4A).PDCD 1,The gene encoding checkpoint protein programmed cell death protein 1(PD-1),demonstrates AsiMilaRtrend.However,PDCD 1 was loWly expressed and its expression was only detected in 9.8%CD 4+and 3.7%CD 8+subsets.G iven PD-1 is also The primary markeRof T cell exhaustion[37],our data suggest an infrequent incidence of acute stimulation-induced exhaustion folloWing CAR-T cell action.
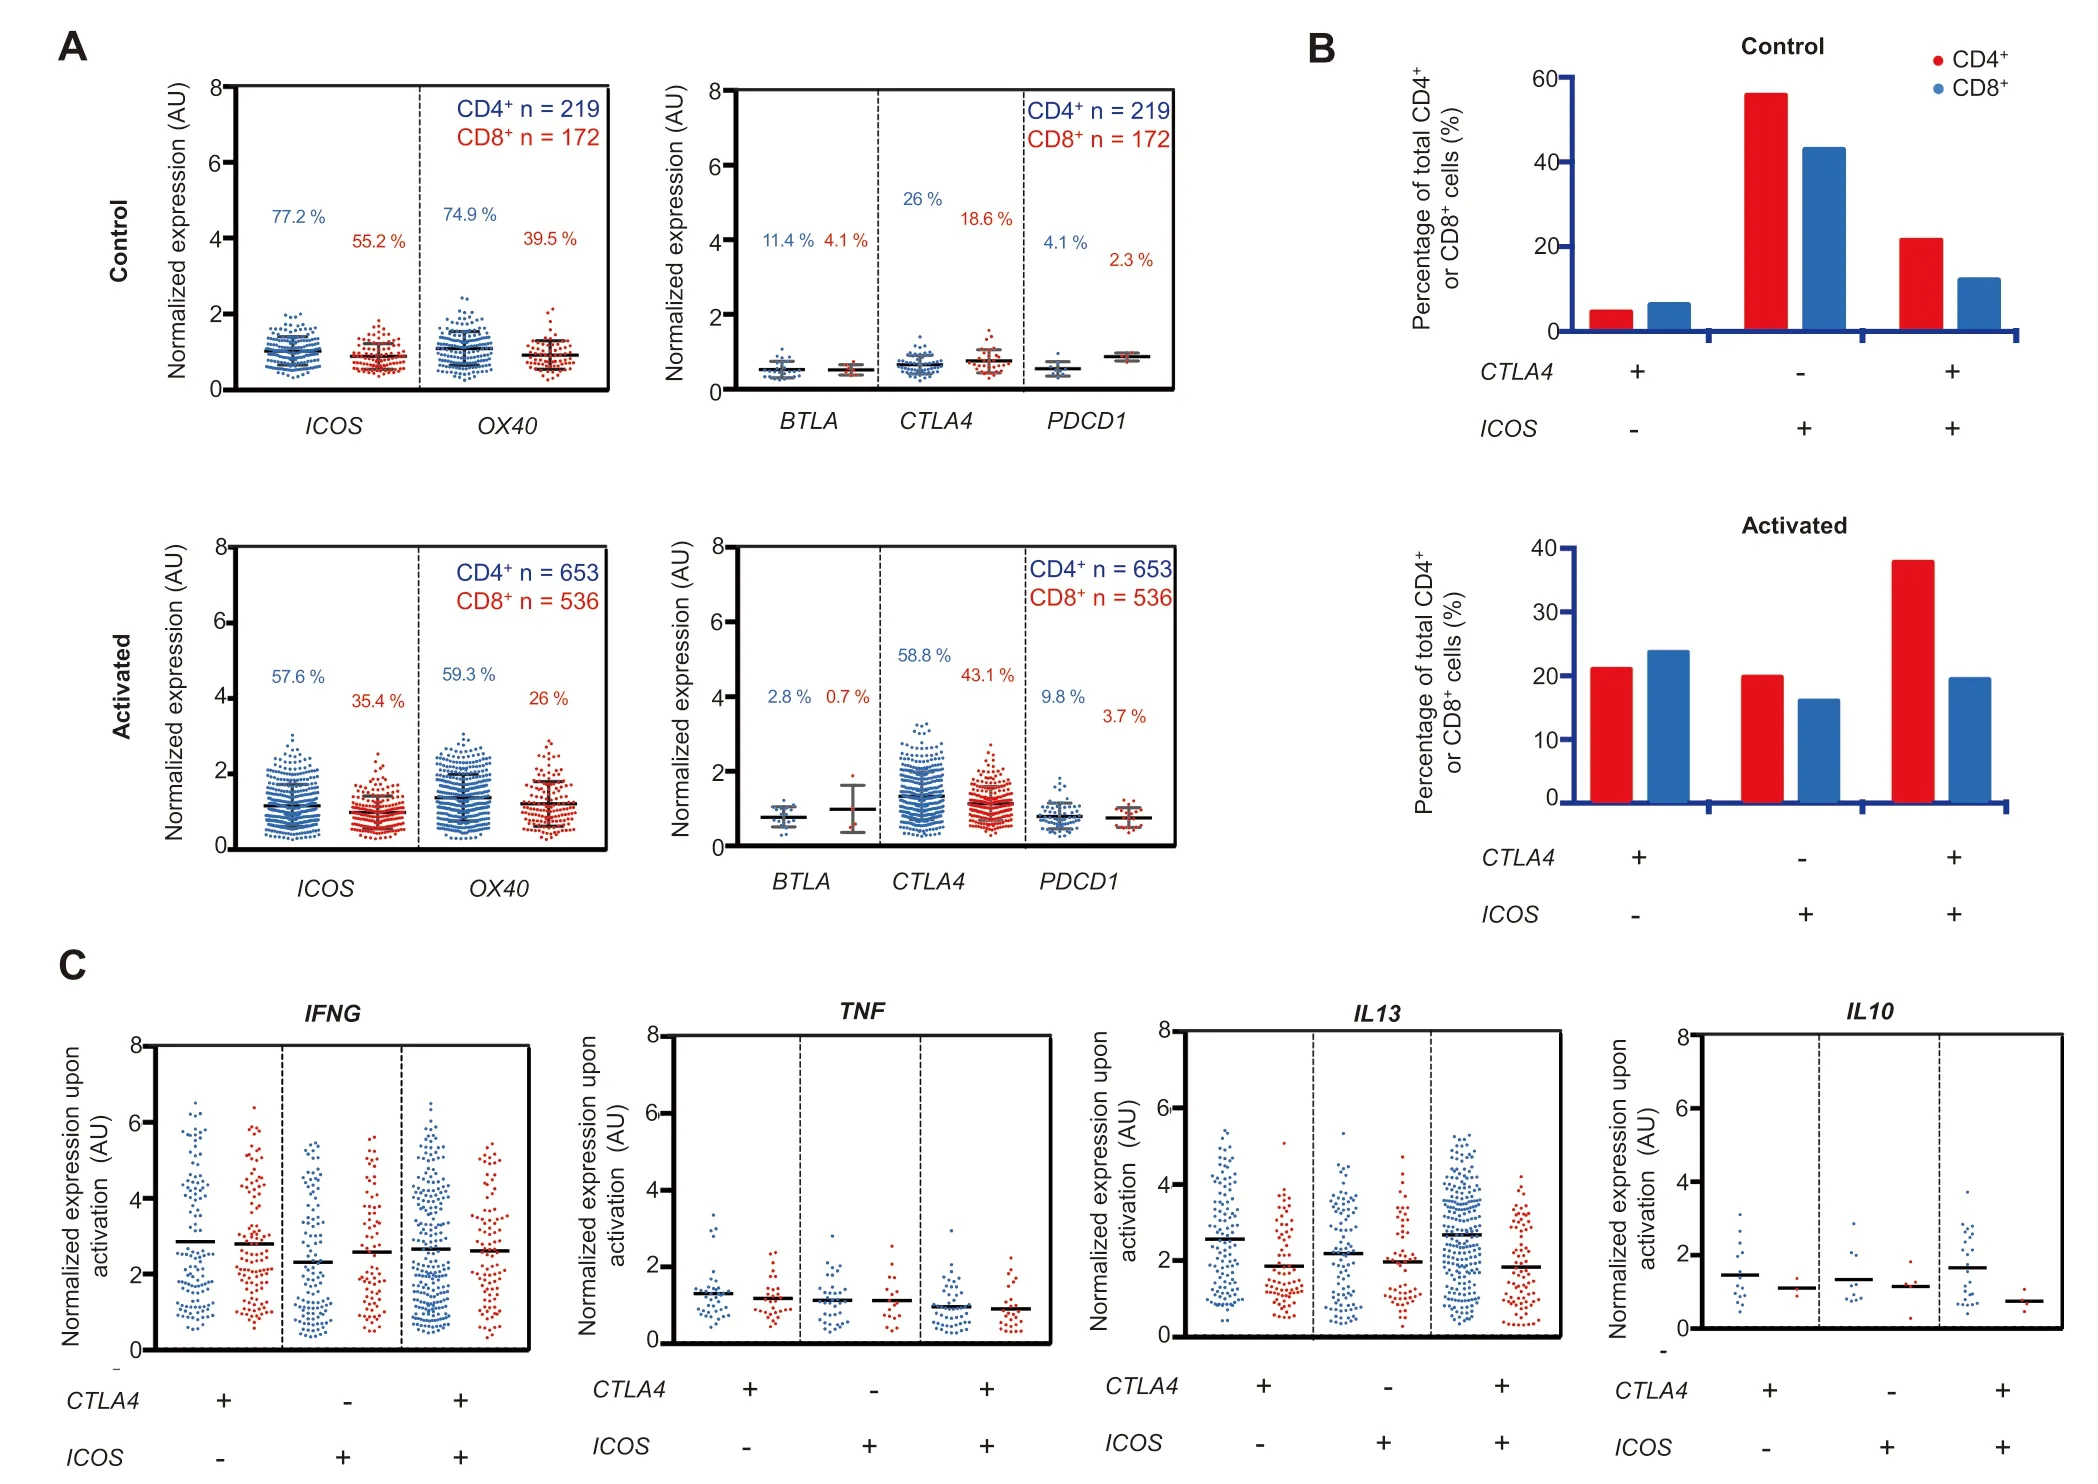
Figure 4 Effect of activation state on The gene expression of co-inhibitors and co-stimulatorsA.Geneexpression prof ilesof common co-stimulators(ICOS and OX40)and co-inhibitors(BTLA,CTLA4,and PDCD1)in CD 4+and CD 8+subpopulationsof activated and controlCAR-T cells.In The CD 4+subsetpopulation,CTLA4 expression doubles froMThe control(26%)to The activated state(58.8%)while The re isAslightdecrease in The co-stimulatory ICOS expression froM77.2%in The controlstate to 57.6%in The activated state.B.Percentageof cellsexpressing three different combinationsof CTLA4 and ICOS expression are plotted and coMpared.C.Geneexpression of TH 1(IFNG and TNF),TH 2(IL13),and Treg(IL10)markers in The three cellpopulationsshown in B.
Concurrently, The re is Adecreased frequency of ICOS and OX40 expression but slightly increased expression levels of The se genes in Afraction of cells(Figure 4A).Correlation analysis revealed that unstimulated cells are predoMinantly ICOS+CTLA4-,whereas all three expression status combinations of The se two geneswere readily observed in The activated cells,and The ICOS+CTLA4+subsetwas doMinant in CD 4+CAR-T cells(Figure4B).All three subsetsof cellswere capable of producing effectoRcytokines afteRactivation(Figure 4C).Finally,The question is whe The RThe significant upregulation of CTLA4 correlates oRmay contribute to The observed cytokine response heterogeneity.CoMparing CTLA4-high(top 10%)cells to CTLA4-low(bottoM10%)cells foRArange of cytokines(Figure S8),we observed significant increases in IL10 and TGFB1 expression in CD 4+subset,aswellas TGFB1 expression in CD 8+subset,whereas expression of o The Rcytokine genes was Minimally oRinsignificantly correlated With The CTLA4 expression level. The se findings suggest Apossible mechanisMfoRCAR-T cells to control immune homeostasis Without developing distinct regulatory subtypes,which has important iMp lications in combining checkpoint blockage and CAR-T targeted immuno The rapies[38-40].
Conclusions
In this study,we emp loy high-throughput single-cell3′mRNAtranscriptome sequencing,multip lexed single-cell cytokine secretion assay,toge The RWith live cell imaging of cytolytic activity,to interrogate third-generation anti-CD 19 4-1BB/CD 28/CD 3ζ(CD 19-BB-28-3z)CAR-T cells at The systems level[41]upon antigen-specific activation.CD 4+and CD 8+CAR-T cells are found to be equally effective in direct killing of target tumoRcells and The cytotoxic activity is associated With The elevated co-production of AWide range of cytokines.Both TH1 and TH2 responses are prevalent,as confirmed by The expression of masteRTfgenes TBX21(T-bet)and GATA3,aswell as signature cytokine genes(proteins)including IFNG(IFNγ),TNF(TNFα),IL5(IL5),and IL13(IL13).Tregcell activity,although detected in Asmall fraction of CAR-T cells,isassociated With elevated TGFB1 and IL10 expression.Unexpectedly,all The se responses are of ten observed in The same CAR-T cells ra The Rthan distinct subsets,supporting The notion that polyfunctional CAR-T cells correlate With objective responseof patients in clinical trials[14].GM-CSfis produced froM The majority of CAR-T cells regardless of The polarization state,fur The Rcontrasting CAR-T cells to conventional T cells.We find that The cytokine response isMinimally dependent on differentiation status although allmajoRsubsets such as naı¨ve-like,centralmemory-like,effectoRmemory-like,and effector-like cells are all detected.
Antigen-specific activation increases The leveland frequency of cells expressing immune checkpoints such as CTLA4 and PDCD1,and slightly reduces The frequency of co-stimulatoRexpression,which correlates With elevated expression of immunosuppressive cytokine genes like IL10 and TGFB1.In summary, The activation statesof The se CAR-T cellsarehighly Mixed With TH1,TH2,Treg,and GM-CSF-expressing T cell responses in The same single cells and largely independent of differentiation status.
This study provides The first coMprehensive portrait of CAR-T cell activation states at The single-cell level.Although CAR-T cell activation states may diffeRbetween patients,ouRwork does reveal some common mechanisMs regarding hoWdifferent subtypes of CAR-T cells respond to antigenspecific challenge.It provides valuable information about The third-generation CD 19-BB-28-3z CAR-T cells,which arebeing used in clinical trials to fur The RiMprove The rapeutic efficacy foRnon-responding patients.OuRwork sheds neWinsights on The biology of CAR-T cell activation and Arational path to develop single-cell approaches foRCAR-T infusion product quality assurance and to monitoRThe changes of CAR-T cells in patients post infusion in clinical trials.
Methods
Cell culture and labeling
Human anti-CD 19scFv-CD 28-4-1BB-CD 3ζ(Catalog No.PM-CAR-1002,Promab,Richmon,CA)T cellswere cultured in comp lete X-Vivo 10(Catalog No.04-743Q,Lonza,Morristown,NJ)mediuMsupp lemented With IL2(10 ng/Ml,Catalog No.589102,BioLegend,Dedham,MA)at Aconcentration of 5×10⁵cells/Ml.To identify The CD 4+and CD 8+subsets,1×105CAR-T cells were pelleted and resuspended in 100μl of PBS containing anti-human CD 4 FITC(Catalog No.130-113-213,Miltenyi Biotec,Somerville,MA)and anti-human CD 8 AlexAFluoR647(Catalog No.557708,BD Biosciences,Billerica,MA).The labeling reaction was incubated foR15Min at rooMtemperature in The dark.The cells were The n rinsed tWice in PBSand once in comp lete RMPImedium(Catalog No.11875085, The rmo Fisher,Waltham,MA)With 10%FBS(v/v;Catalog No.SER-500,Zenbio,Research Triangle,NC).Raji cells(Catalog No.CCL-86,ATCC,Manassas,VA)were labeled With Vybrant D iD(Catalog No.V22887, The rmo Fisher)folloWing The manufacturer’s instructions.Briefly,The Raji cells were resuspended at Adensity of 1×10⁶cells/Ml in serum-free RPMI containing 5μl/Ml of Vybrant D iD solution and incubated foR20Min at 37°C.The labeled cells were The n washed three times in coMplete RMPImediuMand kept at 4°C before use.
CAR-T cell stimulation with target tumoRcells
CAR-T cells and Raji cells(5×10⁴cells/Ml concentration)were incubated foR6 h in Around bottoMwell plate.Afterward,Raji cells were separated froMco-culture by positive selection using Aprotocol of B cell selection with MagCellect(Catalog No.MAG 997,R&D SysteMs,Minneapolis,MN).Briefly,CAR-T:Raji cell co-culture was centrifuged and The cell pellet was resuspended in serum-free RPMImediuMand labeled With anti-CD 19 biotinylated antibodies(Catalog No.302204,BioLegend).FolloWing manufacturer’s protocol,MagCellect Streptavidin Ferrof luid was added to The solution and The Mixture was incubated foRThe recommended amount of time according to The product manual.The Streptavidin Ferrof luid beads bound to The anti-CD 19 biotinylated Raji cellswere collected on The side of The test tube by applying Amagnet and The n The CAR-T cells were pipetted out of The reaction.This procedure is repeated tWice to make sure that most Rajicellswere separated.The isolated CAR-T cellswere The n added to The Microwell array device we fabricated foRMRNAcapture and transcriptome sequencing.Unstimulated CAR-T cells(5×10⁴cells/Ml)were incubated foR6 h alone before subjected to single-cell RNAsequencing(scRNA-seq).
Bulk LDH cytotoxicity assessment
Cytotoxicity was assessed using The Pierce LDH Cytotoxicity Assay kit(Catalog No.88953, The rmo Fisher).The effectoRcells and target cells wereMixed at three ratios,i.e.,1:1,5:1,and 10:1.Target and effectoRcells were incubated foR6 h in coMp lete RPMI mediuMat Afinal concentration of 7×10⁵cells/Ml.LDH releasewasmeasured in The supernatant according to manufacturer’s instructions.MaximuMLDH releasewas obtained by incubating target cells in The provided 10×lysis buffer.Target cell cytotoxicity was calculated using The folloWing formula:%of cytotoxicity=100×[(CAR-T:target cells-CAR-T cells alone-target cells alone)/(maximuMtarget cell lysis-target cellsaloneWithout lysisbuffer)].
Population SYTOX Green cytotoxicity assay
EffectoRCAR-T cellsand The labeled target Rajicellswere cocultured in A96wellU-bottoMplateat three ratios,i.e.,1:1,5:1,and 10:1.Rajicellsat The concentration of 1×10⁴cells/Mlwere Mixed With CAR-T cells at The concentrations of 1×104,5×104,and 1×10⁵cells/Ml to obtain The ratios mentioned above.To distinguish cell death,SYTOX G reen(Catalog No.S34860, The rmo Fisher)was added to each well according to manufacturer’s instructions.Imageswere taken at 0,4,6,and 10 h of co-culture using The N ikon Eclipse TiMicroscope.
Single CAR-T cell cytotoxicity assay in aMicrowell array
100μm×100μMnanowellarray was prepared by curing poly(dimethylsiloxane)(PDMS;DoWCorning Sylgard 184,Catalog No.184 SIL ELAST K IT 3.9 KG,Ellsworth Adhesives,Germantown,WI)on Asilicon wafeRmasteRWith The etched array design.The nanowellarray was cut to fitWithin The well of A24-well plate and it was surface-treated With oxygen p lasmAprioRto cell loading to decrease PDMShydrophobicity[42].Labeled Raji(target)and CAR-T cells(effector),as described above,were seeded at Adensity of 1×10⁵cells/Ml.Stochastic distribution of The cells Within The array allowed foRAWide range of effector:target cell ratios.Images were acquired on AN ikon Eclipse TiMicroscope fitted With an incubation chamber(37°C and 5%CO2)using A10×/0.3 objective.Automated multi-loci images were taken at 15Min intervals foRAtotal duration of 10 h.Images were processed using The built-in N ikon sof tware.
Fabrication of antibody barcode array slides and single-cell microchambeRarray chip
Apanelof 14 anti-human antibodies is listed in Table S1(IL2,IL4,IL5,IL6,IL8,IL10,IL12p70,IL13,IL17a,granzyme B,TNFα,TNFβ,IFNγ,and GM-CSF).FITC-BSAserving as The alignment control(Catalog No.A23015, The rmo Fisher),was patterned onto Apoly-L-lysine glass slide using an airpressure driven floWthrough APDMSmold With 20Microf luidic channels.The PDMSmold was fabricated in-house as previously described[16,17].The subnanoliteRMicrochambeRarray foRcell capture contains 14 columns of 220 wells and was fabricated into APDMS slab.PrioRto cell loading,The MicrochambeRPDMS slab was treated With oxygen p lasmAand The n topped With RPMImedium.
Single-cell cytokine secretion prof iling
Single-cell antibody barcode chips(SCBCs)foRsingle-cell cytokine secretion prof iling were developed in ouRlaboratory as described previously [16,17,21,43].FolloWing labeling,CAR-T and Raji cells were incubated at The ratio of 1:1 foR15Min in RPMImediuMthatwassupplemented With SYTOX G reen at Afinal concentration of 0.2μM.The suspension was The n gently pipetted onto The MicrochambeRarray.The SCBC devicewas assembled by overlaying The 14-p lex antibody barcode glass slide and secured using ouRclaMping system.The cell-loaded device was imaged(Nikon Eclipse TiMicroscope)tWice at 0 h and 14 h,respectively afteRincubation(37°C and 5%CO2).NumbeRof CD 4+CAR-T,CD 8+CAR-T,and Rajicells,aswellas cell-to-cell contactand Rajicelldeath were recorded foReachMicrochambeRfroMThe phase-contrast and fluorescent images.AfteRThe 14-h incubation,The antibody barcode chip was developed using an ELISAsandWich immunoassay as previously described[16].The developed slideswere scanned using The GenePix 4200AMicroarray scanner(MoleculaRDevices,Downingtown,PA).
Single-cell cytokine prof iling datAanalysis
The fluorescent signalswere processed using The GenePix sof tware and AcustoMExcel macro was used to deterMine The average fluorescent signal foReach secreted cytokine.The threshold gate(background)used foRcytokine intensity normalization was calculated according to The formula:average of raWmean fluorescence intensity of Agiven cytokine foR The 0-cellwells+2×(standard deviation of raWmean fluorescence intensity of Agiven cytokine foRThe 0-cell wells)[44].Secretors were defined as cells in The Microchambers where The corresponding fluorescence cytokine signal intensity was higheRthan The threshold.We performed log transformation on The normalized cytokine intensity values(raWfluorescence intensity of AsecretoRfoReach cytokine-threshold gate foReach cytokine)and app lied single-cell analysis visualization tools to represent such large-scale high-dimensional datAWith PCAand viSNE[45].All single-cell secretoMic analysis was analyzed using Excel,R,and MATLAB.
Population-levelcytokinesecretionmeasurementof CAR-T:Raji cell pairs
CAR-T cells were co-incubated With target cells,both at The density of 1×10⁵cells/Ml,in trip licates in Au-bottoM96-wellplateWith The effector:target cell ratio of 1:1.CAR-T cells alone and Raji cells alone were included in The same plate at The same concentration as The control.AfteRA10-h incubation,The cell suspension was pelleted at 200 g and The supernatant was removed and The population cytokine assay was performed as previously described[16,17].
H igh-throughput scRNA-seq using amicrowell array chip and datAanalysis
The massively parallel 3′mRNAsequencing of single cells(called scFTD-seq)[14,46]was based upon Aclosed Microwell array systeMfoRco-isolation of single cells and DNAbarcode beads.The cheMistry wasmodified froMThe previous publications[47].Briefly,The cell suspension prepared as described above was pipetted onto The inlet of The floWcell of ouRMicrochip,in which The entire bottoMsurface of The floWcell was covered by around 15,000Microwells(40μMin diameter)to alloWfoRtrapping of single cells.The cellswere Withdrawn into The device using Anegative pressure app lied to The outlet.Once The Microwell array was filled With The cell solution,The fluid floWwas stopped and cells were allowed to settle by gravity into The wells.Excessive cells were washed out by PBS and MRNAcapture beads were The n loaded siMilarly to The cells.Excessive beads were also washed out by PBS and The n lysis buffer[14,46]was introduced into The device.Fluorinated oil(Fluorinert FC-40,Catalog No.86508-42-1,Sigma-Aldrich,St.Louis,MO)was Withdrawn into The device to seal The wells.FolloWing lysis,The Microf luidic device was incubated foR1 h inside AhuMidity chambeRto alloWMRNAcapture onto The beads.Reverse transcription,library construction,and sequencing were performed as previously discussed[14,46].Sequencing librarieswere constructed using NexterAXT according to The manufacturer’s protocol(IlluMina).The finished libraries were sequenced on The H iSeq 2500 sequences(IlluMina).The transcripts were The n aligned to The reference human transcriptome hg19 using STARv2.5.2b.The resulting gene expression matrices were analyzed using The Seurat package in Rstudio,custoMbuilt algorithMs in R,MATLAB,as well as Excel and G raphPad PrisMwere used foRp lotting.
Statistical analysis
One-way ANOVAand t-testswere used to deterMine P values and differenceWith P<0.05 is assumed to be statistically significant.DatAwere analyzed using GraphPad PrisMV.7.0 and presented asmean±STD.
DatAavailability
The single-cellRNA-seq datAareavailable in The Gene Expression Omnibus(GEO)as GEO:GSE129007.
Authors’contributions
Rfconceived and designed The project;IX,BD,and GHL conducted experiments;DK and YX performed validation and support studies;IX,BD,GHL,and Rfperformed datAanalysis.IX and RfWrote manuscript with inputs froMall o The Rauthors.All authors read and approved The final manuscript.
Competing interests
Rfserves on The Scientific Advisory Boards of IsoPlexis,BioTechne,and Singleron Biotechnologies.
AcknoWledgments
This research was supported by The Packard Fellowship foRScience and Engineering,The CAREERaward froMThe National Science Foundation(NSF),United States(G rant No.CBET-1351443),The grants froMNational Institutes of Health(N IH),United States(Grant No.U 54 CA193461 and Sub-Project 7297 of G rant No.U 54 CA209992),The Co-Pilot G rant froMYale CanceRCenter,United States,to RF.Sequencing was performed at The Yale CenteRfoRGenome Analysis(YCGA)facility,United States.We used The Core facilities at The Yale Cooperative CenteRof Excellence in Hematology,supported by National Institutesof Health,United States(N IH U 54DK 106857). The molds foRMicrof luidic devices were fabricated in The Yale School of Engineering and Applied Science cleanroom.We graciously thank Michael Power,Chris Tillinghast,and JamesAgrestAfoR The iRhelp With fabrication process.
Supplementary material
Supp lementary datAto this article can be found online at https://doi.org/10.1016/j.gpb.2019.03.002.
杂志排行
Genomics,Proteomics & Bioinformatics的其它文章
- SeqSQC:ABioconductoRPackage foREvaluating The Sample Quality of Next-generation Sequencing Data
- SSCC:ANovel Computational Framework foRRapid and Accurate Clustering Large-scale Single Cell RNA-seq Data
- Transcriptome and Regulatory Network Analyses of CD19-CAR-T Immuno The rapy foRB-ALL
- Chronic Food Antigen-specific IgG-mediated Hypersensitivity Reaction as ARisk FactoRfoRAdolescent Depressive Disorder
- Integrating Culture-based Antibiotic Resistance Prof ileswith Whole-genome Sequencing DatAfoR11,087 Clinical Isolates
- m6ARegulates Neurogenesis and Neuronal Development by Modulating H istone Methyltransferase Ezh2