A Normal Contact Stiffness Model of Joint Surface Based on Fractal Theory
2019-06-12KuoXuYuanYuanandLihuaZhang
Kuo Xu,Yuan Yuan, and Lihua Zhang
Abstract: Based on the fractal theory,a normal contact stiffness model is established.In the model,the asperity is initially in elastic deformation under contact interference.As the interference is increased,a transition from elastic to elastoplastic to full plastic deformation occurs in this order.The critical elastic interference,the first elastoplastic critical interference and the second elastoplastic critical interference are scale-dependent.According to the truncated asperity size distribution function,the relations between the total normal contact stiffness and the total contact load are obtained.The results show the total normal contact stiffness depends on the range of frequency indexes of asperities.The normal contact stiffness in elastic deformation is major contribution to the total normal contact stiffness.When the first six frequency indexes are less than the critical elastic frequency index,the dimensionless load-stiffness relation approximately is .When the initial frequency index is greater than the critical elastic frequency index,the dimensionless load-stiffness relation approximately is .The comparison between the theoretical results and the experimental results indicates that the theoretical results are consistent with the experimental data;therefore,the present fractal model of contact stiffness is reasonable.
Keywords: Normal contact stiffness,asperity,frequency index,the joint surface.
1 Introduction
The joint surfaces exist widely in various engineering machines,such as machine tools,vehicles,hydraulic equipments,etc.In general,the joint surface is regarded as the smooth surface.In practice,the joint surface on which a large number of asperities can be observed at micro scale is not smooth,namely rough surface[Shroff,Ansari,Ashurst et al.(2014);Tian and Bhushan(1996)].The mechanical properties of rough surface play important role on contact stiffness of joint surface.In order to obtain the mechanical properties of rough surface,many models of contact between rough surfaces are developed in the past decades,such as the statistical model,the fractal contact model,the finite element method,the multi-scale model,etc.The statistical contact model firstly was presented by Greenwood et al.[Greenwood and Williamson(1966)].Subsequently,the statistical model is extended to different fields,such as elastic contact between spherical rough surfaces[Greenwood and Tripp(1967)],elastohydro-dynamic lubrication[Johnson,Green and Bogy(1987)],contact stiffness[Wen(2009)].In the statistical model,the radii of curvature of all asperities are considered to be identical and the height of the asperities follows the Gaussian distribution.And these parameters used to characterize the topography of rough surface,such as height,slope and curvature,mostly depend on resolutions of the instruments.Therefore,the predictions of the contact models based on these parameters may not be unique to a pair of rough surfaces.
Mandelbrot found that the topography of rough surface appears to be fractal characteristic by experimental method[Mandelbrot(1983)].Based on fractal properties,Majumdar,Bhushan(1990)simulated a two-dimensional profile of rough surface by Weierstrass-Mandelbrot function(WM function).Then,a fractal model of contact between rough surfaces was presented by them according WM function,called MB model[Majumdar and Bhushan(1991)].In the MB model,the radii of curvature of all asperities are different,which satisfies actual rough surface.The MB model was extended to the three-dimensional rough surface by Yan et al.[Yan and Komvopoulos(1998)].Because the analytic solutions of the MB model can be obtained conveniently,the MB model has been widely applied to various fields,such as microelectromechanical systems[Komvopoulos and Yan(1997)],the interface of spot welding between two materials[Han,Shan and Hu(2006)]and contact stiffness.Jiang et al.[Jiang,Zheng and Zhu(2010)]applied the MB model to calculate the contact stiffness of machined plane joint without friction.Based on the model of Liu et al.[Liu,Zhao,Huang et al.(2015)]presented a normal contact stiffness model considering friction.Then Chen et al.[Chen,Xu,Liu et al.(2016)]developed a fractal model of normal contact stiffness between two spherical joint surfaces considering friction factor.Wang et al.[Wang,Zhu and Zhu(2017)]extended the MB model to normal contact stiffness with asperity interaction.In these contact stiffness models,the plastic deformation initially takes place in the single asperity under contact load,and contact stiffness induced by inelastic deformation of asperities is ignored.The finite element method[Liu,Zhao,Huang et al.(2015);Amor,Belghith and Mezlini(2016)]and multi-scale method[Jackson and Jeffrey(2006);Ciavarella,Dibello and Demelio(2008)]have been applied to obtain mechanical properties of contact between rough surfaces.The models of finite element method and multi-scale method are close to real rough surfaces;however,they are difficult to directly calculate the contact stiffness.
In the paper,a normal contact stiffness model is presented.The critical interferences,such as the critical elastic interference,the first elastoplastic critical interference and the second elastoplastic critical interference,are scale-dependent.The mechanical properties of a single asperity are in accord with classical contact mechanics.The elastic,the first elastoplastic,the second elastoplastic and full plastic normal contact stiffness are obtained.An experiment of normal contact stiffness is devised to validate validity of theoretical model.
2 Normal contact stiffness model
2.1 Modeling and simulation of rough surface topography
Two rough surfaces of joint surface contact each other,which can be regarded as an equivalent rough surface in contact with a rigid flat surface[Greenwood and Tripp(1971)].The rough surface is assumed to be isotropic.Asperities are far apart and their interaction is not considered.The three-dimensional topography of equivalent rough surface exhibit fractal feature,therefore it can be simulated by a modified two-variable Weierstrass-Mandelbrot function[Yan and Komvopoulos(1998)]which is expressed as

whereLis the sample length of surface topography,zdenotes height of profile at any point(x,y).The parameterDis the fractal dimension,which is between 2 and 3 for a three-dimensional rough surface.The parameterGis a characteristic length scale of the surface.Normally the parameterγis chosen to be 1.5,which determines the frequencies density of the surface profile.The parameterMdenotes the number of superposed ridges on the rough surface.The parameternis the frequency index and its value is betweennminandnmax.The relation between maximum frequency index and minimum frequency index isandLsis the cut-off length of the order of about six lattice distances.φm,nis a random phase used to prevent the coincidence of different frequencies at any point of the surface profile.During the process of modeling and simulating the rough surface by W-M function,linspace()function can be used to generate linely spaced vector to avoid the deficiencies in the number of discrete points and it gives direct control over the number of points and always includes the endpoints.meshgrid(x,y)can be used to generate grid sampling points on the xOy plane Then the heights of rough surfacez(x,y)at any point(x,y)can be evaluated in MATLAB and the simulated topography of the rough surface is shown in Fig.1.
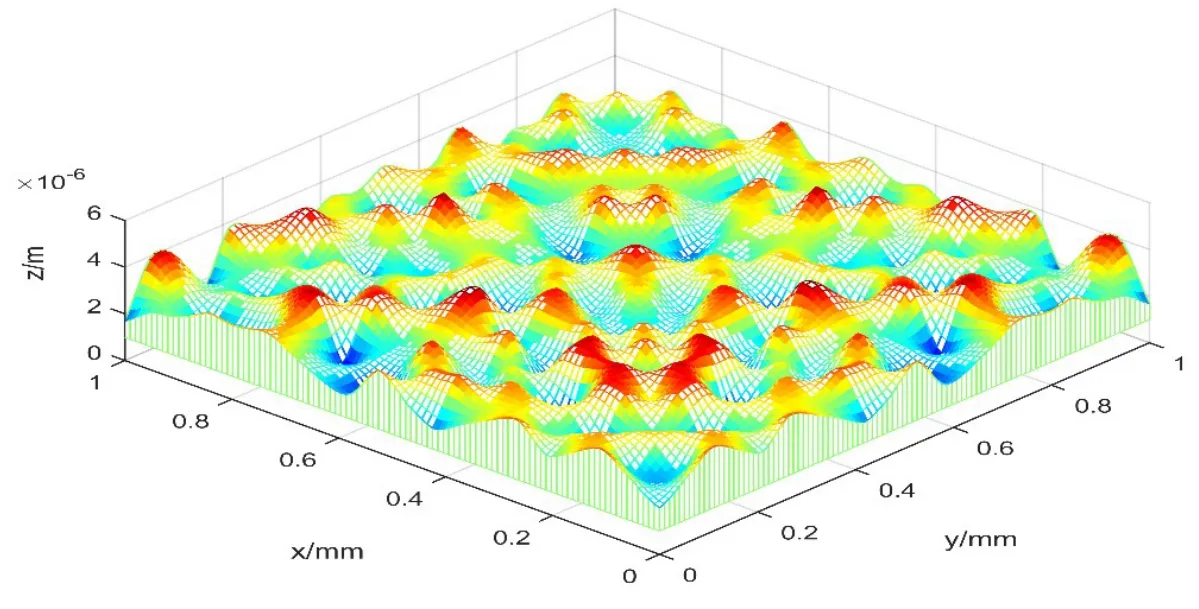
Figure 1:The profile of a three-dimensional rough surface simulated by W-M function
2.2 The Mechanical properties of a single asperity
Assuming only one ridge in the rough surface,the three-dimensional rough surface can be equivalent to the two-dimensional rough surface,therefore Eq.(1)can be reduced to Yan et al.[Yan and Komvopoulos(1998)]

In the equivalent rough surface,the profile of a single asperity with frequency indexncan be expressed as

And the height of single asperityδnis

The curvature radius at the peak of the single asperityRncan be written as

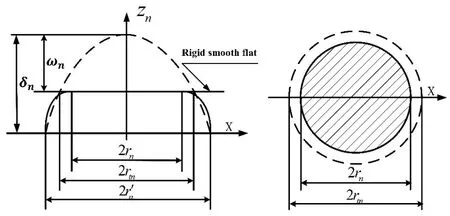
Figure 2:The contact between a single asperity and the rigid flat surface
Fig.2 shows that a single asperity with frequency indexnis in contact with a rigid flat surface,wheredenotes the asperity's base length;2rtnis the truncated length and 2rnis contact width;ωndenotes the interference of asperity.As the asperity is in elastic deformation,the relations between contact areaane,truncated areaand contact loadfnecan be written as


The normal contact stiffness of a single asperity with frequency indexnin elastic deformation is defined as

When the interferenceωnequals the critical elastic interferenceωnec,the inception of elastoplastic deformation appears in the asperity with frequency indexn.The critical elastic interference can be written as Chang et al.[Chang,Etsion and Bogy(1987)]

whereHdenotes the hardness of material which is related to its yield strength byH= 2.8σy.Kis the hardness coefficient which satisfies the equationK= 0.454+ 0.41υ.The parameterυis the Poisson's ratio of material andEis the elastic modulus.
When the height of asperityδndo not exceed the its own critical elastic interferenceωnec,namelyδn≤ωnec,the asperity is only in elastic deformation in complete contact process.T herefore the critical elastic frequency index can be obtained as

where int[ ]is the integer function that obtains the integer part of a numerical value.Therefore,only elastic deformation takes place in these asperities whose frequency indexes are betweennminandnec.
When the interferenceωnis betweenωnecand 110ωnec,the asperity with frequency indexnis in elastoplastic deformation.This process can be divided into two stages[Kogut and Etsion(2002)].In the first stage which the interference is betweenωnecand 6ωnec,the relation between contact areaanep1,truncated areaand contact loadfnep1can be written as

where the critical elastic contacts truncated area,the first critical elastoplastic contact truncated area.
The normal contact stiffness of a single asperity in the first elastoplastic deformation is defined as

In the second stage which the interferenceωnis between 6ωnecand 110ωnec,the relations between contact areaanep2,truncated areaand contact loadfnep2can be written as

where the second critical elastoplastic contact truncated area.
The normal contact stiffness of a single asperity in the second elastoplastic deformation is defined as


When the interferenceωnis greater than 110ωnec,the full plastic deformation takes place in the asperity with frequency indexn.The relations between contact areaanp,truncated areaand contact loadfnpcan be written as

The normal contact stiffness of a single asperity in the full plastic deformation is defined as

2.3 Normal contact stiffness
The truncated asperity size distribution function for these asperities with frequency indexnis defined as follows[Yuan(2017)]


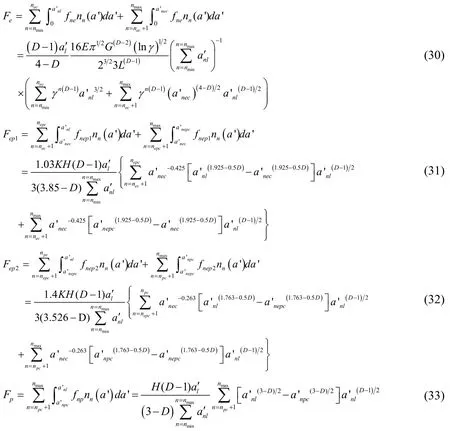
WhereKe,Kep1,Kep2andKpare portions of normal stiffness in elastic,the first elastoplastic,the second elastoplastic and full plastic deformation.Their expressions can be evaluated as
Similarly,the total contact loadFrcan be expressed as
whereFe,Fep1,Fep2andFpare portions of the total contact load in elastic,the first elastoplastic,the second elastoplastic and full plastic deformation.Their expressions can be evaluated as
For a given rough surface,the relation between the nominal areaAaand the sample length is written as

Therefore,the total normal contact stiffness and the total contact load in a dimensionless form are given as

2.4 Solution procedure of this present model
Through the above deduction,we can get the expressions of the total contact load and contact stiffness of the interface.Substituting the relevant parameters into those expressions gives the numerical solution which can directly reflect the contact stiffness properties of interface.The flow chart of the solution procedures is shown in Fig.3.Some crucial steps are summarized as follows:
(1)Prepare the calculation parameters including fractal dimension and fractal roughness,material parameters.
(2)Preset empty matrices to place some intermediate variables and the numerical results of contact load and stiffness for each deformation types.
(3)Input values of interferences as initial variable
(4)Compute the intermediate variables on which the calculation of final results depends.
(5)Judging the deformation type of each asperity.
(6)Compute contact load and stiffness of all asperities,namely the whole interface,for each deformation type.

Figure 3:Flow chart of solution procedure
3 Results and discussion
3.1 The effects of frequency index on the normal contact stiffness

Table 1:The calculation parameters
In order to obtain the relations between the total normal contact stiffness and the total contact load,these parameters for rough surface are shown in Tab.1.WhenD=2.4,G=1.36× 10⁻¹¹m,we can obtain the critical elastic frequency indexnec= 9,the first elastoplastic critical frequency indexnepc= 16,and the second elastoplastic critical frequency indexnpc= 24,respectively,according to Eqs.(11),(18)and(19).The Fig.4(a)shows the relation between the dimensionless total normal contact stiffness and the dimensionless total contact load when the range of frequency index is between 5 and 35 in Cartesian coordinate(Fig.4a(1))and Double-logarithmic coordinate(Fig.4a(2)),respectively.As the dimensionless total contact load is increased,the dimensionless total normal contact stiffness increases.Fig.4(b)shows the ratios of normal contact stiffness in different deformations to the total normal contact stiffness.When the dimensionless total contact load is less than 0.19×10⁻⁴,the ratio of normal contact stiffness in elastic deformation is greater than 90%.With an increase in the dimensionless total contact load,the ratio of normal contact stiffness in elastic deformation is decreasing and approaches 89.4% approximately.In the complete contact process,the value of ratio of normal contact stiffness in elastic deformation is maximum,the value of ratio of normal contact stiffness in full plastic deformation is minimum,and the value of ratio of normal contact stiffness in elastoplastic deformation is between them.Because the asperities of the first six frequency indexes are major contribution to rough surface[Yuan(2017)],the part of the total contact stiffness,namely,is major contribution to the total contact stiffness.Hence the dimensionless load-stiffness relation approximately is,which is in good agreement with classical result of Hertz.
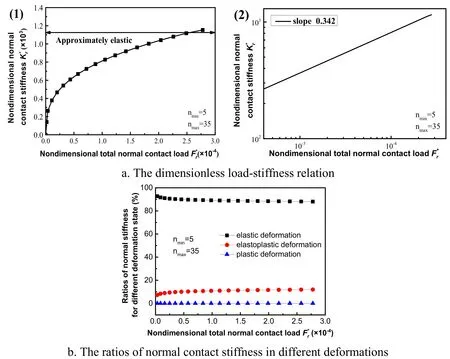
Figure 4:The relation between dimensionless total normal contact stiffness and dimensionless total contact load(nmin=5,nmax=35)
In the Fig.5,the range of frequency indexes between 15 and 45.In the Fig.5(b),in the complete contact process,the value of ratio of normal contact stiffness in elastic deformation is maximum.As the dimensionless total contact load is increased,the ratio of normal contact stiffness in elastic deformation decreases from 82.7% to 79.4%.In Fig.5a(1),when these maximum contact truncated areas of asperities whose frequency indexes range from 15 to 20 are less than their the critical elastic contact truncated areas,namely the dimensionless total contact load less than 1.79×10⁻³,is major contribution to the total contact stiffness. Therefore, the dimensionless load-stiffness relation is approximately.Elseis major contribution to the total contact stiffness,the dimensionless load-stiffness relation is approximately.In the Fig.6,the range of frequency index is between 25 and 55.The Fig.6(b)shows the ratios of normal contact stiffness in elastic and elastoplastic deformation equal approximately 69.4% and 30.5%,respectively,in complete contact process.In Fig.6(a),when the dimensionless total contact load less than 2.15×10⁻³,the dimensionless load-stiffness relation is approximately,else the dimensionless load-stiffness relation is approximately.From the power-law relations(Fig.4a(2)-Fig.6a(2))between contact stiffness and contact load,it can be seen that with the increase of inelastic deformation ratio of asperities,the exponent of power-law curve approaches 0.9 gradually,that is,the stiffness-load relation slowly moves towards linearity.The results are in consistent with the research by Roman et al.[Roman and Valentin(2013)].
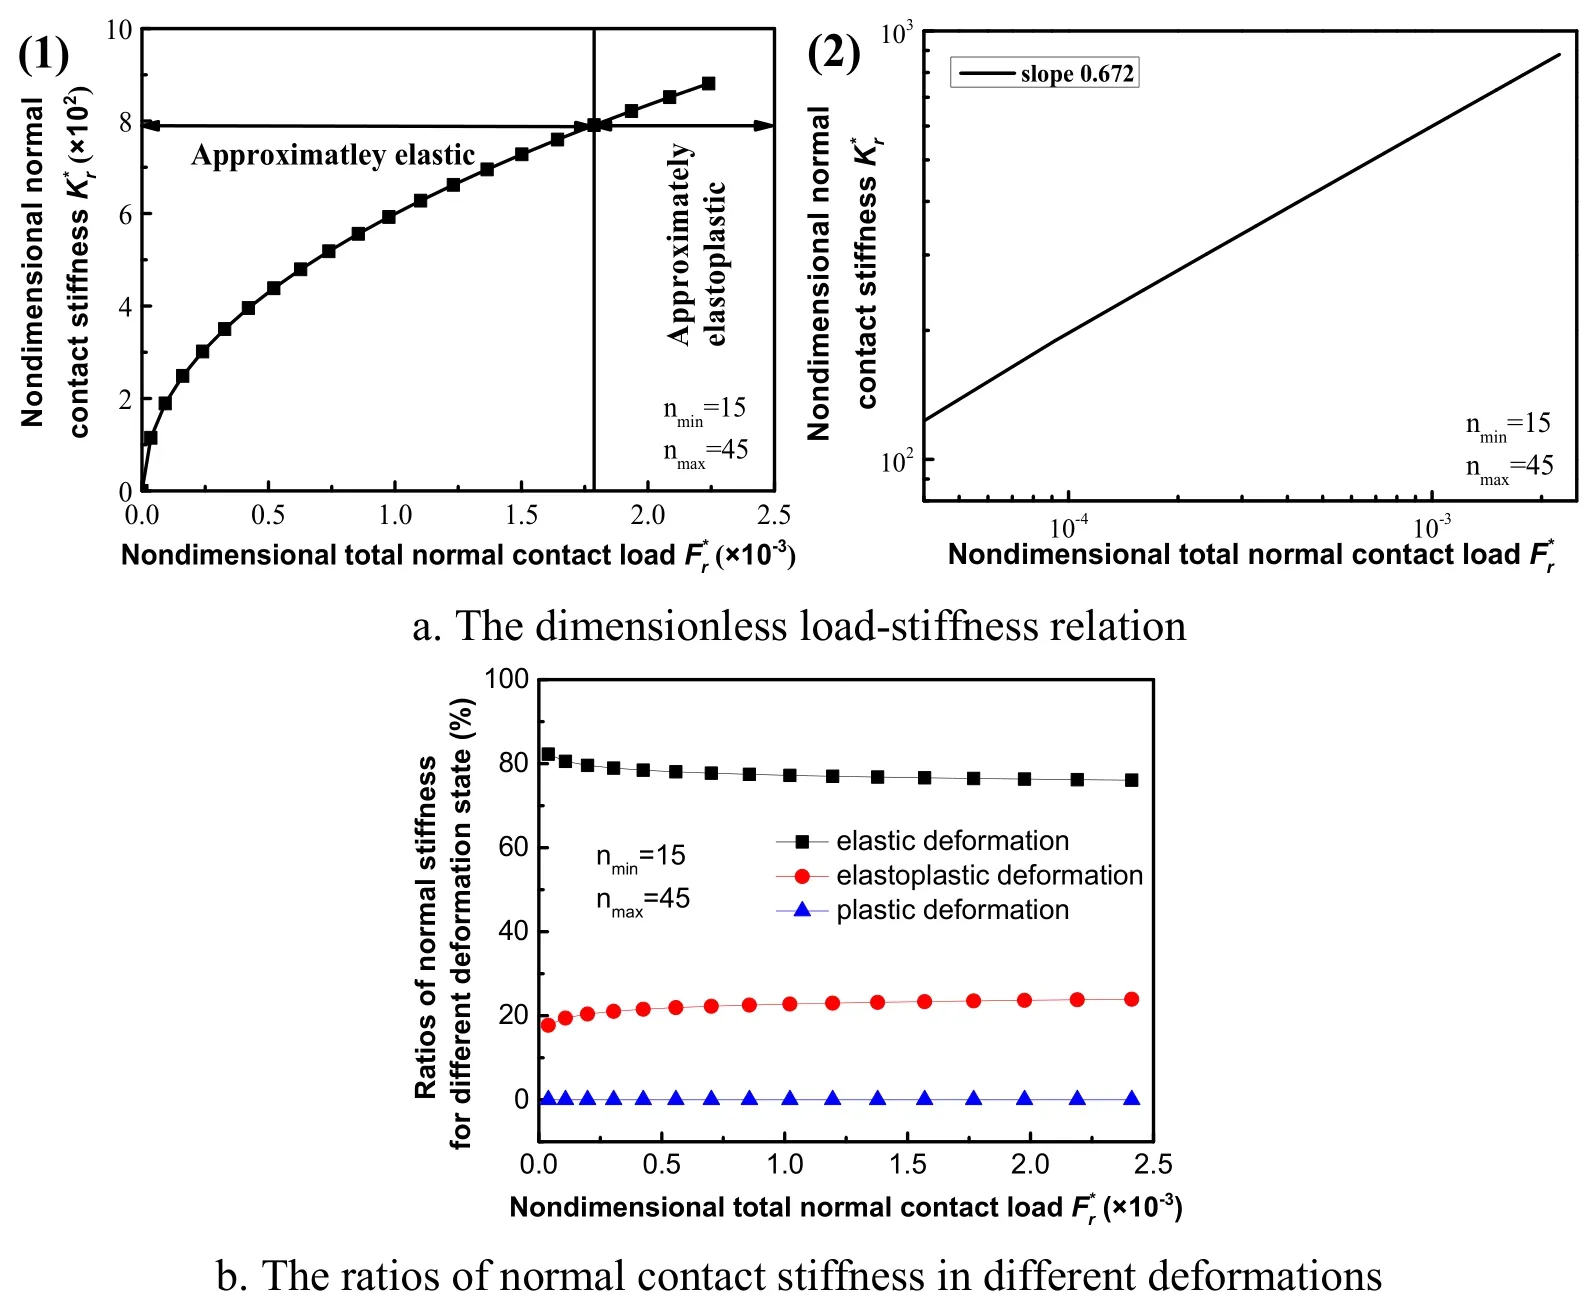
Figure 5:The relation between dimensionless total normal contact stiffness and dimensionless total contact load(nmin=15,nmax=45)
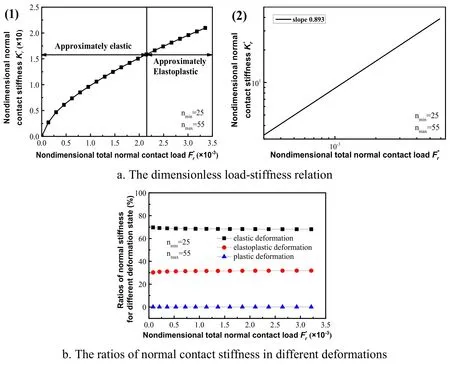
Figure 6:The relation between dimensionless total normal contact stiffness and dimensionless total contact load(nmin=25,nmax=55)
3.2 The effects of fractal parameters on the normal contact stiffness
When characteristic scale parameterG=1.36× 10⁻¹¹m and range of frequency index is between 5 and 35,the relations between dimensionless contact stiffness and dimensionless normal contact load for different fractal dimensions are shown in Fig.7(a).For a given dimensionless total contact load,the dimensionless total normal contact stiffness is proportional to the fractal dimension.As the value of fractal dimension is increased,the curvature radius at the peak of the asperity with frequency indexnincreases.For a given contact load,the normal contact stiffness of a single asperity with frequency indexnis proportional to the fractal dimension.Therefore,the dimensionless total normal contact stiffness is proportional to the fractal dimension.Similarly,in Fig.7(b),when fractal dimensionD=2.3,the dimensionless total normal contact stiffness is inversely proportional to the characteristic scale parameter for given dimensionless total contact load.
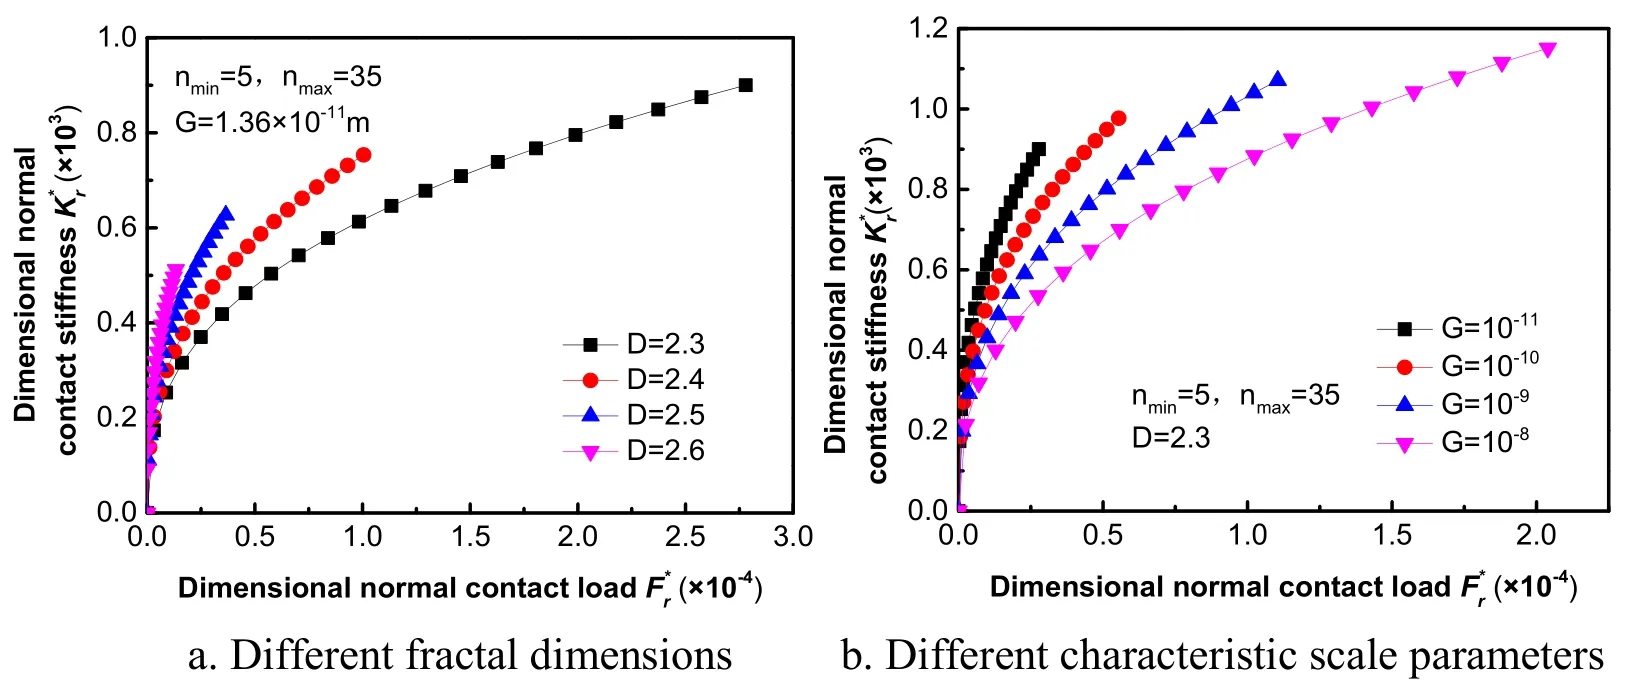
Figure 7:The relations between dimensionless total normal contact stiffness and dimensionless normal contact load for different fractal parameters
4 Experiments
4.1 Experimental device
In order to check the validity of present model,an experiment is applied to obtain the experimental data.Fig.8 shows the schematic diagram of experimental device.The specimen 2 is fixed the base.The specimen 1 is located on the specimen 2.A loading screw is used for imposing normal load on the specimen 1.The normal interference of joint surface can be measured by displacement sensors which are symmetrically embedded in the specimen 1.The loading period is so long that the fluctuation of load can be avoided.
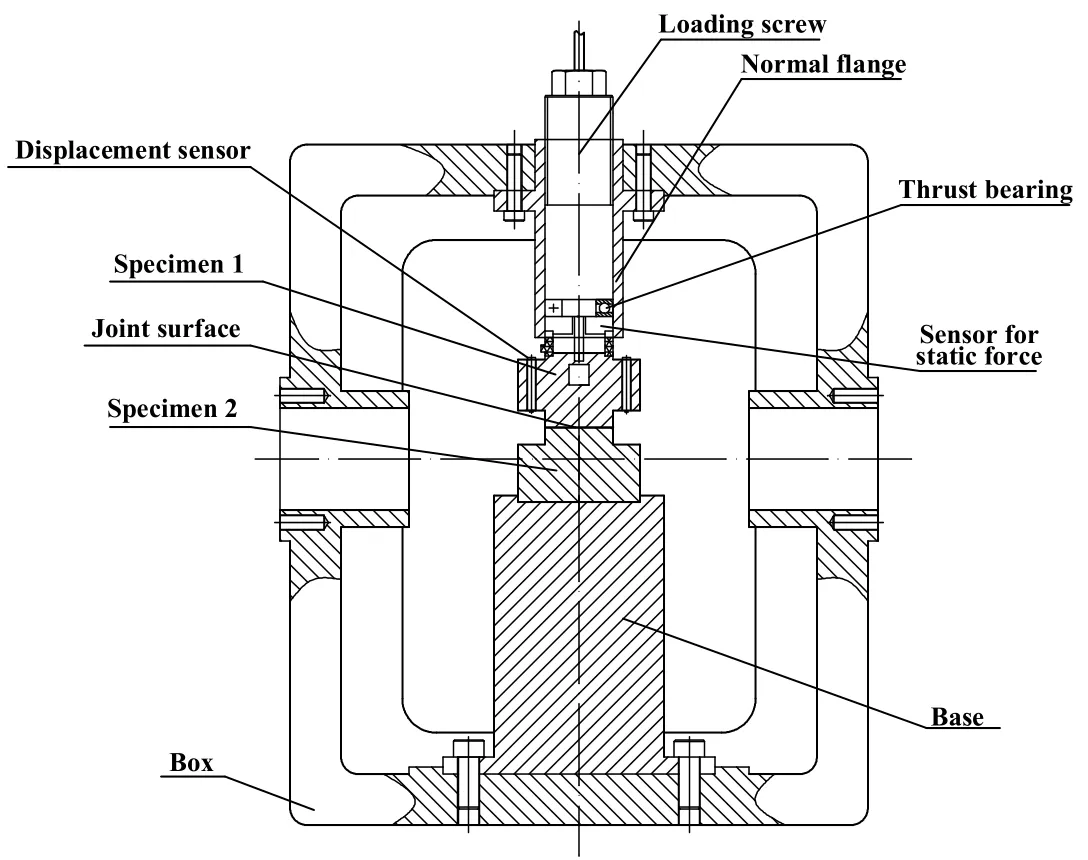
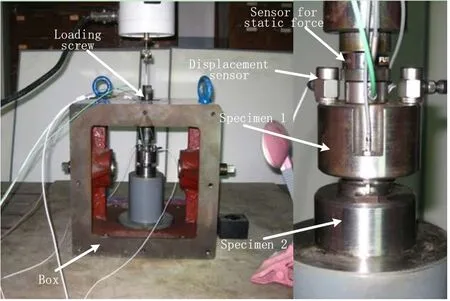
Figure 8:The schematic diagram of experimental device
4.2 Measurement of surface topography of specimens
Specimen 1 and specimen 2 are shown in Fig.7.The material is 40Cr and the material parameters of them are as follow:Young's modulusE= 210× 109Pa,Poisson's ratioυ= 0.3,and hardnessH= 2.058× 10⁹Pa.The contact surfaces of the specimen 1 and specimen 2 are manufactured by grinding method.Two pairs of specimens are adopted,which the values of surface roughness of each pair of specimens are different.Before measurement these surfaces have been cleaned by acetone.The surface topographies of specimens are measured by the Leica 3D Optical Surface Metrology System(Fig.9(c)).In order to guarantee the accuracy of measuring results,three different locations are selected to measure surface topographies for specimen 1 and specimen 2,respectively(Fig.9(a)and Fig.9(b)).The arithmetic average of measured values for three different locations is regarded as the final result.The fractal dimensionDand characteristic scale parameterGfor each location can be obtained by the following equation

whereS(τ)denotes structure functions of the two-dimensional profile of the specimen.τis the interval along thexdirection.Dsdenotes fractal dimension for profile of two-dimensional rough surface.The relation betweenDandDscan be written asD=Ds+1.z(x)denotes the height of any point on the profile of two-dimensional rough surface.denotes the ensemble average.The parameterCis a scaling coefficient,which can be expressed as

where Γ (x)is gamma function.In the double logarithmic coordinate,Eq.(36)can be written as

Therefore,the plot of logS(τ) as a function of logτis a straight line.The fractal dimensionDs(orD)can be obtained from the slope of the straight line.The characteristic scale parameterGcan be obtained from the intercept on the ordinate.
When the specimen 1 comes into contact with the specimen 2,the fractal parameters of the equivalent rough surface can be obtained from the following equation

whereS1(τ)andS2(τ)denote structure functions of the two-dimensional profile of the specimen 1 and the specimen 2,respectively.The arithmetic average of measured values for three different locations is regarded as the final result of the equivalent rough surface.Similarly,the arithmetic average roughness of the equivalent rough surfaceRaecan be written as

whereRa1andRa2denote he arithmetic average roughness of the two-dimensional profile of the specimen 1 and the specimen 2,respectively.For the equivalent rough surface with asperities whose frequency indexes are betweennminandnmax,the relation between the arithmetic average roughness and frequency index is approximately expressed as Yuan[Yuan(2017)]

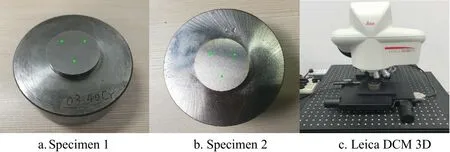
Figure 9:The test specimens and measurement equipment
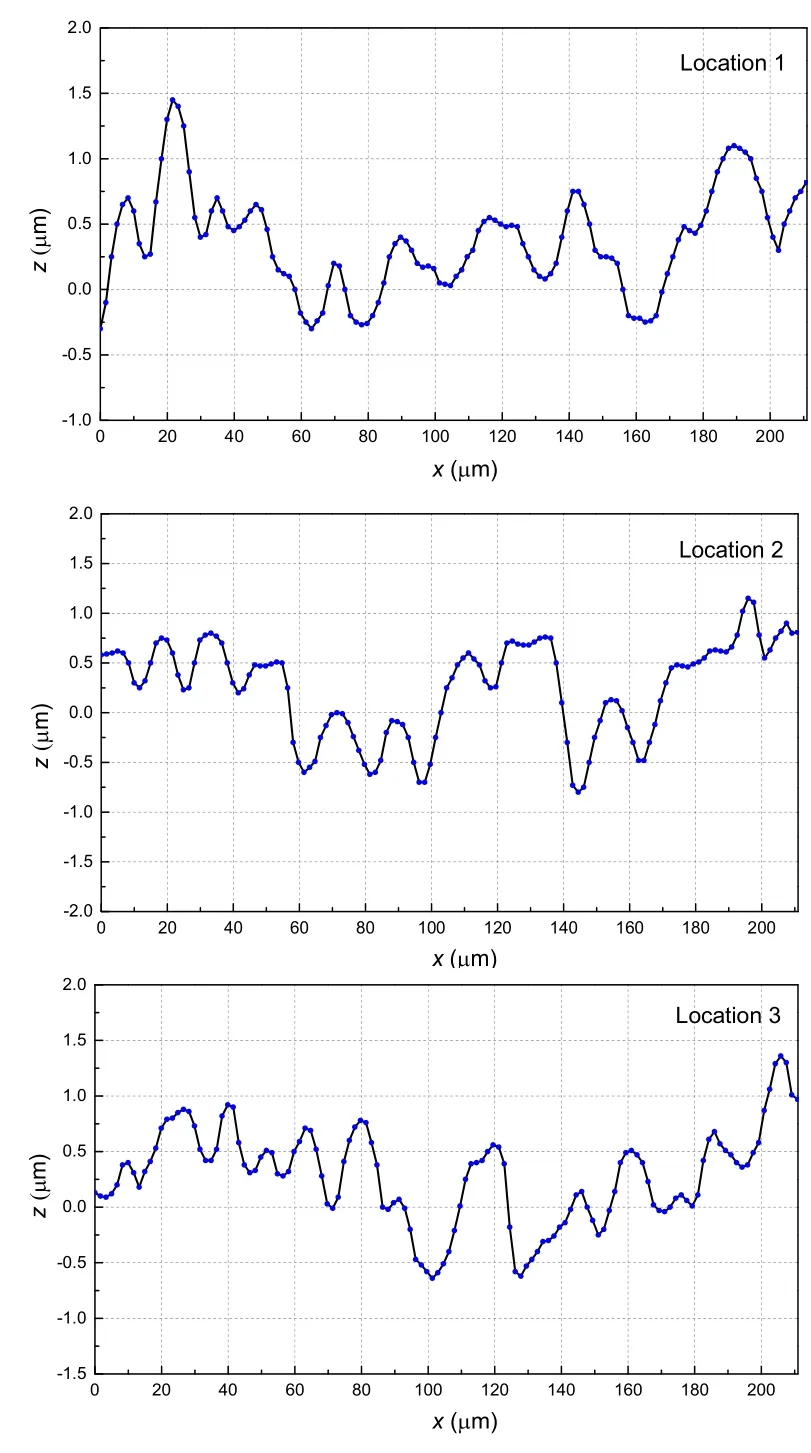
Figure 10:The profile of specimen 1
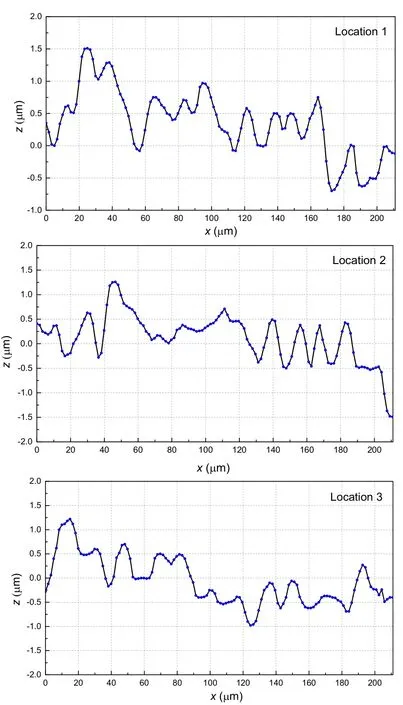
Figure 11:The profile of specimen 2
The measured surface profiles of the first pair of specimens are shown in Fig.10 and Fig.11.And the measured results of roughness and sample length of the two pairs of specimens are shown in Tab.2.According to Eq.(39),the relations betweenS(τ)andτin the double logarithmic coordinate for specimen1,specimen 2 and the equivalent rough surface have been shown in Fig.12.From the slopes and intercepts of these straights,fractal parameters are obtained and are shown in Tab.3.
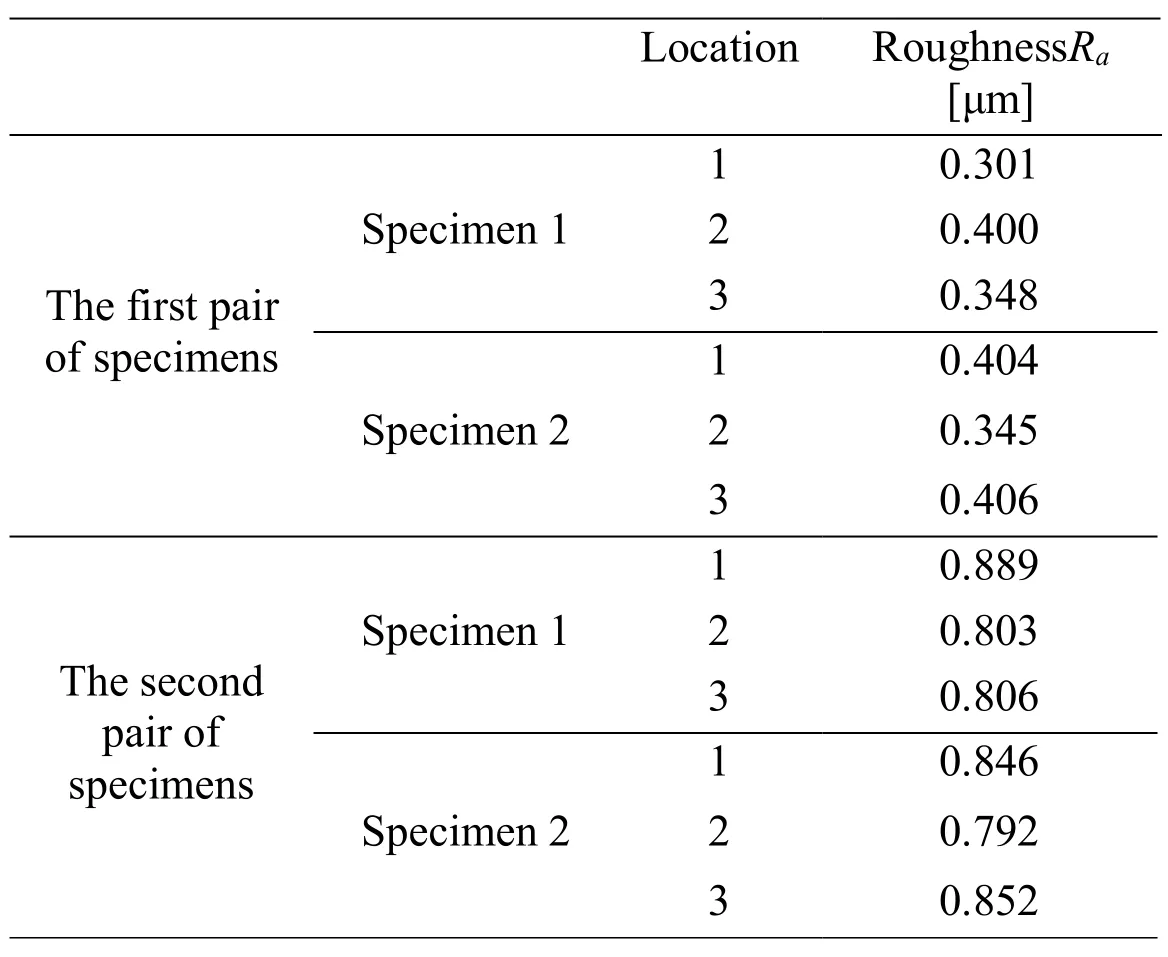
Table 2:Measured values of the surface profiles of the specimens
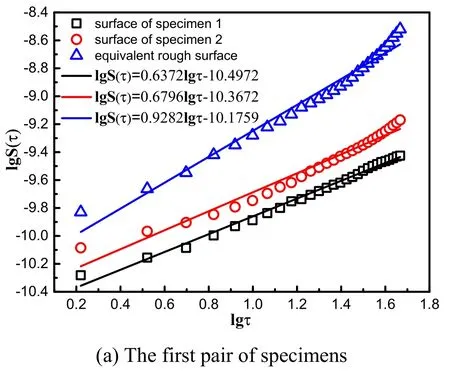

Figure 12:Structure functions of surfaces with grinding roughness
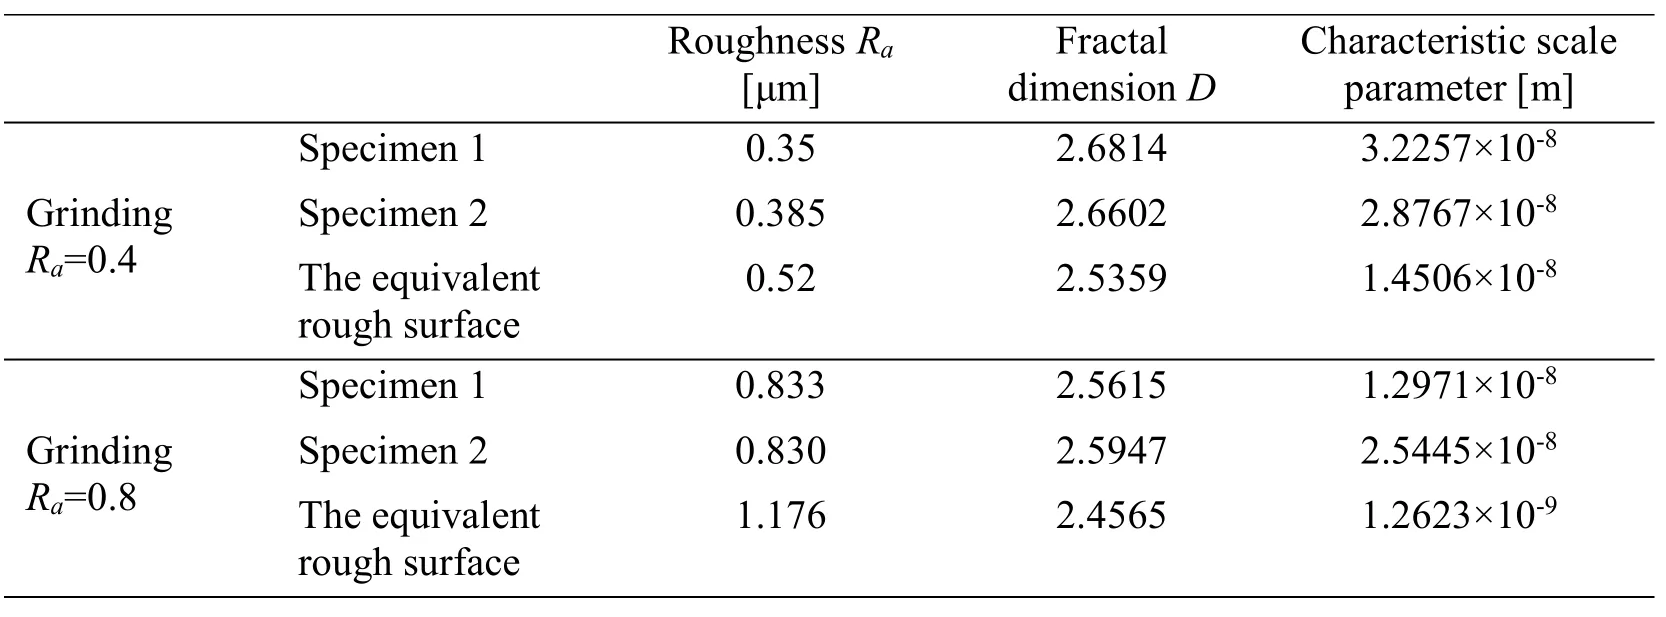
Table 3:The fractal parameters of surface profiles for different specimens
The material parameters of 40Cr are as follow:Young's modulusE= 210× 109Pa,Poisson's ratioυ=0.3,and hardnessH= 2.058× 10⁹Pa.According to the material parameters and the fractal parameters in Tab.3,we can obtain different critical frequency indexes,the minimum and maximum frequency indexes for different surface profiles.The results are shown in Tab.4.

Table 4:The critical,minimum and maximum frequency indexes for different surface profiles
Fig.13 shows the comparisons between theoretical and experimental results.The fractal dimensions and characteristic scale parameter are inversely proportional to the arithmetic average roughness for rough surface.For given contact pressure,the normal contact stiffness is inversely proportional to the arithmetic average roughness.The trends of the present fractal model are in agreement with that of experimental results.In Fig.13(a),when contact pressure is between 1 MPa and 3.5 MPa,the present fractal model is in agreement with experimental data.In Fig.13(b),when contact pressure is between 1.13 MPa and 3.5 MPa,the present fractal model is in agreement with experimental data.For the two equivalent rough surfaces,the first six frequency indexes are less than their critical elastic frequency indexes,respectively,the relation between contact pressure and normal contact stiffness is approximately.
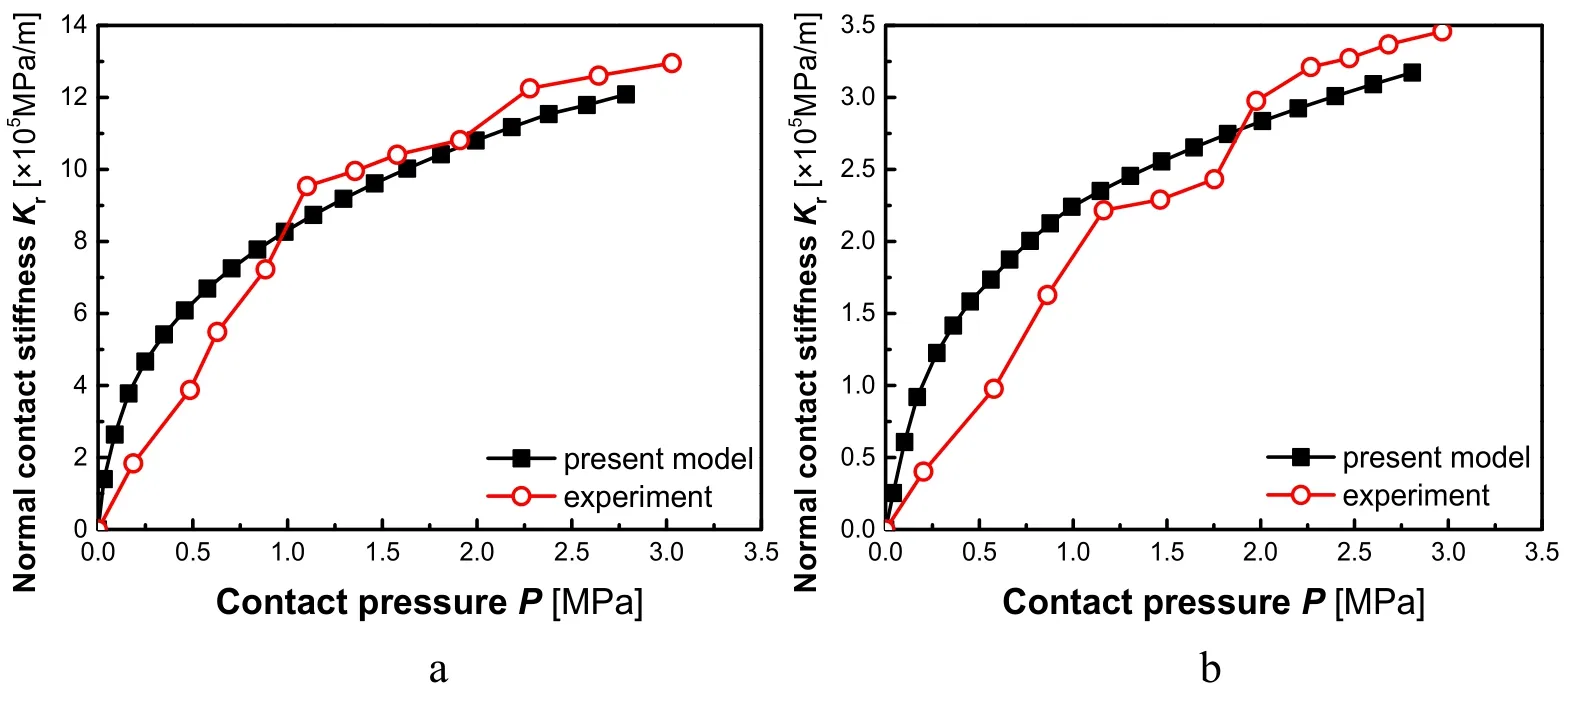
Figure 13:Comparisons between theoretical and experimental results(a.Ra=0.4 and b.Ra=0.8)
5 Conclusions
Based on the revised fractal contact model,a model of normal contact stiffness is presented.In the model,a single asperity is initially in elastic deformation under contact interference.As the interference is increased,a transition from elastic to elastoplastic to full plastic deformation occurs in this order.The critical elastic interference,the first elastoplastic critical interference and the second elastoplastic critical interference are scale-dependent.The mechanical properties of a single asperity are in accord with classical contact mechanics.The relations between the total normal contact stiffness and the total contact load are given.And the elastic,the first elastoplastic,the second elastoplastic and full plastic normal contact stiffness are obtained.
The total normal contact stiffness depends on range of frequency indexes of asperities.Whatever the range,the elastic normal contact stiffness is major contribution to the total contact stiffness.When the first six frequency indexes are less than the critical elastic frequency index,the relation between the total contact load and the total normal contact stiffness is approximately.When the minimum frequency is greater than the critical elastic frequency index and these maximum contacts truncated areas of asperities whose frequency indexes range fromnmintonmin+5 are less than their the critical elastic contact truncated areas,the relation between the total contact load and the total normal contact stiffness is approximately.Else the relation between the total contact load and the total normal contact stiffness is approximatelyKr~Fr.Finally;an experiment of normal contact stiffness is devised to validate validity of theoretical model.The comparison between the theoretical results and the experimental results indicates that the theoretical results are consistent with the experimental data;therefore,the present fractal model of contact stiffness is reasonable.
Acknowledgement:This work was supported by the National Natural Science Foundation of China(Grant Nos.51105304,51475364)and the China Postdoctoral Science Foundation funded project(Grant No.2014M552467).
杂志排行
Computer Modeling In Engineering&Sciences的其它文章
- An Automated Approach to Generate Test Cases From Use Case Description Model
- Hybrid Deep VGG-NET Convolutional Classifier for Video Smoke Detection
- Design of Smith Predictor Based Fractional Controller for Higher Order Time Delay Process
- Experimental Study and Finite Element Analysis on Ultimate Strength of Dual-Angle Cross Combined Section Under Compression
- IoT Based Approach in a Power System Network for Optimizing Distributed Generation Parameters
- 3D Bounding Box Proposal for on-Street Parking Space Status Sensing in Real World Conditions
