Assessments of the Arctic amplification and the changes in the Arctic sea surface
2019-06-11CHENJinLeiKANGShiChngMENGXinHongYOUQingLong
CHEN Jin-Lei, KANG Shi-Chng,b,*, MENG Xin-Hong, YOU Qing-Long
a State Key Laboratory of Cryosphere Sciences, Northwest Institute of Eco-Environment and Resources, Chinese Academy of Sciences, Lanzhou, 730000, China
b Centre for Excellence in Tibetan Plateau Earth Sciences, Chinese Academy of Sciences, Beijing, 100101, China
c Key Laboratory of Land Surface Processes and Climate Change,Northwest Institute of Eco-Environment and Resources,Chinese Academy of Sciences,Lanzhou,730000, China
d Institute of Atmospheric Sciences, Fudan University, Shanghai, 200433, China
Abstract Although dramatic warming is occurring in the Arctic,it is incomplete to provide an estimate to the Arctic Amplification(AA)based only on the surface air temperature (SAT) obtained at a few land stations. In this study, a comprehensive evaluation has been made with sea surface temperature (SST) and SAT from the Arctic land and ocean. Additionally, the variations of sea surface parameters were analyzed for a better understanding of the updated Arctic changes in recent years. AA was underestimated by 4.3% when only considering the SAT. During 1982-2018,the Arctic and global SSTs increased dramatically after 2002 with a near-synchronous trend in 2011-2018.Sea ice extent exhibited negative anomalies in September and March after 2002,which were more significant in September.The warming was more remarkable in March than that in September, and the negative SST anomaly entirely disappeared in March in the last two years (2017-2018). However, sea ice thickness and snow depth in September increased with the positive anomaly in the southwestern Arctic Ocean.
Keywords: Arctic; Warming; Arctic amplification; Sea ice; Snow depth
1. Introduction
The Arctic is one of the most rapidly changing areas globally, with the increasing temperature and the widespread shrinking cryosphere, mainly including sea ice, glacier, and ice sheet during the last decades(IPCC,2019).Meanwhile,the changes of the cryosphere in the Arctic affect atmospheric and ocean circulations and have feedback on climate variability on the regional and global scales (Budikova, 2009). Sea ice and snow are two of the critical factors and have significant feedbacks on climate changes in the Arctic and even the globe(Malinka et al., 2016). The Arctic sea ice anomaly is mainly caused by the abnormal exchanges of the ocean, sea ice and atmosphere between the North Atlantic and the Arctic(Goosse et al., 2004), and further impacts the global ocean. The snow over sea ice affects the mass balance of sea ice due to its effective heat-insulation with a thermal conductivity that is almost an order of magnitude smaller than that of sea ice(Calonne et al., 2011).
The Arctic surface air temperature has likely increased by more than double the global average over the last two decades,a robust phenomenon known as the Arctic amplification (AA)(IPCC, 2019). The mechanisms can be divided into the local and remote forcings which interacted and amplified each other(Stuecker et al., 2018; Cohen et al., 2019). The local forcings include snow, sea ice albedo, cloud and ice insulation feedbacks, and the remote forcings involve atmospheric and ocean heat and atmospheric moisture transport from the midlatitudes and tropics into the Arctic (Stroeve et al., 2012; Dai et al., 2019), as well as the low-level mixed-phase clouds(Wendisch et al.,2019).Serreze and Francis(2006)suggested surface albedo feedback was the leading cause to increase solar radiation by the Arctic with the shrinking snow and ice.However, another study proposed that temperature feedback was the most substantial contributor to the AA (Pithan and Mauritsen, 2014). Graversen and Burtu (2016) pointed out the AA was enhanced by the latent energy transport of atmospheric planetary waves.Moreover,AA might be caused by past air pollution reductions in Europe (Navarro et al., 2016).The decrease of ice-sheet surface mass balance was also in part attributed to the anthropogenic global warming and concurrent AA(Pattyn et al.,2018).Therefore,the mechanisms of the AA are various, and the main factor has not been determined, but it is an undeniable fact that global and Arctic warming is unequivocal (IPCC, 2014a). More than 90% of global warming energy is stored in the ocean (IPCC, 2014b),which indicates that ocean heat content change is the core of climate change. Previously the AA was evaluated by a comparison between land surface temperatures obtained from the land stations within the Arctic(60°-90°N)and globe(Epstein et al., 2018). However, the primary energy of warming is stored in the ocean with high specific heat(Khaligh and Onar,2017). The land stations are sparse, especially in the Arctic,and unevenly distributed on land due to widely varying surfaces Both of them might affect the assessment of the AA.Additionally, the variations of sea surface parameters are significant for the evaluation of changes in the Arctic and feedbacks on climate systems globally, which are also fundamental for predicting the opening of the Arctic voyage passages.
This study aims to provide an updated and comprehensive evaluation of changes in climate(1982-2018)and cryospheric elements in the Arctic in recent years (2011-2018). Three widely used datasets were evaluated to obtain the optimal sea surface temperature (SST), then a comprehensive assessment for AA was conducted with the combination of optimal SST and surface air temperature (SAT). Besides, the temporal and spatial variations and anomalies of sea ice and snow,including sea ice extent, sea ice thickness, sea ice concentration, and snow depth were investigated in both melted and frozen windows.
2. Data and methods
The sea ice index(25 km×25 km),daily values from 1979 to 2018, is from the U.S. National Snow and Ice Data Center,which contains the monthly sea ice concentration and sea ice extent throughout the Antarctic and the Arctic. It can be used for the study of changes in sea ice in the polar region(Fetterer et al., 2017). The sea ice extent data within 65°-90°N from January 1979 to December 2018 were selected. The data for snow depth and sea ice concentration during 2011-2018 originated from the CryoSat-2 (CS-2, 25 km × 25 km,monthly means) satellite, which launched in 2010 (Kurtz and Harbeck,2017).The average height of the near-polar non-sunsynchronous orbit is 717 km, and the dip angle is 92°, which effectively compensates for the observation deficiency of remote sensing in high latitudes (Hendricks et al., 2016).
Three widely used SST datasets, International Comprehensive Ocean-Atmosphere Data Set (ICOADS), Optimum Interpolation Sea Surface Temperature (OISST) V2, and Hadley Centre Global Sea Ice and Sea Surface Temperature(HadISST), were evaluated to investigate AA. As one of the most long-term time-series field observation datasets,ICOADS was mainly composed of ship data and buoy data and was organized after digitizing, quality control, deviation correction, and gridding (Woodruff et al., 2011). The OISST was based on the ICOADS.Sea ice data and satellite data were subsequently added to improve the spatial and temporal resolutions and increase spatial coverage by the optimum interpolation method (Reynolds et al., 2002). However, the data is only available from December 1981 onward due to the limitation of satellite observation. On account of the Global Sea-Ice and Sea Surface Temperature (GISST) data, the HadISST includes in-site observations such as those from ships and buoys,as well as satellite data(Rayner et al.,2003).Timespan and spatial resolutions are two critical indicators for the quality of data; however, they are mutually constrained.Although ICOADS relies on actual observation and is closest to reality,the observation sites are sparse.HadISST and OISST would be more suitable for a global scale analysis for their valid spatial coverage.They were compared by the root mean square error(RMSE)and correlation coefficient with ICOADS based on the values extracted from conventionally effective grids over the same period (12/1981-10/2018). The RMSE and correlation coefficient for OISST were 1.64°C and 0.86,respectively, while HadISST had more significant deviation with the corresponding values of 5.93°C and 0.52.Therefore,the OISST (1°× 1°monthly means from 12/1981-12/2018)was used for SST. SAT was from the Climatic Research Unit Temperature, version 4 (CRUTEM4, 5°× 5°(Jones et al.,2012), monthly values from 12/1981-12/2018), which is based on weather station data and quoted by the Arctic Report Card for the mean annual anomaly analysis of the Arctic(land stations north of 60°N) and the world (Jones et al., 2012). In this study, both SAT on land and SST in 1982-2018 were considered in the comprehensive analysis for the Arctic and global warming by area weighting.
3. Results and discussion
3.1. Assessment for AA
The mean annual anomalies of SST and SAT, and their combined anomalies in the Arctic(66.5°-90°N)and the globe were shown in Figs. 1 and 2. The increasing trends were demonstrated in the SST anomaly with fluctuations both in the Arctic and the globe. They remained positive after 2002 and 2001, respectively, except for 2008 when the global anomaly was negative.SSTs exceeded the climate means(1982-2010)at approximately 2002, then increased at a rapid rate, especially in 2011-2018. The linear fitting of the Arctic was higher than that of the globe with similar slope (0.278 and 0.270, respectively) and an intercept difference of 0.71°C,indicating the near-synchronous warming of sea surface in the Arctic and globe but stronger in the Arctic.

Fig. 1. The anomalies of annual mean SST relative to 1982-2010 means in the Arctic and globe during 1982-2018 (Dashed lines are the fittings).
The anomaly of the annual SAT was almost an order of magnitude greater than that of the SST, with higher fluctuations (Fig. 2). They exceeded the climate means at approximately 2002, and a significant difference between the Arctic and globe appeared after 2005, when the warming rate in the Arctic was larger than that in the globe, with a broader intercept. On average, the anomaly of the SAT in the Arctic was 2.66 times greater than that in the globe during 2005-2018,and both reached maximum values in 2016,after which they decreased but still maintain high values in 2017 and 2018. Nummelin et al. (2017) found a 2-6°C range in AA of SAT north of 70°N by comparing 20 CMIP5 simulations for RCP8.5, which consistent with increased ocean heat transport. Annual Arctic SAT continued to increase at more than double the magnitude of the global mean in 2019(Richter-Menge et al., 2019). The combined changes of SST and SAT were shown in Fig. 2b, in which their weight coefficients (13:8 and 70.8:29.2) were based on the area proportions of ocean and land in the Arctic and the globe. They exceeded the climate means at approximately 2002. The average anomaly in the Arctic was 2.78 times than that of the globe during 2005-2018, which is higher than that for SAT although SST brought down the SAT anomalies. Therefore,AA was underestimated by 4.3% (0.12 times) when only considering the SAT. The effect of SST cannot be ignored in the assessments of Arctic warming and global warming.
3.2. Sea ice extent in the Arctic

Fig. 2. The anomalies of annual mean SAT (a), and surface temperature (ST, b) relative to 1982-2010 means in the Arctic and globe during 1982-2018.

Fig. 3. The variations of (a) sea ice extent, and (b) its anomalies relative to 1980-2010 means during 1979-2018 (Dashed lines are the fittings).
Sea ice extent poleward of 65°N was extracted, and the variations of each month from 1979 to 2018 were shown in Fig. 3a. It is evident that the minimum sea ice extent was in September,and the maximum occurred in March or February.Therefore,the months of September and the average of February and March were the melted window and the frozen window,respectively.The anomalies of sea ice extent in the melted and frozen windows were calculated relative to 1980-2010 means(Fig. 3b). The two windows presented downward trends with positive anomalies before 2002 and negative anomalies afterward.These changes indicated the overall retreat of the sea ice extent in the Arctic after 2002 in both stages,with more severe shrink in the melted period. Reductions in the Arctic sea ice extent scale linearly with both global temperatures and cumulative CO2emissions(Notz and Stroeve,2016).The shift to thinner seasonal sea ice contributes to further ice extent reductions through enhanced summer season melt via increased energy absorption (Nicolaus et al., 2012). The negative trend slightly recovered from 2011 to 2018,butstill with high negative values(the mean values in the melted and frozen windows were-5.63%and-27.5%,respectively).This agrees with the latest report that confirmed the Arctic sea ice extent continued the declining trends both in the melted and frozen windows(Richter-Menge et al.,2019).IPCC Special Report on the Ocean and Cryosphere(IPCC,2019)indicated the strongest reductions in September are unprecedented in at least 1000 years (IPCC,2019).
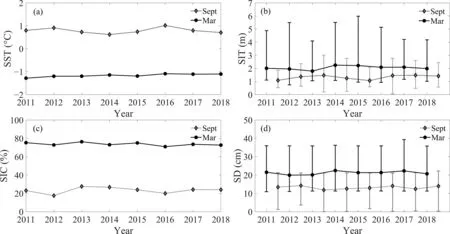
Fig. 5. Variations of (a) SST, (b) sea ice thickness (SIT), (c) sea ice concentration (SIC), and (d) snow depth (SD) in September and March from 2011 to 2018.
3.3. Other sea ice and snow parameters in the Arctic
3.3.1.Average distribution of parameters in the melted and frozen windows
Sea ice thickness varied from 1.80-2.25 m and 1.07-1.48 m in March and September during 2011-2018,with an average value of 2.05 m and 1.32 m, respectively(Fig. 4). It was positively correlated with snow depth both in spatial and temporal variations with the average correlation coefficient (September and March) of 0.86 and 0.92, respectively. The extreme values of sea ice thickness, shown as the error bars in Fig. 5b, varied with time and undergo greater fluctuations in March, particularly for the peaks ranging from 4 m to 6 m.In contrast,snow depth was more stable.It varied from 11.85-14.25 cm and 19.95-22.46 cm with a temporal average of 13.18 cm and 21.21 cm in March and September,respectively. Maximum sea ice thickness and snow depth remained in the north of Greenland whenever in the melted and frozen window. They were 2.35 m and 21.40 cm in September and 3.70 m and 35.80 cm in March, respectively.SST was below 0°C from September to March except for the southern Greenland Sea and the Barents Sea, with an average value of -1.16°C in March. It increased after the vernal equinox until September when the southernmost ice and snow shrank with an average SST of 0.79°C in the Arctic Ocean.Sea ice concentration was negatively correlated with SST in temporal variation with the average correlation coefficient(September and March) of -0.93, and the average difference between the two windows was as high as 50.31%.
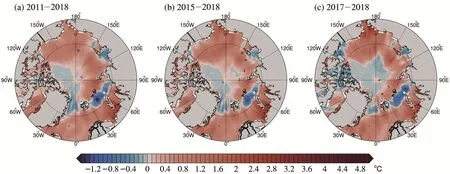
Fig. 6. Distributions of SST anomalies in September relative to 1982-2010 means, (a) 2011-2018, (b) 2015-2018, (c) 2017-2018.

Fig. 7. Distributions of sea ice thickness (a, b), snow depth (c, d), and sea ice concentration (e, f) anomalies in September (relative to 2011-2018 means).
3.3.2. Anomalous distributions in the melted window
In general, the Arctic sea within 65°-90°N, including the Beaufort Sea, Chukchi Sea, East Siberian Sea, water within the Arctic Archipelago, most parts of the Laptev, Kara, and Greenland Seas,showed positive anomalies with an average of 0.41°C (Fig. 6). However, Fram Strait, the Kara and Barents Seas north of Novaya Zemlya and south of Franz Josef Land,and the coastal Laptev Sea west of New Siberian Islands had negative anomalies during 2011-2018. Unusually warm and cold anomalies were in the coastal waters and the middle of the Barents Sea,respectively.SST showed an increasing trend in the Arctic basin except for the southwestern part that is north of the Queen Elizabeth Islands, Ellesmere Island, and Greenland. The growth rate of the northeastern basin was gradually decreased until stagnation during 2017-2018. The Chukchi Sea continued to warm, and the cold regions were shrinking in the Laptev Sea and Fram Strait. Although some places were anomalously cold, such as the water in the Arctic Archipelago and coastal Beaufort Sea, regional average anomalies were still positive in 2015-2018 and 2017-2018.Arctic Report Card 2019 also indicated the warming trend of SST in August 2019 was 1-7°C warmer than the 1982-2010 August mean in the Beaufort and Chukchi Seas, the Laptev Sea, and Baffin Bay (Richter-Menge et al., 2019).
The anomalies of sea ice thickness,snow depth,and sea ice concentration relative to the mean states (2011-2018) in the melted window in different perods were shown in Fig. 7.During 2015-2018, CS-2 indicated that sea ice thickness and snow depth had large variability in the southwestern Arctic basin. Data from multiple satellite altimeter missions showed declines in Arctic Basin ice thickness from 2000 to 2012 of(-0.58±0.07) m per decade(Lindsay and Schweiger,2015).The snow over sea ice was increasing with a positive anomaly of 0.18 cm. Region of above-average thickness had multiyear ice in the north of the Queen Elizabeth Islands, while below average area showed in the north of Ellesmere Island and Greenland. The magnitudes of snow depth and sea ice thickness anomaly increased to 0.46 cm and 0.15 m in 2017-2018, respectively, which indicated the continuous growth of the snow depth and sea ice thickness. Additionally,the covering areas expanded to the northern and southwestern Arctic basin. The positive anomaly of sea ice concentration was found in the southeastern Arctic Ocean and parts of water in the Arctic Archipelago, while the negative anomaly was mainly concentrated in the northern Arctic basin,Beaufort and East Siberian Seas away from the coast, the Greenland Sea close to the east coast,and northern Barents and Kara Seas.In 2017-2018, positive sea ice concentration anomaly increased in the Arctic Archipelago and expanded into the north of the Arctic Ocean with the shrinking negative anomaly regions.
3.3.3. Anomalous distributions in the frozen window
Larger areas of sea ice and snow coverage reduce the absorption of solar radiation due to their high albedos, which results in a distinct distribution of SST in the frozen window.Fig. 8 depicted anomalous distributions in recent years with three-stage averages compared with the climate mean, which indicated a significant warming trend. Only small anomalies within±0.1°C existed in most parts of the Arctic.The Arctic basin and the seas except for the west Greenland Sea between 70°N and 80°N had negative anomalies, while the Arctic Archipelago,Barents Sea,and the remainder of the Greenland Sea were covered by positive anomalies during 2011-2018.The area and intensity of the negative anomaly region decreased in 2015-2018 and thoroughly disappeared in 2017-2018.The power of the positive anomaly enhanced,and the average increased from 0.12°C to 0.17-0.29°C in three stages,both of which indicated the increase of the warming in the Arctic.
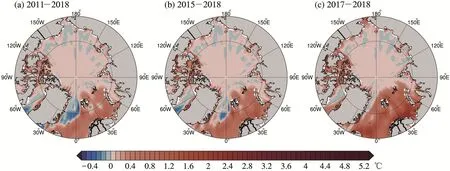
Fig. 8. Distributions of SST anomaly (relative to 1982-2010 mean) in March, (a) 2011-2018, (b) 2015-2018, (c) 2017-2018.
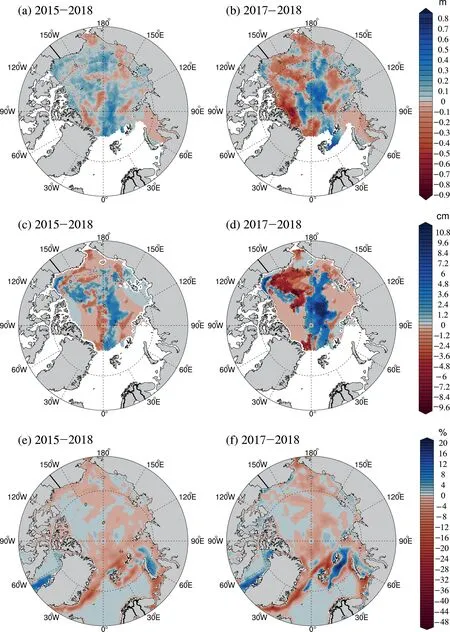
Fig. 9. Distributions of sea ice thickness (a, b), snow depth (c, d), and sea ice concentration (e, f) anomalies in March (relative to 2011-2018 means).
The anomalies of sea ice thickness,snow depth,and sea ice concentration in the frozen window were calculated in two stages, 2015-2018 and 2017-2018 in Fig. 9. Both stages showed more complicated anomalies than those in September.In general, sea ice thickness and snow depth decreased with the negative spatial average anomalies in 2015-2018. However,the eastern Arctic basin displayed an apparent increasing trend.The positive anomaly enhanced and formed a significant center in the Arctic Ocean in 2017-2018.The negative sea ice thickness anomaly was strengthened and mainly controlled the region north of Greenland and the Arctic Archipelago,Beaufort Sea, Chukchi Sea, Kara Sea, and the coastal East Siberian Sea. In addition to these locations, the Laptev Sea was also dominated by negative snow depth anomaly. The negative and positive centers were generated in the northwestern and eastern Arctic Ocean,respectively.Snow depth on sea ice is essentially measured with large error, limiting mass balance estimates and ice thickness retrievals (IPCC, 2019).The negative sea ice concentration anomalies increased in spatial average in the Arctic basin and most of the epicontinental seas.Relatively large negative values were shown in the east coastal sea of Greenland and the water between Franz Josef Land and Svalbard and the coastal Barents Sea,while the positive regions were in the Davis Strait and the Kara Sea,which decreased during 2017-2018.
4. Conclusions
Global warming is a recognized fact that carries essential implications for natural ecological systems and life-supporting environments.The Arctic is an amplifier of global warming.In this investigation, the overall effects of SAT and SST were assessed, and the variations of crucial sea surface parameters in the Arctic during 2011-2018 were discussed. The following are the main results.
(1) The Arctic and global SST and SAT exceeded the climate means at approximately 2002, after which SST rapidly increased and exhibited a high and nearsynchronous trend during 2011-2018. AA was underestimated by 4.3%when took into account the combined action of SAT and SST.
(2) Sea ice extent had negative anomalies in the melted and frozen windows after 2002 with more negative values in 2011-2018, in which September was more significant.The differences in sea ice concentration and SST between the two windows can reach 50.31% and 1.95°C,respectively.
(3) In the melted window, most regions were warming with positive SST anomalies (with an average of 0.41°C) in the Arctic. The intensity of cold centers decreased, and the positive anomalies increased in 2017-2018. However, the positive snow depth and sea ice thickness anomalies were maintained in the southwestern Arctic Ocean, and the positive sea ice concentration anomalies expanded deep into the Arctic Archipelago and the northern Arctic Ocean.
(4) In the frozen window,most parts were filled by positive SST anomalies in the Arctic, and the negative anomaly region thoroughly disappeared in 2017-2018. Sea ice thickness and snow depth were decreased overall, and the negative centers were in the north of Greenland and the northwestern Arctic Ocean.
Conflict of interest
The authors declare no conflict of interest.
Acknowledgments
This work was financially supported by the Frontier Science Key Project of CAS (QYZDY-SSW-DQC021, and QYZDJ-SSW-DQC039), the National Natural Science Foundation of China(41721091),Opening Fund of Key Laboratory of Land Surface Process and Climate Change in Cold and Arid Regions, CAS (LPCC2018005), the State Key Laboratory of Cryospheric Science (SKLCS-ZZ-2020), and Foundation for Excellent Youth Scholars of Northwest Institute of Eco-Environment and Resources, CAS (FEYS2019020). Our cordial gratitude should be extended to anonymous reviewers and the Editors for their professional and pertinent comments on this manuscript.
杂志排行
Advances in Climate Change Research的其它文章
- Regional differences in global glacier retreat from 1980 to 2015
- Impact of environmental change on runoff in a transitional basin:Tao River Basin from the Tibetan Plateau to the Loess Plateau, China
- Impacts of degrading permafrost on streamflow in the source area of Yellow River on the Qinghai-Tibet Plateau, China
- China's long-term low carbon transition pathway under the urbanization process
- Sensitivity of the simulated CO2 concentration to inter-annual variations of its sources and sinks over East Asia