Subfoveal choroidal thickness and central macular thickness changes following cataract surgery in diabetic patients
2019-06-10
Abstract
INTRODUCTION
Diabetes mellitus (DM) is one of the most frequent metabolic disorders worldwide and in the last decades, its prevalence has been increasing in adults[1-2]. Dramatic changes in lifestyle particularly in developing countries lead to increasing prevalence of DM[3]. Diabetic retinopathy (DR) is a microvascular complication of DM that may account for 4.8% of all cases of blindness in the world[4].
The principle pathogenesis of DR is retinal vascular integrity impairment and hemodynamic abnormalities secondary to the breakdown of the blood-retinal barrier (BRB)[5]. Clinical and experimental data suggests that choroidal vascular abnormalities may play an important role in the pathogenesis of DR[6]. In previous studies different choroidal changes including vascular degeneration, choroidal neovascularization, choriocapillaries obstruction, and choroidal aneurysms have been reported in patients with DR[7-9].
Until recently,laser Doppler flowmetry, ultrasound and indocyanine green angiography (ICG), were used for the evaluation of choroid but, these techniques provide no anatomical information[10]. Enhanced depth imaging optical coherence tomography (EDI-OCT) can provide reliable and reproducible measurement of choroidal thickness.
Cataract development is one of the most important causes of visual impairment in patients with DM[11]. DR progression after cataract surgery was reported previously[12-14]. This progression may be due to the increased release of pro-inflammatory mediators such as interleukin 1 (IL-1), vascular endothelial growth factors (VEGFs), and hepatocyte growth factor (HGF) into the aqueous humor[15]. These post-operative inflammations may cause vascular abnormalities in the retina and choroidal layers and exacerbate the DR after cataract surgery in patients with DM leading to choroidal thickness changes. The purpose of this study was to evaluate the retinal and choroidal thickness changes following phacoemulsification using EDI-OCT and to compare these changes between diabetic and non-diabetic patients.
SUBJECTS AND METHODS
In this prospective study 106 eyes of 106 adult patients who presented to our clinic because of visually significant cataract and underwent uneventful phacoemulsification surgery between October 2016 and July 2017 were included. The study was approved by the local ethics committee and followed the tenets of the Declaration of Helsinki. Written informed consent was obtained from all cases. Study cases were divided into two groups: group A included diabetic patients with mild to moderate non-proliferative DR (NPDR) without clinically significant macular edema (CSME) and group B included non-diabetic patients. Exclusion criteria were: history of previous ocular surgery or trauma, history of glaucoma, uveitis or other ocular disorders and history of any systemic disease rather than DM, CSME, age related macular degeneration, dense cataract and poor fixation and poor cooperation for OCT examination. Furthermore, diabetic patients with proliferative diabetic retinopathy (PDR) or history of intravitreal anti-VEGF injection or laser therapy were excluded. Only patients with spherical equivalent between -3 to +3 diopters and central macular thickness (CMT) less than 300 micron were included.
All patients underwent a full ophthalmic examination including assessment of best-corrected visual acuity (BCVA), slit-lamp biomicroscopy,and dilated fundus exam, intraocular pressure (IOP) measurement with Goldmann applanation tonometry and axial length measurements using IOL Master (Version 5; Carl Ziess Meditec Ltd, Germany) before the surgery. SD-OCT and EDI-OCT images were obtained 1d before and then, 1mo and 3mo after cataract surgery by a trained technician using the SD-OCT device (Heidelberg Engineering, Heidelberg, Germany). Considering the diurnal variation in choroidal thickness, all examinations were performed between 9 a.m. and 11 a.m. Horizontal and vertical line scans centered on the fovea were obtained for each eye and the mean of two measurements were determined as the SFCT. The EDI-OCT scans were saved to align postoperative scans with preoperative scans. SFCT was defined as the distance between the base of the subfoveal retinal pigment epithelium and the margin of the choroidoscleral interface. The measurements were performed manually by two retina specialists using calipers provided with the device, and the averaged values were saved and considered for statistical analysis. CMT was measured automatically by the SD-OCT device. The main outcomes were the changes of CMT and SFCT following cataract surgery in diabetic and non-diabetic cases.
Under topical anesthesia, standard phacoemulsification cataract surgery was performed in all cases by a single surgeon using the same machine (Infiniti Vision System, Alcon). Acrylic intraocular lens was implanted in the capsular bag in all cases. No intraoperative complications were happened in any cases. Topical chloramphenicol eye drop was administered for 7d and topical betamethasone 0.1% eye drop was administered for one month in all cases.
StatisticalAnalysisDescriptive statistics for continuous variables were calculated as means ± standard deviations. To compare the values of the SFCT and CMT before and after the surgery we used paired student’st-test and to compare these values between the two study groups, independentt-test was used(P<0.05). Analyses were performed using statistical software (SPSS version 19.0; SPSS, Inc., Chicago, IL, USA).
RESULTS
A total of 106 eyes from 106 patients (48 male and 58 female) with a mean age of 65.82±10.26 years were included in this prospective study. Group A included 53 eyes of 53 diabetic patients with mild to moderate NPDR and group B included 53 eyes of 53 non-diabetic patients. The mean age of patients in group A and B are 64±10 and 67±10 years respectively (P=0.14). Compared to the baseline, BCVA improved 1mo and 3mo postoperatively in both groups (allP<0.001).

Figure1ThebaselinevaluesandthechangesofCMTinbothgroupsin1and3mopostoperatively.
Table1ComparisonofCMTchangesbetweendiabeticandnon-diabeticeyes
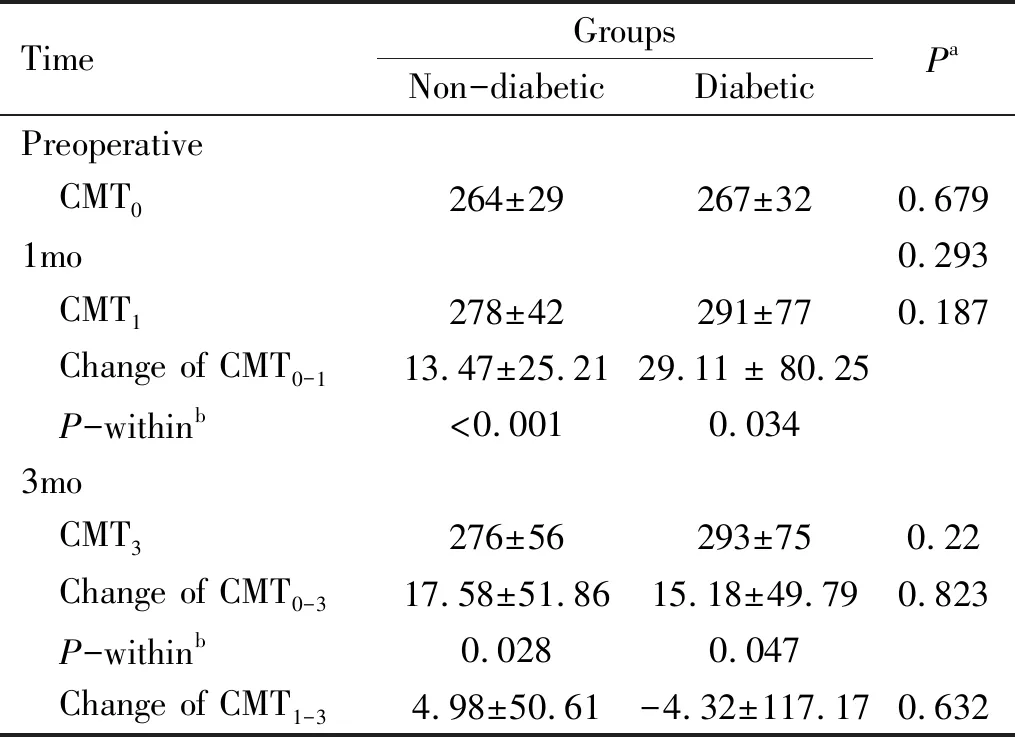
TimeGroupsNon-diabeticDiabeticPaPreoperative CMT0264±29267±320.6791mo0.293 CMT1278±42291±770.187 Change of CMT0-113.47±25.2129.11 ± 80.25 P-withinb<0.0010.0343mo CMT3276±56293±750.22 Change of CMT0-317.58±51.8615.18±49.790.823 P-withinb0.0280.047 Change of CMT1-34.98±50.61-4.32±117.170.632
CMT: Central macular thickness;abased on independentt-test;bbased on pairedt-test.
Baseline mean CMT was 267±32 μm in group A and 264±29 μm in group B. Compared to the baseline, CMT increased 1mo (group A, 291±77 μm,P=0.034 and group B, 278±42 μm,P<0.001) and 3mo (group A: 293±75 μm,P=0.047 and group B: 276±56 μm,P=0.028) postoperatively in both groups. The changes of CMT were not significantly different between the two study groups (allP>0.05)(Figure 1 and Table 1).
Baseline mean SFCT in group A and group B were 199±72 and 236±60 μm respectively (P=0.006). In group A, mean SFCT increased progressively 1mo (231±73 μm,P=0.035) and 3mo (248±91 μm,P=0.026) postoperatively. In group B, mean SFCT increased 1mo postoperatively (265±64,P<0.001), but it returned nearly to the baseline values three months after cataract surgeries (240±60,P=0.234). Although the non-diabetic cases had thicker choroid at the baseline, the change of SFCT was not significantly different

Figure2ThebaselinevaluesandthechangesofSFCTinbothgroupsin1and3mopostoperatively.
Table2ComparisonofSFCTchangesbetweendiabeticandnon-diabeticeyes

TimeGroupsNon-diabeticDiabeticPaPreoperativeSFCT0236±60199±720.0061mo SFCT1265±64231±730.02 Change of SFCT0-129.28±18.9629.66±83.590.975 P-within b<0.0010.0353mo SFCT3240±60248±910.619 Change of SFCT0-35.2±28.8938.44±109.170.05 P-within b0.2340.026 Change of SFCT1-322.27±24.6611.64±81.070.009
SFCT: Subfoveal choroidal thickness;abased on independentt-test;bbased on pairedt-test
between study groups 1mo postoperatively (P=0.97) and was borderline 3mo after surgery (P=0.05) (Figure 2 and Table 2). The baseline values and the changes of SFCT and CMT in both groups 1mo and 3mo postoperatively were shown in Tables 1 and 2.
DISCUSSION
In this study we evaluated the choroidal thickness changes following cataract surgery in diabetic patients and compared it with non-diabetic individuals. At baseline, subfoveal choroid was significantly thinner in diabetic eyes compared to the non-diabetic cases. Previous studies have shown that the choroidal vasculature is affected by metabolic changes in diabetic patients and the pathogenesis of DR may be influenced by this choroidal changes[6]. Recently, EDI-OCT has provided the opportunity to evaluate in vivo changes of choroidal thickness and it may be useful in understanding the pathogenesis of diabetic eye disease[16]. The choroid is the main source of oxygenation and nutrition of the outer retinal layers and RPE[10]and choroidal thinning in diabetic eyes may be related to the decrement of the choroidal blood flow and tissue hypoxia in diabetic eyes[17-19]. Similar to our study, many previous studies have shown that choroidal thickness decreased in diabetic eyes compared with non-diabetic eyes[6,20-23].
Cataract surgery as the most frequent ocular surgery in the world, is one of the main causes of visual impairment in elderly patients[24]. In the present study we found that SFCT and CMT increased substantially in both study groups. In diabetic eyes, SFCT increased in the first month and increasing of SFCT continued progressively within three months postoperatively. In non-diabetic eyes, SFCT reached its peak values one month after the surgery, then decreased within the next two months, reached nearly to the baseline values. In diabetic eyes, CMT increased during 3mo postoperatively, but after the first month, increasing of CMT was not substantial. In non-diabetic eyes, CMT reached to the highest value at the first month and then decreased slightly in the next two months follow up. The changes of CMT and SFCT was not significantly different between study groups one month postoperatively (P=0187 andP=0.97, respectively). Three months after operation, the changes of CMT was not significantly different between study groups (P=0.82) and the changes of SFCT were statistically borderline (P=0.05). In a prospective study on senile cataract, Celiketal[36]assessed the effect of uneventful phacoemulsification surgery on SFCT and CMT. Their study revealed that SFCT and CMT were slightly affected by uneventful phacoemulsification surgery.Bayhanetal[25]evaluated the choroidal thickness changes following phacoemulsification surgery in 38 healthy individuals and reported that choroidal thickness increased significantly in all measured points 1mo after operation. Noda and coworkers found that SFCT increased one month following cataract surgery and did not return to the baseline pre-operative values even after six months postoperatively[26]. Likewise, Yilmazetal[35]evaluated the possible changes of CMT and SFCT in 65 patients who underwent phacoemulsification. They found an increase in SFCT and CMT during follow up period but CMT returned to baseline 6mo after surgery. They concluded that uncomplicated phacoemulsification induces subclinical changes in CMT, probably due to the inflammatory insult of surgery[35]. In another study, Pierruetal[27]found that SFCT increased after cataract surgery and reached its highest values 1mo following surgery; however, SFCT decreased at 3mo after operation[27].
The exact mechanism of choroidal thickening following cataract surgery is not fully understood. It may be due to free radicals or growth factors, up-regulation of prostaglandins or other pro-inflammatory cytokines after phacoemulsification surgery[28-30]. This inflammatory cascade may be activated secondary to surgical trauma or prolonged light exposure during or after operation[30-31]. Surgical trauma may leads to release of prostaglandins and pro-inflammatory cytokines in the aqueous humor. Additionally, these inflammatory mediators may pass to the posterior segment including retina and choroid and result in inner and outer blood-retinal barrier dysfunction[32].
Britoetal[33]evaluated retinal and subfoveal choroidal changes after phacoemulsification surgery in diabetic patients. They divided their patients into 3 groups: patients with DR and without macular edema, patients with DR and macular thickening in OCT, and patients with CSME. Intravitreal bevacizumab was injected in eyes with CSME at the time of cataract surgery. The authors reported that at one month post-operative examination no significant changes in subfoveal choroidal thickness was detected in any of studied groups; however, central macular thickness increased significantly apart from patients with CSME who received simultaneous intravitreal bevacizumab. They concluded that post-operative inflammation can cause significant macular thickening without detectable choroidal thickness changes. The strong point of our study is that we included both diabetic and non-diabetic eyes and compared the changes of CMT and SFCT between diabetic and non-diabetic eyes one month and three months postoperatively. In our study, the changes of CMT and SFCT were not statistically different between diabetic and non-diabetic eyes, but it seems that the increment of CMT and SFCT in diabetic patients does not stop one month after the surgery and continued slowly until 3mo postoperatively. We think that the surgically induced inflammation and its effects on CMT and SFCT may be more prolonged in diabetic patients and these patients should be followed more carefully after cataract surgery. Unlike Britoetal[33]study, in our study, SFCT increased significantly after cataract surgery in both diabetic and non-diabetic cases but our diabetic patients were mild or moderate NPDR cases. Increment of SFCT may be secondary to exacerbation of hypoxia in the compromised choroidal vascular network in diabetic eyes and secondary to intraocular inflammatory process or elevation of free radical levels in the all (diabetic and non-diabetic) eyes following cataract surgery. Many studies reported that both CMT and SFCT increased following cataract surgery in healthy non-diabetic individuals[26-36]. Our study has some limitations. Short follow up period and including just mild to moderate diabetic cases are some of the limitations of our study. Further studies with larger number of patients and longer follow up are required to investigate the changes of CMT and SFCT following cataract surgery.
In conclusion, our study showed that the CMT and SFCT increased significantly after uneventful phacoemulsification cataract surgery in both diabetic and non-diabetic cases. The changes of CMT and SFCT were not significantly different between diabetic and non-diabetic cases.
