Novel Approach for Automatic Region of Interest and Seed Point Detection in CT Images Based on Temporal and Spatial Data
2019-05-10ZheLiuCharlieMaereandYuqingSong
Zhe LiuCharlie Maere and Yuqing Song
Abstract:Accurately finding the region of interest is a very vital step for segmenting organs in medical image processing.We propose a novel approach of automatically identifying region of interest in Computed Tomography Image(CT)images based on temporal and spatial data.Our method is a 3 stages approach,1)We extract organ features from the CT images by adopting the Hounsfield filter.2)We use these filtered features and introduce our novel approach of selecting observable feature candidates by calculating contours’area and automatically detect a seed point.3)We use a novel approach to track the growing region changes across the CT image sequence in detecting region of interest,given a seed point as our input.We used quantitative and qualitative analysis to measure the accuracy against the given ground truth and our results presented a better performance than other generic approaches for automatic region of interest detection of organs in abdominal CT images.With the results presented in this research work,our proposed novel sequence approach method has been proven to be superior in terms of accuracy,automation and robustness.
Keywords:Computed tomography image,continuously adaptive mean-shift,hounsfield,particle-size distribution.
1 Introduction
Abdominal organ accurate segmentation is very vital in automatic disease diagnosis. As abdominal organs are closely packed together,separation of individual organs is a challenge in medical image processing as the accuracy for this task largely depends on the accuracy to identify the Region of Interest in CT images.A first step that is done during segmentation of a particular organ in an abdominal CT scan is identifying a region of interest.Having a poor located region of interest have got drastic impact on the accuracy of segmentation of a specific organ.Over the years there have been slow advancement on the method to automatically identify region of interest which have resulted in making automatic segmentation of an organ a difficult task to reach useable accuracy.This has resulted in many researchers opting to use human aided region of interest identification in which its prone to a lot of human errors.Once the Region of Interest is identified further analysis are applied on the region of interest to completely isolate the organ from the rest of the tissues around it.
Radiologist across the world collect large amounts of 3D images being generated using different scanners like PET/CT,MRT or x-ray.Each of these scanners generates a 3D image of the human body by analyzing feedback of signals enabling a radiologist to examine the inner parts of a human body.In this research,we will focus on CT abdominal scans.However,the methods proposed in this paper are generally applicable to other types of scans as well.The CT scan images are stored as a stack of 2D images representing 3D slices of the human body,each slice is considered to have a certain thickness.Analyzing these 3D slices in a sequence one after another introduce us to a temporal approach of image analysis which is not usually explored in medical image processing.
Researchers have been applying spatial image processing data analysis to CT scan images to Segment organs and detect Region of Interest.With how CT scan images are designed we got inspired in adding temporal data analysis to enhance spatial data.
In this paper we present a novel for Automatic Region of Interest and Seed point based on temporal and spatial data across the CT sequence.In contrast to existing methods,there are 2 major distinctions of this work.First we introduce a novel approach of automatically identifying a seed point by calculating the distribution of liver growing features across first few slices in a CT image sequence.Second,Inspired by Continuously Adaptive Mean-shift we introduce our Region of Interest approach to track the growing region changes across the CT image sequence,given a Seed Point as our input.
The rest of the Paper is organized as follows Section 2 Related Work,Section 3 we introduce our proposed method for automatic region of interest and seed point detection based on temporal and spatial data techniques,Section 4 we present our experiment and results,Section 5 we include conclusion to summarize our views.
2 Related work
Literature review shows that there are several proposed approaches to automatically detect region of interest in CT images.These approaches applies basic image processing techniques(like threshold methods,histogram analysis,morphological operations)[Gao,Heath,Kuszyk et al.(1996);Seo(2005)]and combine them with further ideas.According to Freiman et al.[Freiman,Eliassaf,Taieb et al.(2008)],the concepts applied can be subdivided into four categories:atlas-guided methods,region growing methods,deformable models and classification based methods.However,some authors combine several methods from more than one of the four categories and we have to adjoin the graph-cut techniques[Beichel,Bauer,Bornik et al.(2015);Massoptier and Casciaro(2007)].Atlas-guided methods aim to adapt prior 3D models of the liver or kidneys to the underlying image data[Lamecker,Lange and Seebass(2012);Ling,Zhou,Zheng et al.(2008);Soler,Delingette,Malandain et al.(2000)],where statistical or active shape models are applied to model the high variability in 3D liver shape.Gaidel[Gaidel(2017)]proposed automatic region of interest selection method in lungs which is based on a greedy forward selection using local texture features as an indicator of similarity with regions of interest from the learning sample.Anastácio et al.[Anastácio,Thomaz,de Moraes et al.(2015)]proposed a technique which defines the Seed Launch on Elliptical Area(SLEA)for find the region of interest,and the second technique defines the Seed Launch into Square Area(SLSA)for find the region of interest.Parametric Active contours[Kass,Witkin and Terzopoulos(1988)]have been applied often for segmentation and region of interest detetion of medical images and its variational reformulation as geometric active contours[Caselles,Kimmel and Sapiro(1995)]offer more flexibility during the region of interest detection process with regards to topological changes.Those deformable models have been applied for liver segmentation[Evans,Lambrou,Linnery et al.(2005)],but seem to be most effective for a final segmentation refinement with level sets[Freiman,Eliassaf,Taieb et al.(2008)].In more recent research works many researchers have been exploring active contours and morphology approaches in segmentation in general,for example Ning et al.[Ning,Zhu and Chen(2018)]present a novel deep neural network architecture designed for semantic image segmentation and improved the segmentation accuracy,by introducing a novel hierarchical dilation block to effectively enlarge the size of receptive field and enable multi-scale processing in fully convolutional neural network.Classification based methods[Lambrou,Linney and Todd-Pokropek(2014)]use Bayesian formulations to model the stochastic interdependencies in the underlying image data.The drawback of these methods is that,they are based only on spatial analysis which has mainly high computing overhead but yield low accuracy.Our proposed combines with spatial and temporal analysis by relating global features amongst slices,this approach proved to me more accurate and robust.
3 Proposed method
Our proposed region of interest method is divided into 3 stages see Fig.1 shows a flow chart of this procedure.

Figure1:Overview of the proposed method
3.1 Preprocessing
This stage involves Resampling of CT Digital Imaging and Communication in Medicine(DICOM) image slides,and filter Liver features from the rest of the organs using Hounsfield filter.
3.1.1 Resampling of CT images
A CT scan combines a series of X-ray images taken from different angles around your body and uses computer processing to create cross-sectional images(slices)of the bones,blood vessels and soft tissues inside your body.CT scan images provide more-detailed information than X-rays[Staff(2018)].According to research CT is the most preferred modality because CT is less costly than MRI.The CT data is collected in the form of DICOM image.A CT DICOM slice can contain multiple slices of data depend on the slice thickness,hence we need to preprocess the raw DICOM into smaller 1 by 1 by 1 mm thickness in order to get as much details from the CT image as possible.We therefore introduce a transformation method where we will extract voxel data from DICOM into arrays,and then perform some low-level operations to normalize and resample the data,this is made possible using information in the DICOM headers.CT data is in a form of chunks of images called slices,Although we have each individual slices,it is not immediately clear how thick each slice is in a CT image.Our preprocessing method reduces the thickness of the slice into1×1×1mm thickness.
If we have the current slice dimension asW×Hand with thicknessTand let the CT image sequence beCTkwherek=1toKslices we transform the dimensions into a single Spacing asS=fmap(T(W,H)).Given the new spacing kernel dimensionSkshould be(1,1,1).The actual new space window after transformationSnewwould be.See Eq.(1)and Eq.(2).

We then feed the windowSnewand the CT slices into a Spline Interpolation[Greville,Schoenberg and Sharma(1976)]function to transform the CT Slices into new1×1×1 slices as shown in Eq.(3).

3.1.2 Feature extraction
The Hounsfield scale,named after Sir Godfrey Newbold Hounsfield,is a quantitative scale for describing radio density.The Hounsfield unit(HU)scale is a linear transformation of the original linear attenuation coefficient measurement into one in which the radio density of distilled water at standard pressure and temperature(STP)is defined as zero Hounsfield units(HU),while the radio density of air at STP is defined as-1000 HU.The Hounsfield unit(HU)scale is a measurement of relative densities determined by CT.Distilled water at standard pressure and temperature is defined as 0 HU;the radiodensity of air is defined as-1000 HU.All other tissue densities are derived from this.Tissues can vary in their exact HU measurements and will also change with contrast enhancement.Water,fat,and soft tissue can often look identical on the scan,depending on the window and level settings of the image,so actual HU measurement is essential to correctly characterize the tissues.
Hounsfield unit is used a lot in medical image segmentation for segmenting individual organs in CT images.SIince each organ has got different hounsfield units see Tab.1.The process involves the thresholding of Hounsfield value range of a specific organ per pixel in CT slice;then other image processing techniques are applied to fine-tune and reduce noise in the image.

Table1:Hounsfield unit table
In hour proposed method we filter the image using Hounsfield unit 40 to 60 by using the following equation:
letmbe the rescale slope of the CT image,letbbe the rescale intercept of the CT image and let PX be the pixel value of the CT image hence we have Eq.(4)

3.2 Automatic seed point prediction
We introduce our own method of accurately identifying a seed point.A seed point is the starting point for region growing and its selection is very vital for the segmentation result[Malek,Rahman,Ibrahim et al.(2010)].If a seed point is selected outside the region of interests,the final segmentation output would be incorrect.Most of seed point algorithms proposed for CT images like[Dalwadi,Khandhar and Wandra(2013)]only focuses on spectral classical methods like Boundary extraction,Gradient vector flow(GVF),Texture analysis,or Gray Level Co-occurrence Matrix(GLCM).These provides very low accuracy when applied to Liver datasets as Liver features are more similar to the neighboring organs hence there is a lot of noise to deal with and most of the researchers resort in providing seed points which adds in a human component hence other researcher prefer seed point done manually.Our unique proposed method to detect the seed point uses both spatial and temporal data as it treats the slices of CT images as a series of images in a sequence.The method calculates the distribution of liver’s features over a series of the first few images in the CT sequence,if the window has the highest distribution probability across the image slices,it would be assigned as a region of interest.The method is divided in the following steps;firstly we extract the features with the Hounsfield unit range that the liver features belongs to,secondly we use these extracted features to select observable feature candidates by calculating contours for the first slide,thirdly we generate windows around the chosen contours and monitor the feature distribution per window along the first few slices.The window with the highest average feature distribution is our seed point,see Fig.2.
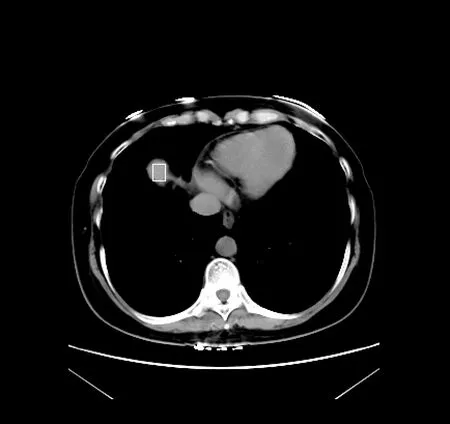
Figure2:Automatic seed point prediction
3.2.1 Select observable feature candidates and windows generation
This is a important stage where we automatically pick regions within a slice to monitor whether it will be our seed point or not.We have to be very certain that when the algorithm selects all contours as candidates to be seed point,the actual seed point with liver features is included,in this case false positive scenario is inevitable.Firstly we use Hounsfield filtered image of thefirst slice as an input to our algorithm as the slice mostly contains liver features and other features which have approximately same HU unit as the liver,in these paper we treat these other features as noise.We then trace contours based on Suzuki et al.[Suzuki and ABE(1985)]and select all contours regions.Per identified contour region from the previous step we create a window with fix dimensions,and start calculating the feature distribution using classical distribution function methods.See Fig.3 show stages in identifying seed point.
We later find the distribution of features within each individual window by applying particle size distribution function.The particle-size distribution(PSD)of a powder,or granular material,or particles dispersed in fluid,is a list of values or a mathematical function that defines the relative amount,typically by mass,of particles present according to size[Jillavenkatesa,Dapkunas and Lum(2001)],in our research we applied Rosin Rammler distribution which was first identified by Frechet[Frechet(1927)]and first applied by Rosin et al.[Rosin and Rammler(1933)]to describe particle size distributions[Ahmad,Debayle and Pinoli(2011)].
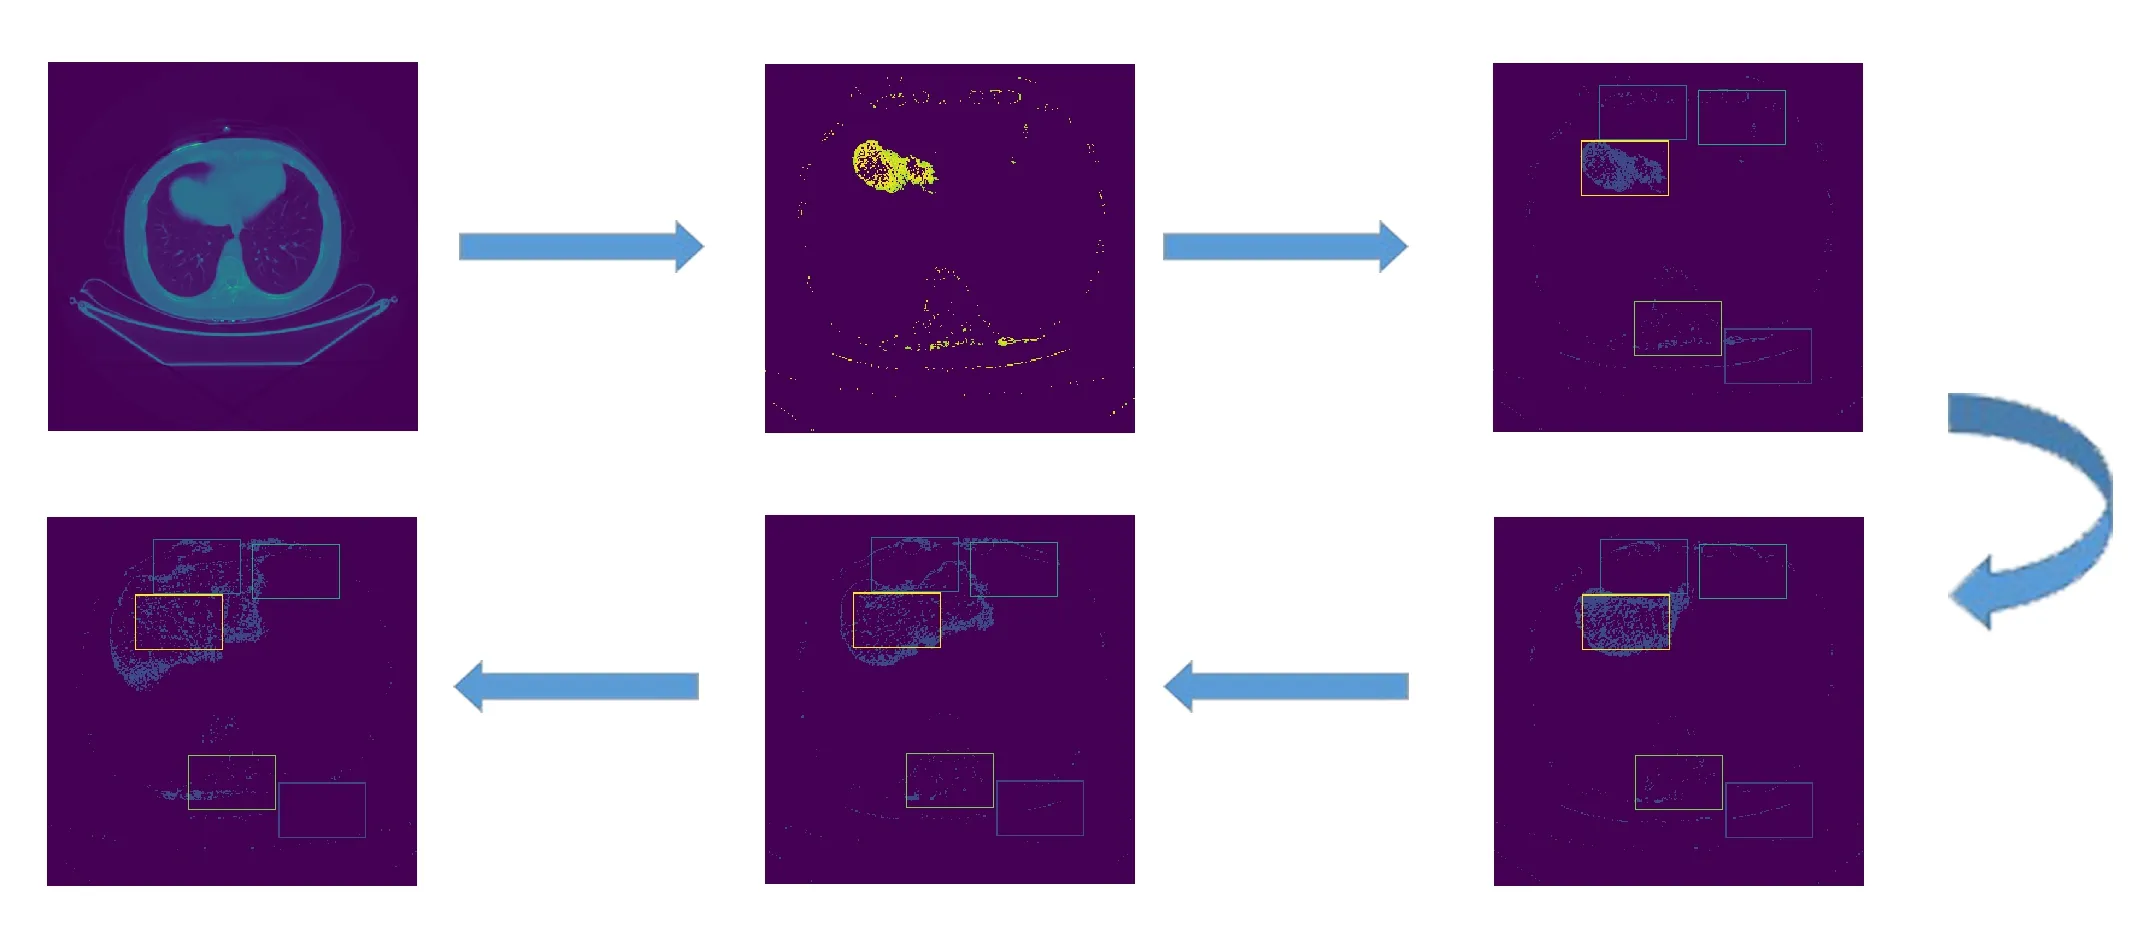
Figure3:Selection of observable candidates and windows generation overview

Where:x:Particle size,P80:80th percentile of the particle size distribution,m:Parameter describing the spread of the distribution
We therefore select the window position with the highest PSD for a single slice and track it across the first 5 slices.
Euclidian comparison of the average PSD per corresponding windowFor the first 5 slices/images we calculate euclidian sum of corresponding PSD and compared it with the other windows.The one with the highest Euclidian sum is possibly our Region of Interest,see Fig.4.

3.3 Feature tracking across the image sequence
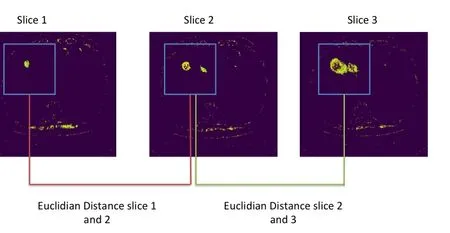
Figure4:Euclidian comparison of the average PSD per corresponding window in the first 5 slices
We use a novel approach to track the growing region changes across the CT image sequence in detecting region of interest,given a seed point as our input.This approach is inspired by top object tracking technique in video image processing called Continuously Adaptive Mean Shift Algorithm(CAMShift)[Bradski(1998)].The CAMShift is an adaptation of the Mean Shift algorithm[Cheng(1995)]for object tracking that is intended as a step towards head and face tracking for a perceptual user interface.MeanShift is a non-parametric feature-space analysis technique for locating the maxima of a density function.per given slice sequence we calculate our MeanShift by the given Eq.(7).The histogram is quantized into bins,which reduces the computational and space complexity and allows similar color values to be clustered together.The histogram bins are then scaled between the minimum and maximum probability image intensities.

whereN(x)is the neighborhood ofx,a set of points for whichK(x)6=0.andK(xi-x)is the given kernel function.
With inspiration of the camshift,we introduce our proposed method where per given Seed point from the previous section we calculate Particle Size probability distribution in Step 3 instead of color probability since Medical imaging is mostly analyzed in grayscale,and our main aim is to track Liver features based on HU filtered output.This approach basically track changes in shapes around the region of interest as the slices progresses in time sequence.The our proposed Liver Feature Tracking algorithm can be summarized in the following steps.
1.Get Seed point using the method proposed in previous subsection
2.Select an initial location of the Mean Shift search window.The selected location is the target distribution to be tracked.
3.Calculate a particle size distribution of the region centered at the Mean Shift search window
4.Iterate Mean Shift algorithm to find the centroid of the probability image.Store the zeroth moment(distribution area)and centroid location.
5.For the following frame,center the search window at the mean location found in Step 4 and set the window size to a function of the zeroth moment.Go to Step 3.
After applying our algorithm to the slice sequence we will get results like this Fig.(7)

Figure5:Results for tracking features across slice sequence for liver
3.4 Computational complexity of our proposed method
As our proposed system is a staggered into 3 stages namely Preprocessing,Automatic Seed Point Prediction,and Feature Tracking.this has computational consequences as each part has its on complexity.For the proposed method the major computational load is done on preprocessing as there is a dimension reduction computation with spline interpolation.We used optimized spline interpolation which uses compact support interpolants,this has low computational complexity in the interpolation process[Madani,Ayremlou,Amini et al.(2011)].Feature tracking is a possible major computational load stage,but in our method we leveraged Continuously Adaptive Mean Shift which has a proven low computational cost[Varfolomieiev,Antonyuk and Lysenko(2018)].
4 Experiment and results
CT scanning is a diagnostic imaging procedure that uses X-rays in order to present crosssectional images(slices)of the body.The proposed approach was applied to a complex dataset.In this research we applied our method to detect the liver as well as to detect kidneys region of interests.
4.1 Liver region of interest experiment
The dataset is divided into two categories,depending on the liver status:Normal Liver and Abnormal Liver.Each of these categories has more than 30 patients in total about 62 patients,each patient has more than one hundred slices after DICOM resampled from 5 mm slice to 1 mm slice,and more than one phase of CT scans(arterial,delayed,portal venous,non-contrast).The dataset includes a diagnosis report for each patient.All images are in DICOM format with horizontal and vertical resolution of 72 DPI,and bit depth of 24 bits.We preprocessed the raw DICOM CT images from 512*512 pixels with 5 mm slice thickness to 500*500 pixels and 1 mm slice thickness.The proposed approach was tested on 62 patients.The accuracy of the proposed approach is measured using Mean Square Error,Correlation,Dice Coefficient,True Positive Ratio,precision and recall.The proposed CT region of interest approach was programmed in python and other python Native image processing libraries.The experiment used two different set of hardware,first one is a standard PC with Intel Core 2 Duo with 8 GB memory,the second one is a GPU powered machine.The following Fig.6 will demonstrate the result of each step in the proposed approach:
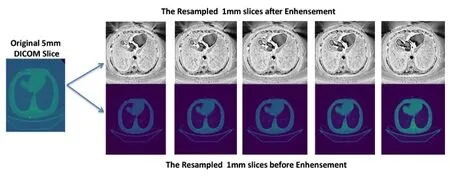
Figure6:Resampling of 5 mm slice DICOM to 1 mm slices for CT abdominal image
4.2 Kidneys region of interest experiment
The dataset had a total of about 62 patients,each patient had more than one hundred slices after DICOM resampled from 5 mm slice to 1 mm slice,and more than one phase of CT scans(arterial,delayed,portal venous,non-contrast).The dataset includes a diagnosis report for each patient.All images are in DICOM format with horizontal and vertical resolution of 72 DPI,and bit depth of 24 bits.We preprocessed the raw DICOM CT images from 512*512 pixels with 5 mm slice thickness to 500*500 pixels and 1 mm slice thickness.The proposed approach was tested on 62 patients.The accuracy of the proposed approach is measured using Mean Square Error,Correlation,Dice Coefficient,True Positive Ratio,precision and recall.The proposed CT region of interest approach was programmed in python and other python Native image processing libraries.The experiment used two different set of hardware,first one is a standard PC with Intel Core 2 Duo with 8GB memory,the second one is a GPU powered machine.After applying our algorithm to the slice sequence for kidney region of interests we will get results like this Fig.7.
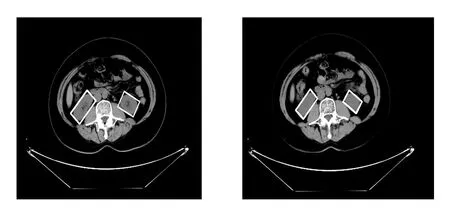
Figure7:Results for tracking features across slice sequence for kidneys
4.3 Results
Four measurements were used to evaluate the performance of the presented approach.These measurements were Mean Square Error,Dice Coefficient,Correlation and True Positive.
4.3.1 Mean square error
We evaluated our approach and compared with two other major approaches:Seed Launch on Elliptical Area(SLEA)and Seed Launch into Square Area(SLSA)[Anastácio,Thomaz,de Moraes et al.(2015)].Using mean square error after apply the output region of interest to classical segmentation technique called Region Growing.We calculate the Mean Squared Error(MSE)to analyze which one has the lowest error when compared with manual segmentation see Fig.8.Our proposed method demonstrated excellent results,as region growing has very accurate segmentation given an input from our proposed method.See Tab.2 shows a summarized MSE Evaluation of the proposed method.

Figure8:MSE evaluation setup comparing SLSA,SLEA and our proposed method
Fig.8 shows an evaluation setup comparing the MSE for SLSA,SLEA and our proposed method applied output region of interest to classical segmentation technique called Region Growing.

Table2:Summarised MSE evaluation for the proposed method compared with SLSA and SLEA
4.3.2 True positive
The true positive ratio measure is calculated by dividing the number of true positive(mean pixels that actually belong to liver or kidney region)by the total number of liver/kidney region pixels.We mainly used True Positive Ratio for the seed point detection algorithm accuracy.The seed point detection accuracy for the first slide in the CT sequence is a vital part of the proposed method,as if this part have false detection this will make the entire method to have inaccurate results.Eq.(8)shows the True positive rate.

4.3.3 Dice coefficient
Dice coefficient is statistical validation metric to evaluate spatial overlap accuracy between two binary images.It is commonly used in reporting the performance of segmentation results.Its values range between 0 and 1,where 0 indicate no overlap and 1 perfect agreement[Dice(1945)].It is calculated using Eq.(11).Correlation is another measurement to indicate how strong relationship between two binary images.1 indicates a strong positive relationship,-1 indicates a strong negative relationship and 0 indicates no relationship at all.It is calculated using Eq.(10).

We used quantitative and qualitative analysis to measure the accuracy against the given ground truth and our results presented a better performance than other generic approaches for automatic liver segmentation.
Precision(also called positive predictive value)is the fraction of relevant instances among the retrieved instances,while recall(also known as sensitivity)is the fraction of relevant instances that have been retrieved over the total amount of relevant instances
We evaluated our approach and compared with two other major approaches Seed Launch on Elliptical Area(SLEA)and Seed Launch into Square Area(SLSA)using mean square error after apply the output region of interest to classical segmentation technique called Region Growing.We calculate the Mean Squared Error(MSE)to analyze which one has the lowest error when compared with manual segmentation.
4.4 Quantitative evaluation
Quantitative research is often contrasted with qualitative research,which is the examination,analysis and interpretation of observations for the purpose of discovering underlying meanings and patterns of relationships,including classifications of types of phenomena and entities,in a manner that does not involve mathematical models.We evaluate the results using precision and recall methods.Precision(also called positive predictive value)is the fraction of relevant instances among the retrieved instances,while recall(also known as sensitivity)is the fraction of relevant instances that have been retrieved over the total amount of relevant instances.Both precision and recall are therefore based on an understanding and measure of relevance.We calculated the liver volume errors as deviations between the automatically determined liver volumevolautomaticand the manually determined liver volumevoltrueby radiologists.We calculated the true positive volume error(TPVE)as(Eq.(11)):

Tab.3 shows a summarized Evaluation of the proposed method.

Table3:Summarised Evaluation for the Proposed Method
Tab.4 shows an average True Positive rate compared to other methods over the years.

Table4:Average true positive rate compared to other methods
For the quantitative result after evaluation it clearly demonstrates that our proposed method is superior in terms of accuracy.
4.5 Qualitative evaluation
Qualitative methods examine the why and how of decision making,not just What,Where,When,or"Who",and have a strong basis in the field of sociology to understand government and social programs.Qualitative research is popular among political science,social work,and special education and education searchers.Qualitative properties are properties that are observed and can generally not be measured with a numerical result.They are contrasted to quantitative properties which have numerical characteristics.Human factors‘human work capital’are probably one of the most important issues that deals with qualitative properties.Some common aspects are work,motivation,general participation,etc.Although all of these aspects are not measurable in terms of quantitative criteria,the general overview of them could be summarized as a quantitative property.We designed a questionnaire for an expert radiologist to access the results of the proposed both for Liver Region of interest.Tab.5 provides the evaluation summary by the radiologist.
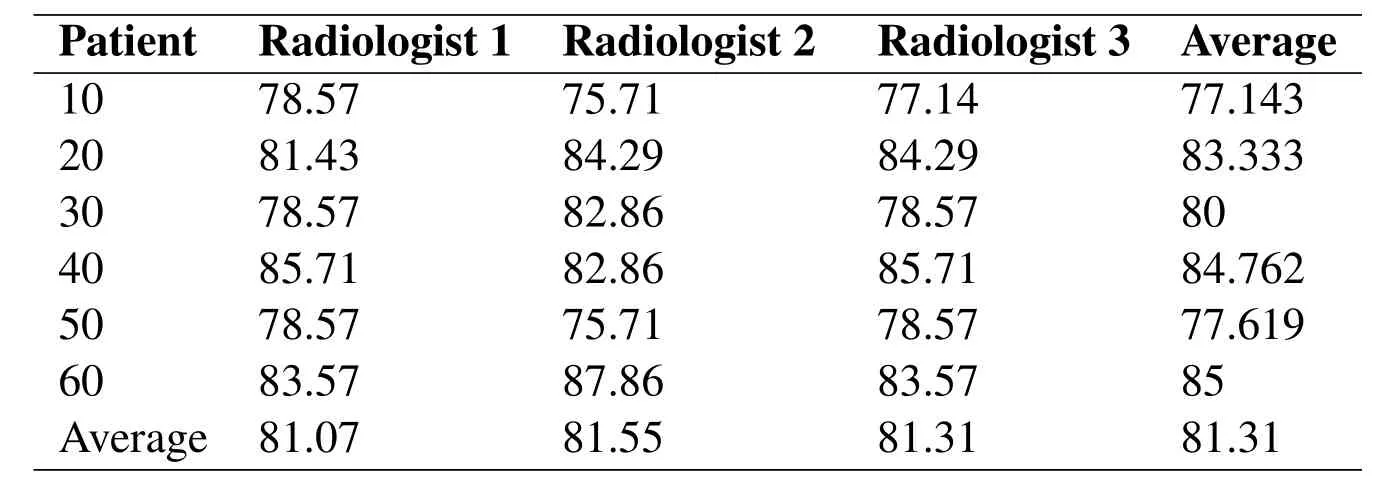
Table5:Radiologist evaluation results
5 Conclusion
We propose a novel approach of automatically identifying region of interest in Computed Tomography Image(CT)images based on temporal and spatial data.Our method is a 3 stages approach,1)We extract organ features from the CT images by adopting the Hounsfield filter.2)We use these filtered features and introduce our novel approach of selecting observable feature candidates by calculating contours’area and automatically detect a seed point.3)We use a novel approach to track the growing region changes across the CT image sequence in detecting region of interest,given a seed point as our input.We used quantitative and qualitative analysis to measure the accuracy against the given ground truth and our results presented a better performance than other generic approaches for automatic liver segmentation.The experimental results show that the proposed approach gives better result and obtained over all accuracy about 97 of good organ extraction.This results from proposed approach can help for further diagnosis and treatment planning.In the future work,we plan to increase the number of CT images to evaluate the performance of the proposed method.
杂志排行
Computers Materials&Continua的其它文章
- Developing a New Security Framework for Bluetooth Low Energy Devices
- A Review on Fretting Wear Mechanisms,Models and Numerical Analyses
- A Hierarchical Trust Model for Peer-to-Peer Networks
- Waveband Selection with Equivalent Prediction Performance for FTIR/ATR Spectroscopic Analysis of COD in Sugar Refinery Waste Water
- Maximum Data Generation Rate Routing Protocol Based on Data Flow Controlling Technology for Rechargeable Wireless Sensor Networks
- Message Authentication with a New Quantum Hash Function
