Determination of 24 Allergens in Perfume with High Performance Liquid Chromatography Tandem Mass Spectrometry
2019-03-27WangYujianLiangZhengangFuLingmei
Wang Yujian, Liang Zhengang, Fu Lingmei
Technology Center of Hainan Entry-Exit Inspection and Quarantine Bureau China, China
Dong Cunzhu
College of Environment and Plant Protection, Hainan University, China
Abstract A method of 24 allergens determination in cosmetics were established with high performance liquid chromatography tandem mass spectrometry. The targeted compounds were extracted with acetonitrile and determined with LC-MS/MS (MRM mode) with external method. The linearity between concentrations and peak area ratio was obtained from 1.0~5.0 mg/L. The limits of detection were 1.0 mg/L for the instrument and 5.0 mg/kg for the method respectively. The LOQ was 15.0 mg/L. The average recoveries of 24 allergens were between 85.9% and 110.0% at spiked levels of 5, 10 and 20 mg/kg with relative standard derivation (RSDs) of 5.5%~12.0% (n=10). The method could be used as a reliable means for simultaneous quantitative determination of allergens in cosmetics.
Key words perfume; allergens; flavor; high performance liquid chromatography tandem mass spectrometry
Perfumes were composed mainly of fragrances and alcohol. Micro pigment, antioxidant, antiseptic,glycerine, surfactant were added as needed. The content of fragrances in perfume was 15%~25%approximately.[1]According to literature,[2]35%cosmetic allergy cases were induced by fragrances at least. Fragrances could cause skin allergies through direct contact, breathing, or photosensitization. It was a nonnegligible allergen. In 2003, EU Directive 76/768/EEC revised edition stipulated that 26 flavors should be marked on the label of cosmetics if they exceeded 0.001% in non-washable cosmetics or 0.01% in washable cosmetics from March 11, 2005 (Annex 3 of EU cosmetic directive).[3,4]Among the 26 flavors, two types were natural extracts (oakmoss and treemoss), the others were volatile compounds. At present, the determination of allergens in cosmetic included gas chromatography,[5]gas chromatography-mass spectrometry,[6-9]liquid chromatography,[10,11]online thermal analysis-gas chromatography-mass spectrometry,[12]volumetric exclusion/gas chromatography-mass spectrometry,[13]gas chromatography-Fourier transform infrared spectrometry,[14]multi-dimensional gas chromatography and multi-dimensional gas chromatography-mass spectrometry[15-18]et al. However, perfume had too much interfering volatile substances to determine through gas chromatography, gas chromatography mass spectrometry and liquid chromatography. The defection included the higher baseline, the more interfering peaks which could reach more than 100 peaks,[19]and the longer analysis time and the lower peak separation degree. Other methods had advantages in specificity, but they have some shortcomings such as poor generality, difficulty in popularization .

High performance liquid chromatographytandem mass spectrometry could obtain strong excimer ion peaks under the condition of first-order mass spectrometry, and the excimer ions could be splitted by second-order mass spectrometry to obtain abundant structural information.[20]In this paper, a high performance liquid chromatography tandem mass spectrometry (HPLC/MS/MS) method was developed for simultaneous determination of 24 common flavoring substances in perfumes. A rapid online qualitative, quantitative analysis and screening were carried out to identify the 24 common allergens in perfume, so as to meet the needs of quality control and market supervision.
Materials and methods
Main instruments and reagents
Agilent 1200 Ultra High Performance Liquid Chromatography, Agilent Corporation, USA; API 4000Q Quadrupole Mass Spectrometer (equipped with Electrospray Ion Source), ABI Corporation,USA; Harvard II Needle Pump, Varian Corporation,USA; MS3 Basic Vortex Mixer, IKA Company,Guangzhou; Centrifuge 5810R Centrifuge, Eppendorf Company, Germany; G-285 Electronic Balance,Mettler Toledo, Switzerland.
Solvent: acetonitrile and formic acid (chromato graphic purity degree), TEDIA Company, USA; 24 allergens certified reference standards: benzyl salicylate(CAS:118-58-1), α-iso-methylionone (CAS:127-51-5),α-amyl cinnamic aldehyde (CAS:122-40-7), β-citronellol(CAS:106-22-9), benzyl cinnamate (CAS:103-41-3),methyl 2-octynoate (CAS:111-12-6), α-amylcinnamyl alcohol (CAS:101-85-9), geraniol (CAS:106-24-1),benzyl alcohol (CAS:100-51-6), lyral (CAS:31906-04-4), linalool (CAS:78-70-6), dodecatrienol (CAS:4602-84-0), cinnamic aldehyde (CAS:104-55-2), coumarin(CAS:91-64-5), α-hexylcinnamaldehyde (CAS:101-86-0), eugenol (CAS:97-53-0), benzyl benzoate (CAS:120-51-4), isoeugenol (CAS:97-54-1), lily aldehyde (CAS:80-54-6), cinnamic alcohol (CAS:104-54-1), anisalcohol(CAS:105-13-5), citral (CAS:5392-40-5), α-limonene(CAS:5989-27-5), hydroxycitronellal (CAS:107-75-5),Dr. Ehrenstorfer, Germany; 100 mg/L standard solution:prepared with methanol and stored in dark at 0-4 ℃.
Sample pretreatment
The perfume samples were accurately weighed 2 g (accurate to 0.01 g) in the test tube with a stopper scale, fixed volume to 10 mL with acetonitrile,swirling blended and filtered with 0.22 M membrane filtration.
Chromatographic conditions
The chromatographic column was Thermo Accuore Phenyl-Hexyl Column (150 mm×3 m, 2.6 μm); the mobile phase A was acetonitrile and B was 0.05%formic acid solution (containing 5 mmol/L ammonium acetate). The gradient elution procedure was as follows:0~6.0min, 10%A~90%A; 6.0~8.0 min, maintaining 90%A; 8.0~8.1 min, 90%A~10%A; 8.1~13.0 min,maintaining 10%A. The flow rate was 600 μL/min and the injection volume was 10 μL.
Mass conditions
The determination was carried out with Electrospray Ion Source and positive mode. The temperature of Ion Source was 650 ℃ with 5,500V voltage. The nebulizer gas, curtain gas, auxiliary gas and collision gas were all high purity nitrogen gas. MRM monitoring ion pairs, declustering voltage and collision voltage were shown in Table 1.
Results and discussion
Selection of chromatographic columns
Hillic column, BEH Amide column, ADME column and Phenyl-hexyl column were compared. When Hillic column and BEH Amide column were used, the retention of many target compounds were poor, the peaks were earlier and the separation degrees were poor.When ADME column was used, cinnamyl alcohol and β-citronellol appeared as acromions, and the adjustment of mobile phase even could not solve it. When Phenylhexyl column was used, the peak shapes, responses and separation degrees of 24 target compounds were excellent, so Phenyl-Hexyl column was selected.
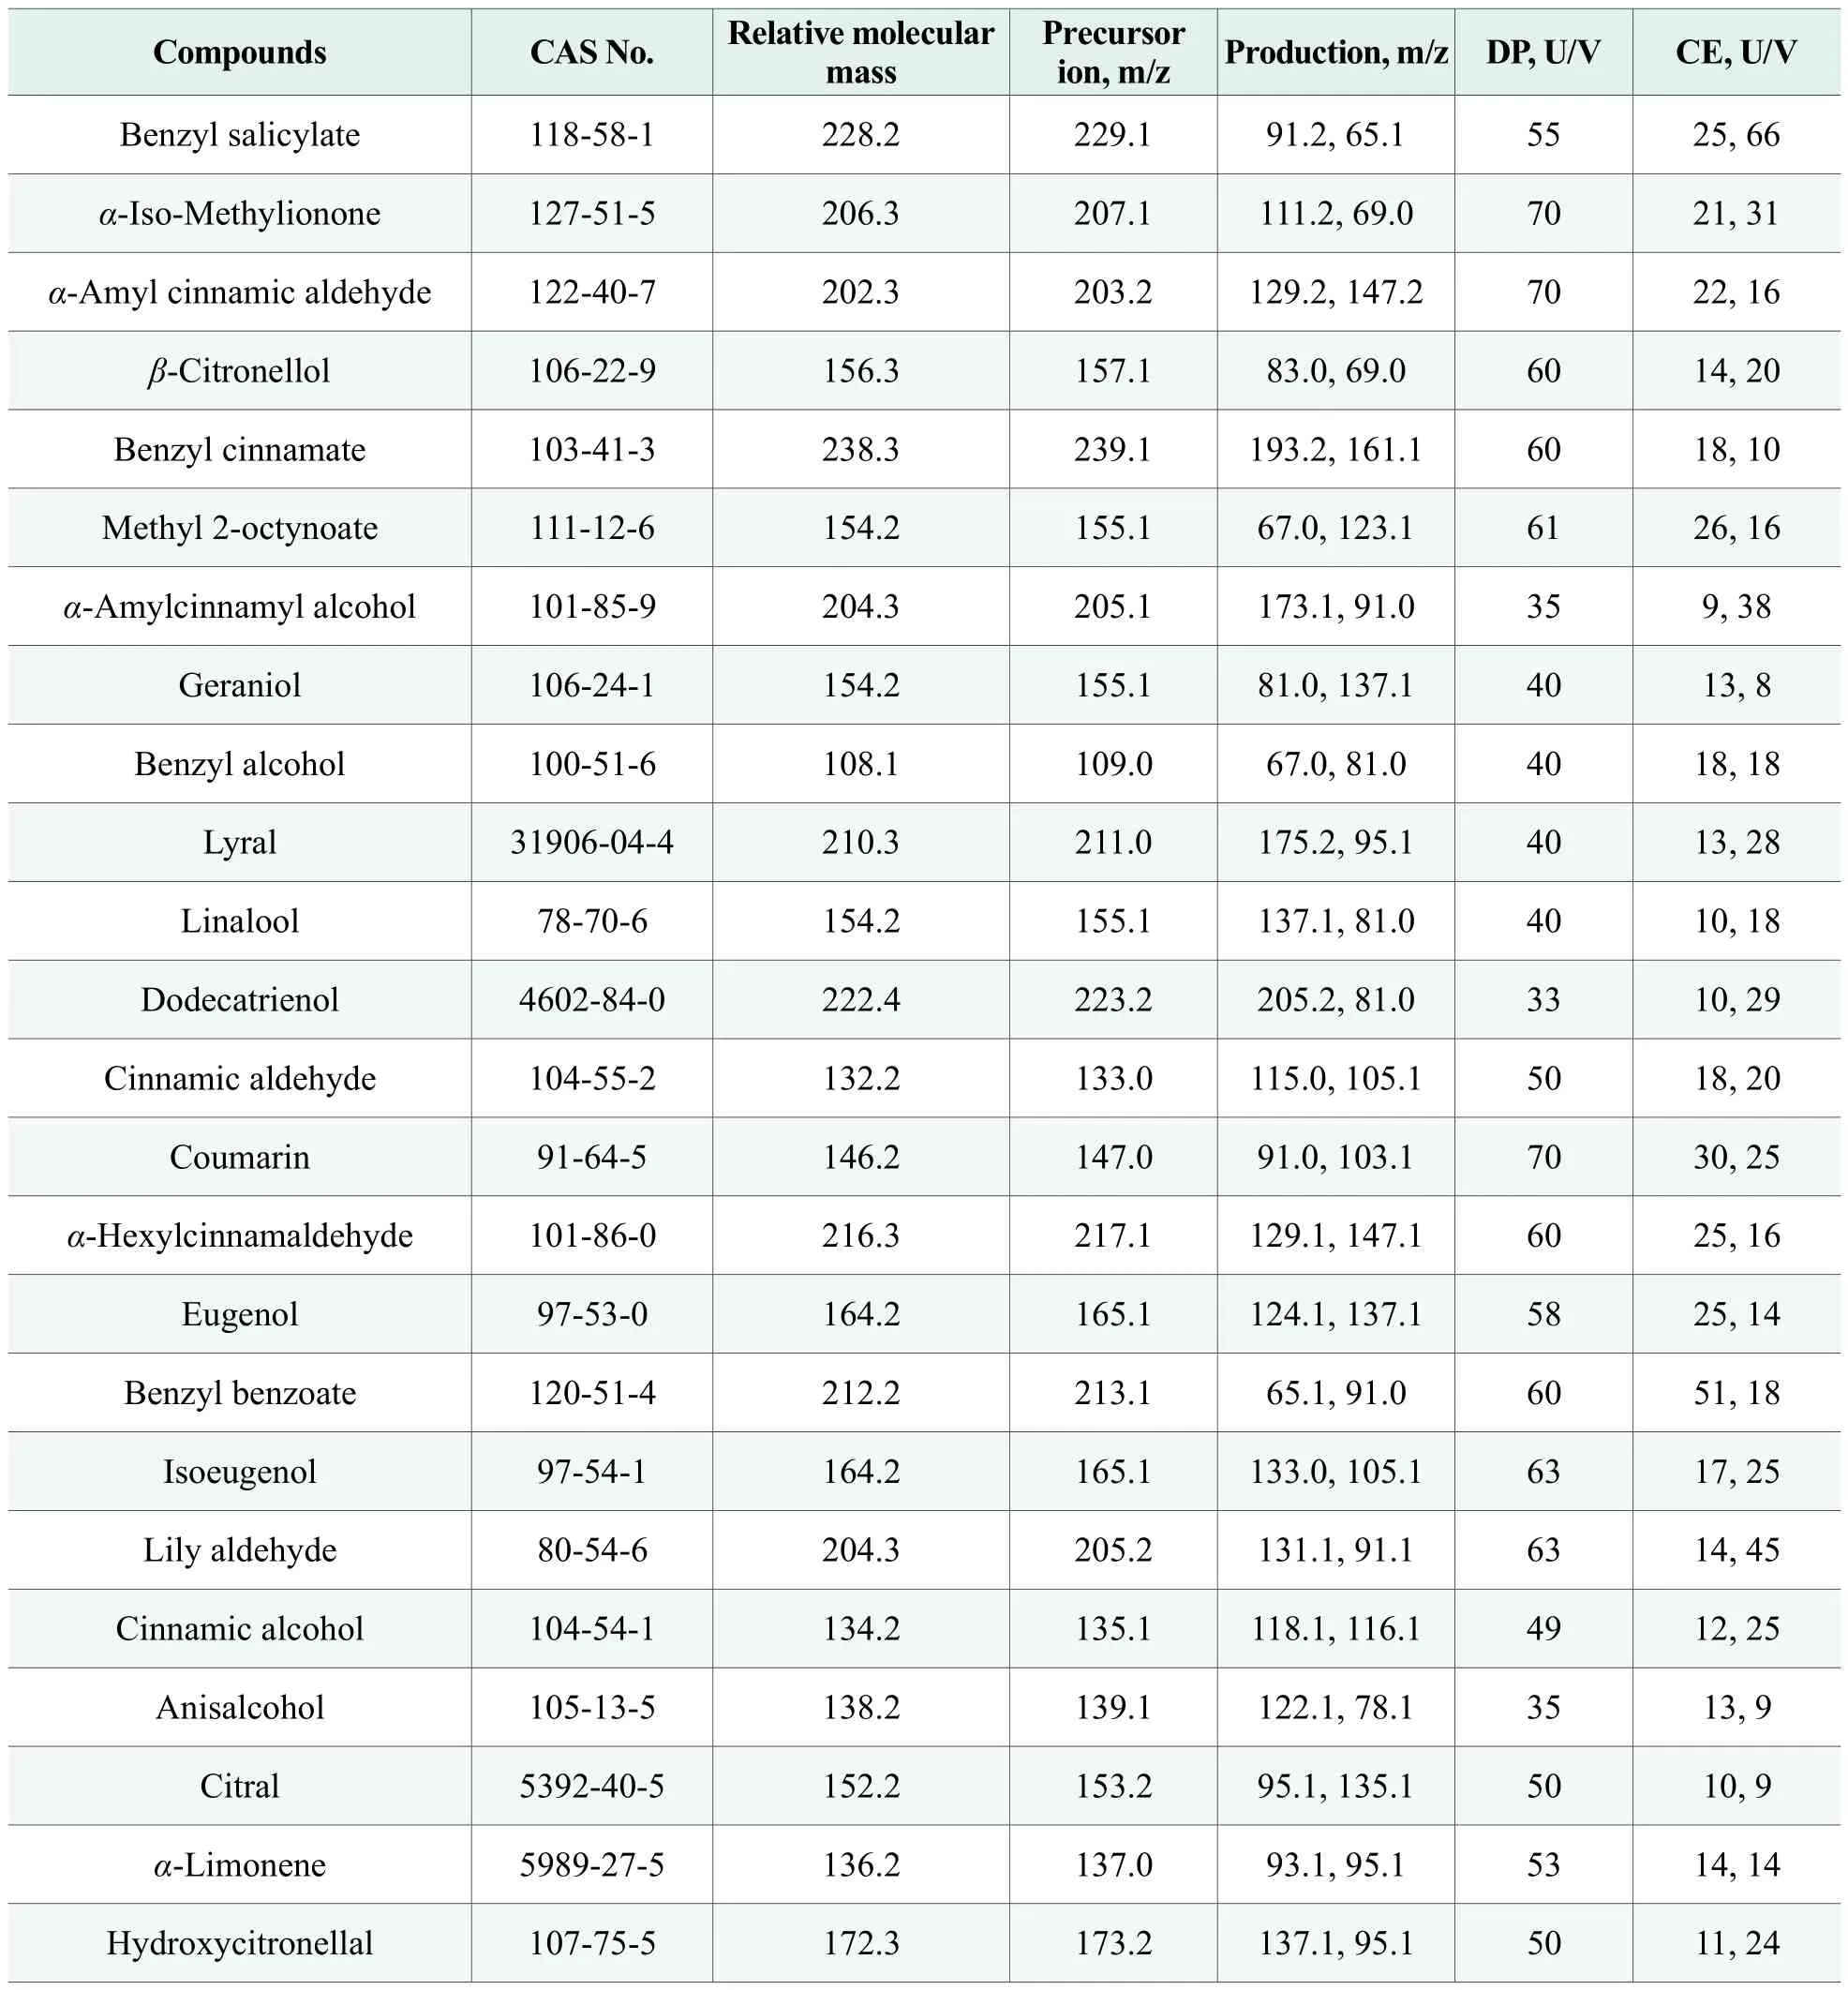
Table 1. The optimized MS/MS conditions for 24 allergens
Selection of mobile phase
The responses of the target compounds were investigated when acetonitrile or methanol was used as mobile phase. The results showed that the responses of the target compounds were good when methanol-water was used as mobile phase. However, the baseline was unstable and high. It could reach three times higher than that of the acetonitrile-water mobile phase system.When using the acetonitrile-water mobile phase system, the baseline was stable and the background value was not high, meanwhile the peak shapes were good. The response could also meet the detection requirements. In a summary, the acetonitrile-water was chosen as mobile phase system.
It was also found that the ionization efficiency of benzyl alcohol and linalool could be significantly improved by adding formic acid and ammonium acetate in the mobile phase, and the responses were significantly enhanced. Considering the influence on the instrument, acetonitrile-0.05% formic acid solution (containing 5 mmol/L ammonium acetate)was selected as mobile phase system.
Selection of mass spectrum condition
The standard solution of 24 target compounds was injected directly by flow injection. The precursor ions of the compounds were selected by full scanning. The precursor ions were scanned to obtain the second-order mass spectrometry by optimizing the condition. The ion pairs with high relative abundance, the qualitative and quantitative ion pairs, were acquired through multireaction ion monitoring (MRM). The parameters of declustering voltage (DP) and collision voltage (CE)were optimized. Considering the ion abundance and background interference, the optimum mass spectrometry conditions were defined as shown in Table 1.
The linearity and detection limit
A brand of toner samples for sensitive skin with similar matrix was selected as a negative sample. A series of mixed standard working solutions of different concentrations (0, 1.0, 2.0, 3.0, 4.0, 5.0, 6.0, 8.0 and 10 mg/L) were prepared with the negative sample.The MRM chromatogram of 24 flavoring allergens standard was shown in Figure 1.
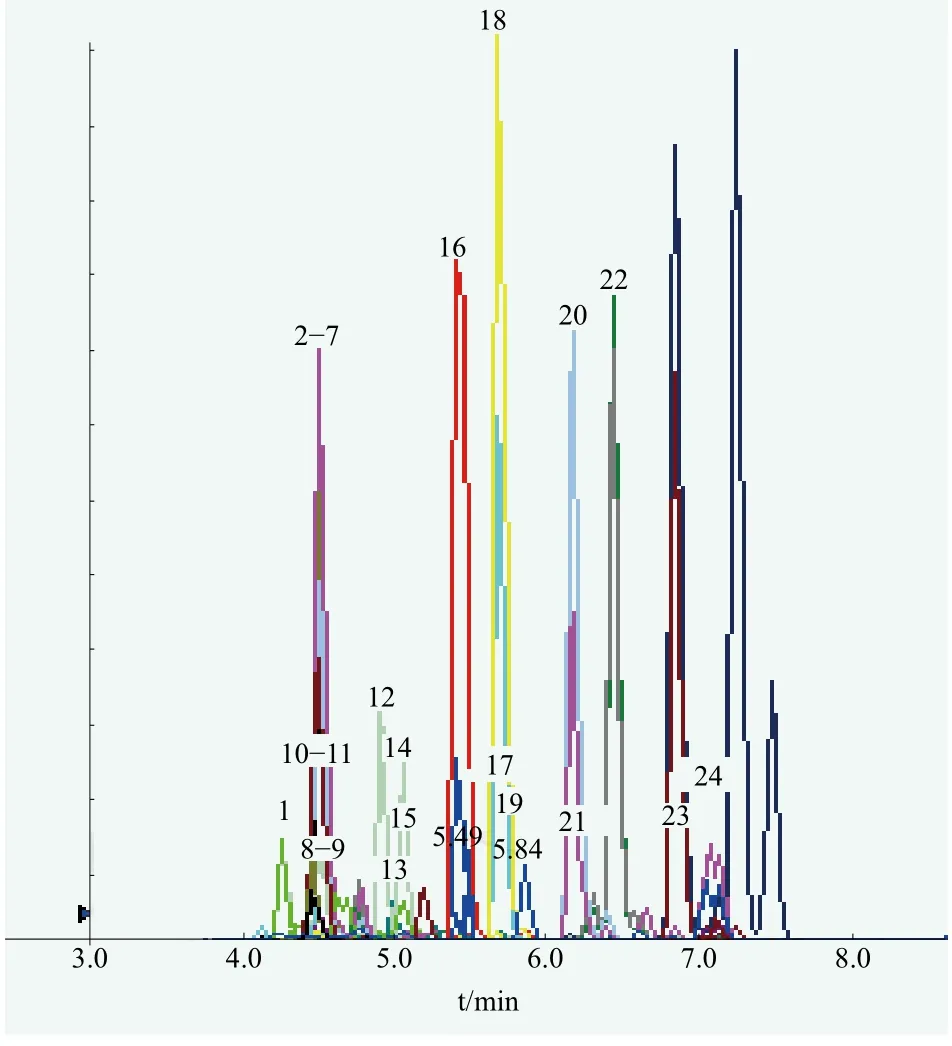
Figure 1. Product ions full scan mass spectra of 24 targeted compounds
With the peak area (Y) of the target compound as the ordinate and the corresponding mass concentration (X) as the abscissa, the standard curves were drawn. The linear equations and correlation coefficients of 24 allergens were shown in Table 2. The data in Table 2 revealed that the mass concentrations in the range of 1.0-5.0 mg/L had a good linear relationship with the peak areas. The correlation coefficients were all above 0.99.
When the signal-to-noise ratio was 3, the Instrument Detection Limits of the 24 allergens could reach 1.0 mg/L.The Method Detection Limits could reach 5.0 mg/kg, and the Quantitative Detection Limit could reach 15.0 mg/kg.
The recovery and precision
The recovery and precision of spiked samples were tested by using the brand of toner for sensitive skin as a negative matrix. The spiked levels including low, medium and high levels (5, 10 and 20 mg/kg)were carried out in 2.0 g (accurate to 0.01 g) negative samples. Every level tested 10 times to obtain the spiked recoveries and relative standard deviations.The specific data were shown in Table 3.
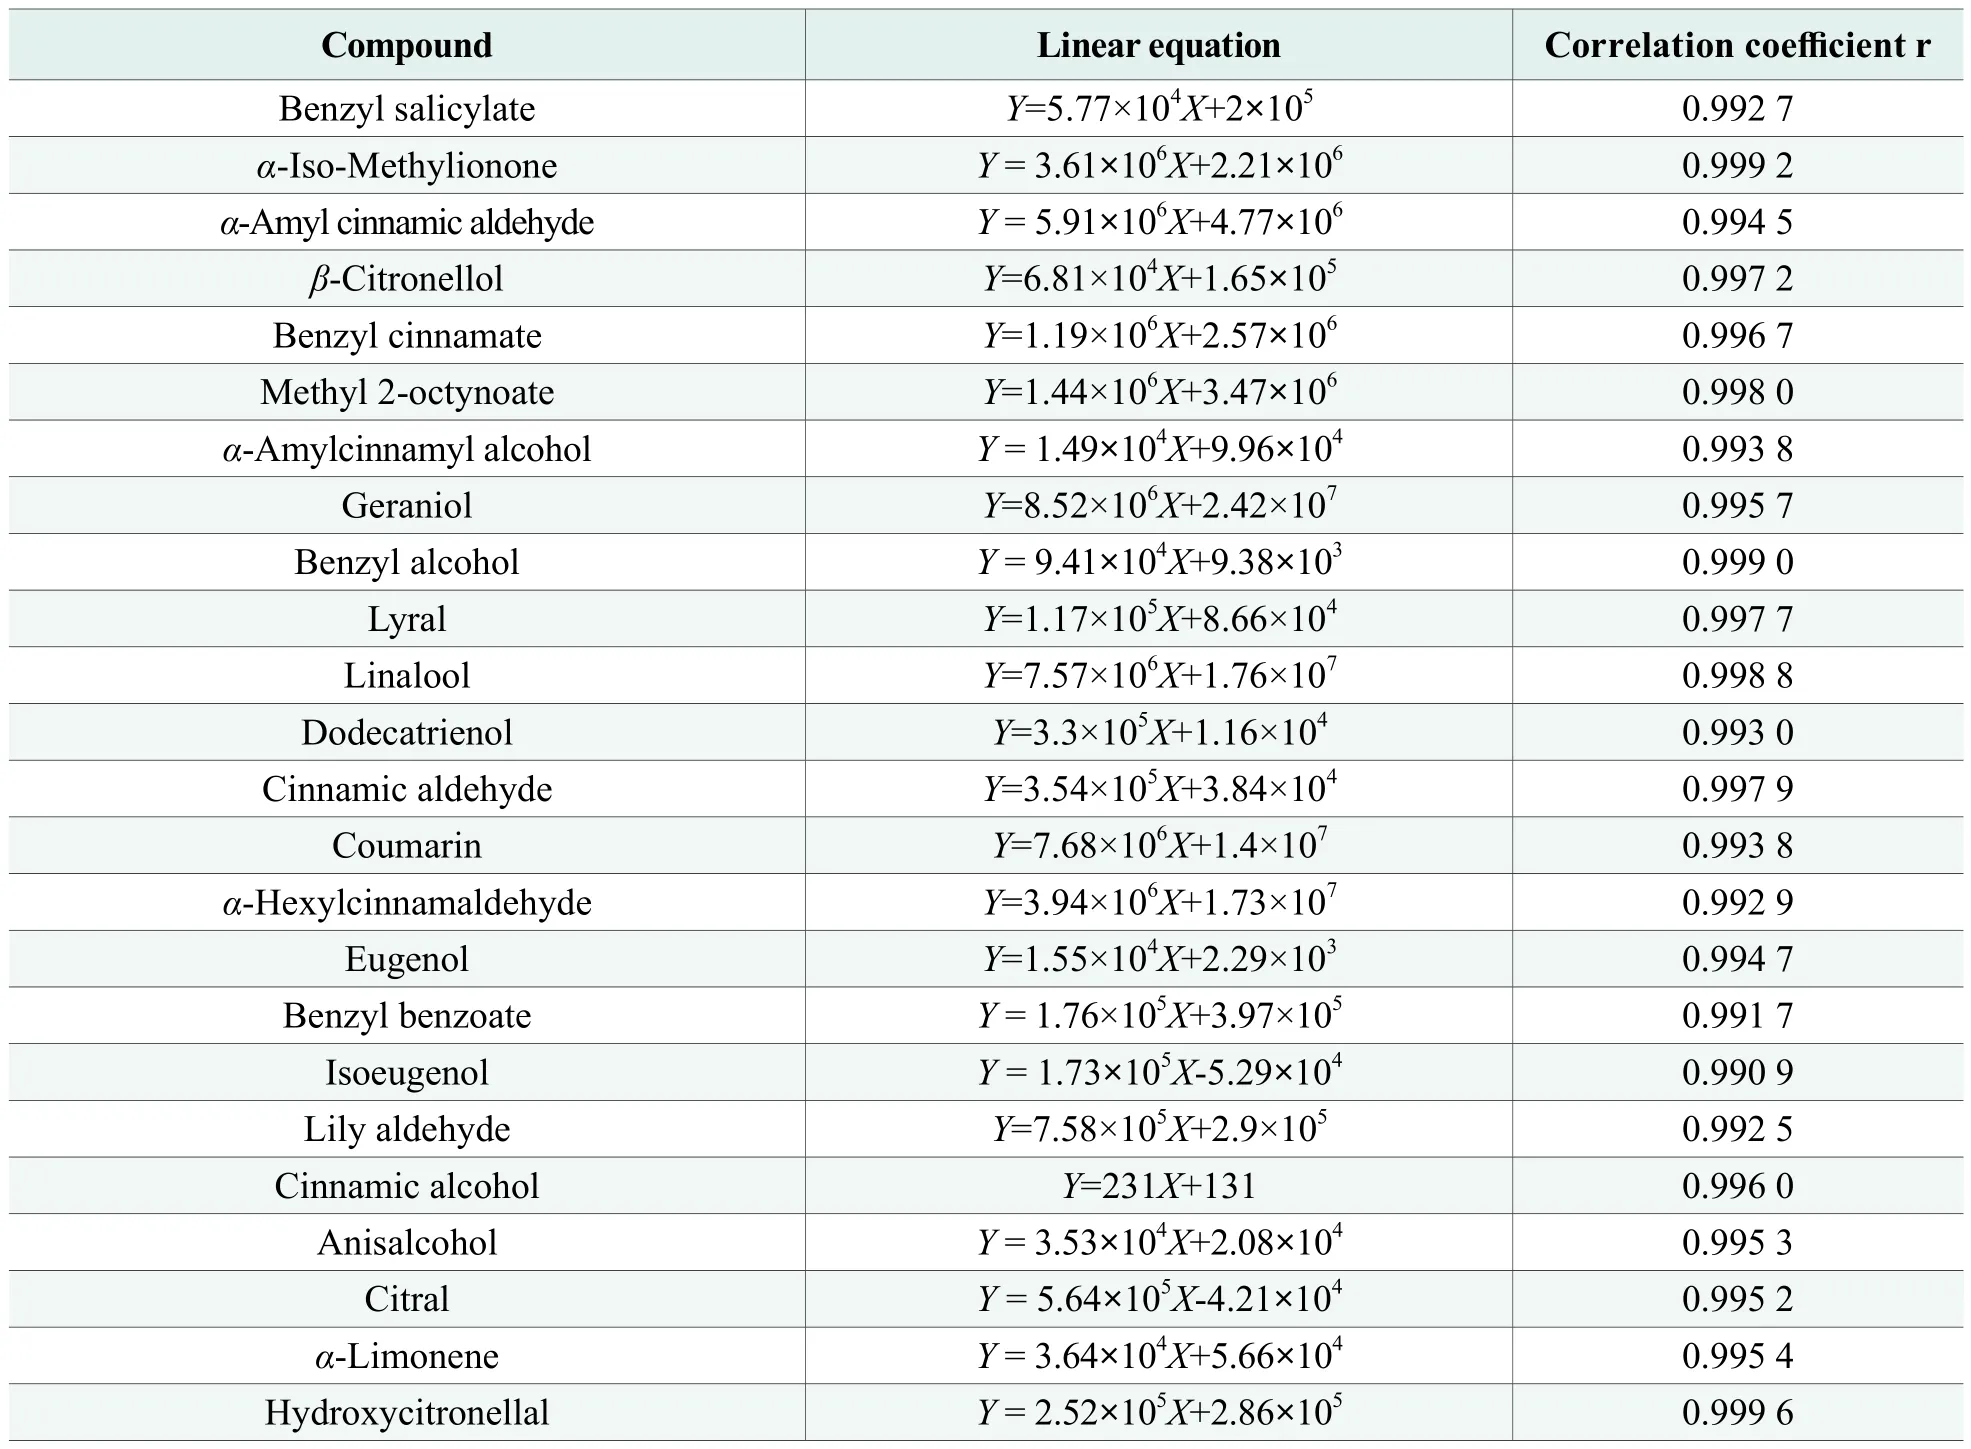
Table 2. Linear equations and correlation coefficients of 24 targeted compounds
From Table 3, it can be seen that the spiked recoveries of negative samples were between 85.9%and 110.0%, and the relative standard deviations were between 5.5% and 12.2%, which meets the requirements of SN/T 4531-2016 “Guidelines for Quality Control of Food and Cosmetics for Import and Export (Chemical Analysis)”.
The MRM chromatogram of negative sample and spiked sample were shown in Figure 2.
Samples testing
Four kinds of perfume purchased on the market were tested with the established method. 4, 11, 12 and 16 kinds of perfume allergens compounds were detected respectively. Among them, the highest detection rate of allergens were lilac aldehyde and amyl cinnamyl alcohol which were found in 4 samples. The contents were between 5.7~58 mg/kg and 23~76 mg/kg respectively.The next were hydroxyl citronella and alpha methanone which were found in 3 samples. The contents were between 9.5-25 mg/kg and 5.4-843 mg/kg.
Conclusion
A high performance liquid chromatography tandem mass spectrometry (HPLC/MS/MS) method was developed for simultaneous determination of 24 allergens in perfumes. This method had the advantages of simpleness, fast pretreatment, accurate detemination, easy operation and good repeatability. It could make up for the defect of gas chromatography-mass spectrometry in separation and actual quantification. The peak of allergens with higher detection rates, such as hydroxycitronellal and α-isomethyl ionone, had good shapes. In the meantime, the separation degrees between the extracted ion pair and the baseline were improved. This method could realized rapid detection of large quantities of samples and meet the international requirements for label detection of 24 allergens in fragrance products.
This paper was supported by The National Natural Science Foundation of China (Grant No. 31360447)and The National Natural Science Foundation of Hainan Province (Grant No. 20162036).

Table 3. Spiked recoveries and RSDs of allergens (n=10)

Figure 2. MRM chromatogram of toner
杂志排行
China Detergent & Cosmetics的其它文章
- YUNNAN BAIYAO's Absorption and Merger of YUNNAN BAIYAO Holdings Passed Audit
- The Methodology of Cosmetics Efficacy Evaluation to Provide Scientific Support for Soothing Skin Efficacy Claims
- JD Worldwide Added Three More Korean Beauty Brands
- Editorial Board of CDC
- Wish a Perseveringly and Fantastic 2019
- National Medical Products Administration:The Product Claiming Using “Cosmeceuticals” or “EGF” Was Illegal
