Relationships among KRAS mutation status, expression of RAS pathway signaling molecules, and clinicopathological features and prognosis of patients with colorectal cancer
2019-02-27XiangBinWanAiQinWangJianCaoZhiChuangDongNingLiSenYangMiaoMiaoSunZhiLiSuXiaLuo
Xiang-Bin Wan, Ai-Qin Wang, Jian Cao, Zhi-Chuang Dong, Ning Li, Sen Yang, Miao-Miao Sun, Zhi Li,Su-Xia Luo
Abstract BACKGROUND The RAS/RAF/MEK/ERK and PI3K/AKT/mTOR signaling pathways all belong to mitogen-activated protein kinase (MAPK) signaling pathways, Mutations in any one of the upstream genes (such as the RAS gene or the BRAF gene) may be transmitted to the protein through transcription or translation, resulting in abnormal activation of the signaling pathway. This study investigated the relationship between the KRAS gene mutation and the clinicopathological features and prognosis of colorectal cancer (CRC), and the effect of KRAS mutations on its associated proteins in CRC, with an aim to clarify the cause of tumor progression and drug resistance caused by mutation of the KRAS gene.AIM To investigate the KRAS gene and RAS pathway signaling molecules in CRC and to analyze their relationship with clinicopathological features and prognosis METHODS Colorectal cancer tissue specimens from 196 patients were analyzed for KRAS mutations using quantitative polymerase chain reaction and for KRAS, BRAF,MEK, and ERK protein expression levels using immunohistochemistry of tumor microarrays. To analyze differences of RAS pathway signaling molecule expression levels in different KRAS gene status, the relationships between these parameters and clinicopathological features, 4-year progression-free survival, and overall survival were analyzed by independent sample t test, Kaplan-Meier plots,and the log-rank test. Predictors of overall and disease-free survival were assessed using a Cox proportional hazards model.RESULTS Of the 196 patients, 62 (32%) carried mutations in codon 12 (53/62) or codon 13(9/62) in exon 2 of the KRAS gene. KRAS, BRAF, ERK, and MEK protein expression was detected in 71.4%, 78.8%, 64.3%, and 50.8% of CRC tissues,respectively. There were no significant differences between KRAS mutation status and KRAS, BRAF, MEK, or ERK protein levels. Positive expression of KRAS and ERK was associated with poor tumor differentiation, and KRAS expression was also associated with age < 56 years. MEK expression was significantly associated with distant metastasis (P < 0.05). The 4-year progression-free survival rate, but not overall survival rate, was significantly higher in patients with KRAS-negative tumors than in those with KRAS-positive tumors (P < 0.05), whereas BRAF, MEK,and ERK expression was unrelated to survival. Multivariate analysis showed that only the expression of KRAS protein was a risk factor for tumor recurrence (P <0.05). No other clinicopathological factors correlated with KRAS, BRAF, MEK, or ERK expression.CONCLUSION KRAS gene mutations do not affect downstream protein expression in CRC.KRAS protein is associated with poor tumor differentiation, older age, and a risk of tumor recurrence.
Key words: Colorectal cancer; KRAS gene; KRAS protein; BRAF protein; MEK protein;ERK protein
INTRODUCTION
Colorectal cancer (CRC) is the most common malignant tumor of the digestive system,and it ranks third in terms of incidence and mortality in both men and women in the United States[1]. According to the latest statistics, the estimated number of new CRC cases and deaths is expected to be 75610 and 27390, respectively, in American men and 64640 and 23240, respectively, in American women in 2018[1]. In China, the incidence of CRC in 2014 was 27.08/100000, and it is the fourth most common cancer among men and the third most common cancer among women[2]. In major Chinese cities, the incidence of CRC is even higher. In 2014, the incidence among men and women in Beijing was 44.12/100000 and 36.26/100000, respectively, and was the second and fourth most common cancer, respectively[3]. Improvements in the economy and living standards in China have increased both CRC morbidity and mortality.
CRC develops via a complex process involving multiple genes and signal transduction pathways[4,5]. Treatment of colonic cancer patients is highly dependent on the depth of tumor invasion (T-stage) as well as the extension of lymph node involvement (N-stage), which could be precisely evaluated today[6-11]. The main treatments include surgery, chemotherapy, and radiotherapy[12]. However, in recent years, several new drugs have been developed, most notably molecular targeted drugs, and the prognosis of CRC patients has greatly improved, especially those with advanced cancer. Nevertheless, resistance to targeted drugs is gradually increasing,and understanding the underlying mechanisms of tumor development and drug resistance has become increasingly important.
The RAS/RAF/MEK/ERK signaling pathway plays a crucial role in the proliferation, differentiation, survival, invasiveness, and metastasis of tumor cells[13-15].This pathway is frequently abnormally activated in CRC, often due to mutations of upstream genes, such as KRAS and BRAF, that result in aberrant transcription or translation, leading to altered protein expression, activity, and/or signaling. In the present study, we examined the relationship between the KRAS gene mutation status and the clinicopathological features and prognosis of CRC patients. KRAS can be activated by many tumor-related proteins and is involved in their function as a network master[16,17]. We also investigated the effect of the KRAS genotype on the expression of BRAF, MEK, and ERK proteins. The results may contribute to our understanding of the underlying causes of tumor progression and drug resistance in KRAS mutant CRC[17].
MATERIALS AND METHODS
Patients
Tissue samples and clinical data (including gender, age at disease onset, tumor site,metastasis site, and tumor differentiation and stage) were collected from 220 CRC patients receiving treatment at the Affiliated Tumor Hospital of Zhengzhou University from January 2012 to December 2013. The average and median age of the patients was 58.4 and 56 years, respectively (range 18-84 years). All patients had complete case data and were followed for 10-58 mo, during which 49 patients died(Table 1). The study was approved by the Medical Ethics Committee of the Affiliated Tumor Hospital of Zhengzhou University, Zhengzhou, China, and all patients provided written informed consent.
Real-time quantitative polymerase chain reaction (qPCR)
Formalin-fixed paraffin-embedded (FFPE) tissue samples were sectioned (3-5 μm thick) and deparaffinized through a series of xylene and ethanol solutions using standard procedures[18]. DNA was extracted from the sections using a QIAamp DNA FFPE tissue kit (Qiagen, Hilden, Germany) according to the manufacturer's instructions. DNA was purified by ethanol precipitation, dissolved in distilled water,and analyzed for concentration and purity using a spectrophotometer (OD260/OD280= 1.8 ± 0.2, OD260/OD230 ≥ 1.7). The total yield per sample was > 50 ng.
The KRAS gene mutation status was analyzed by real-time qPCR using a Human KRAS Gene Mutation Detection Kit (Beijing ACCB Biotech Ltd., Beijing, China). Predenaturation was performed at 95 °C for 10 min, followed by 40 cycles of denaturation at 95 °C for 15 s and annealing and extension at 60 °C for 60 s. If the Ct value was ≤ 38 in the FAM channel, the sample was considered to be KRAS mutation positive; if there was no amplification, the sample was considered mutation negative;if the Ct values were between 30 and 40, the experiment was repeated; and if the same result was obtained, the sample was defined as mutation status uncertain. The mutation site was identified from the fluorescence quantitation curve (Figure 1, Table 2).
Tissue microarray and immunohistochemistry (IHC)
A personal tissue arrayer (Beecher Instruments, Sun Prairie, WI, United States) with a perforated needle of 0.6-mm diameter was used to remove small cylinders from the primary tumor blocks, and they were then placed in an empty ‘recipient' paraffin block. Two blocks were constructed containing a total of 220 tissue sections, each separated by 1 mm[19,20]. KRAS, BRAF, ERK, and MEK proteins were detected using primary antibodies from Abcam (Cambridge, United Kingdom) and a polymer detection MaxVision/HRP kit (Fuzhou Maixin Biotechnology Development Co., Ltd.,Fuzhou, China). Incubation with anti-KRAS (diluted 1:2400), anti-NRAS (1:500), and anti-phospho-MEK1/2 (Ser221; 1:50) lasted for 30 min at room temperature.Incubation with anti-PI3K (p110δa/p85α, 1:400), anti-BRAF (1:50), and anti-phosphop44/42 MAPK (ERK1/2, Thr202/Tyr204; 1:400) lasted for 60 min at room temperature. For the positive control, a human breast cancer tissue sample was stained with the same antibodies. For the negative control, the primary antibodies were substituted with phosphate-buffered saline (PBS).
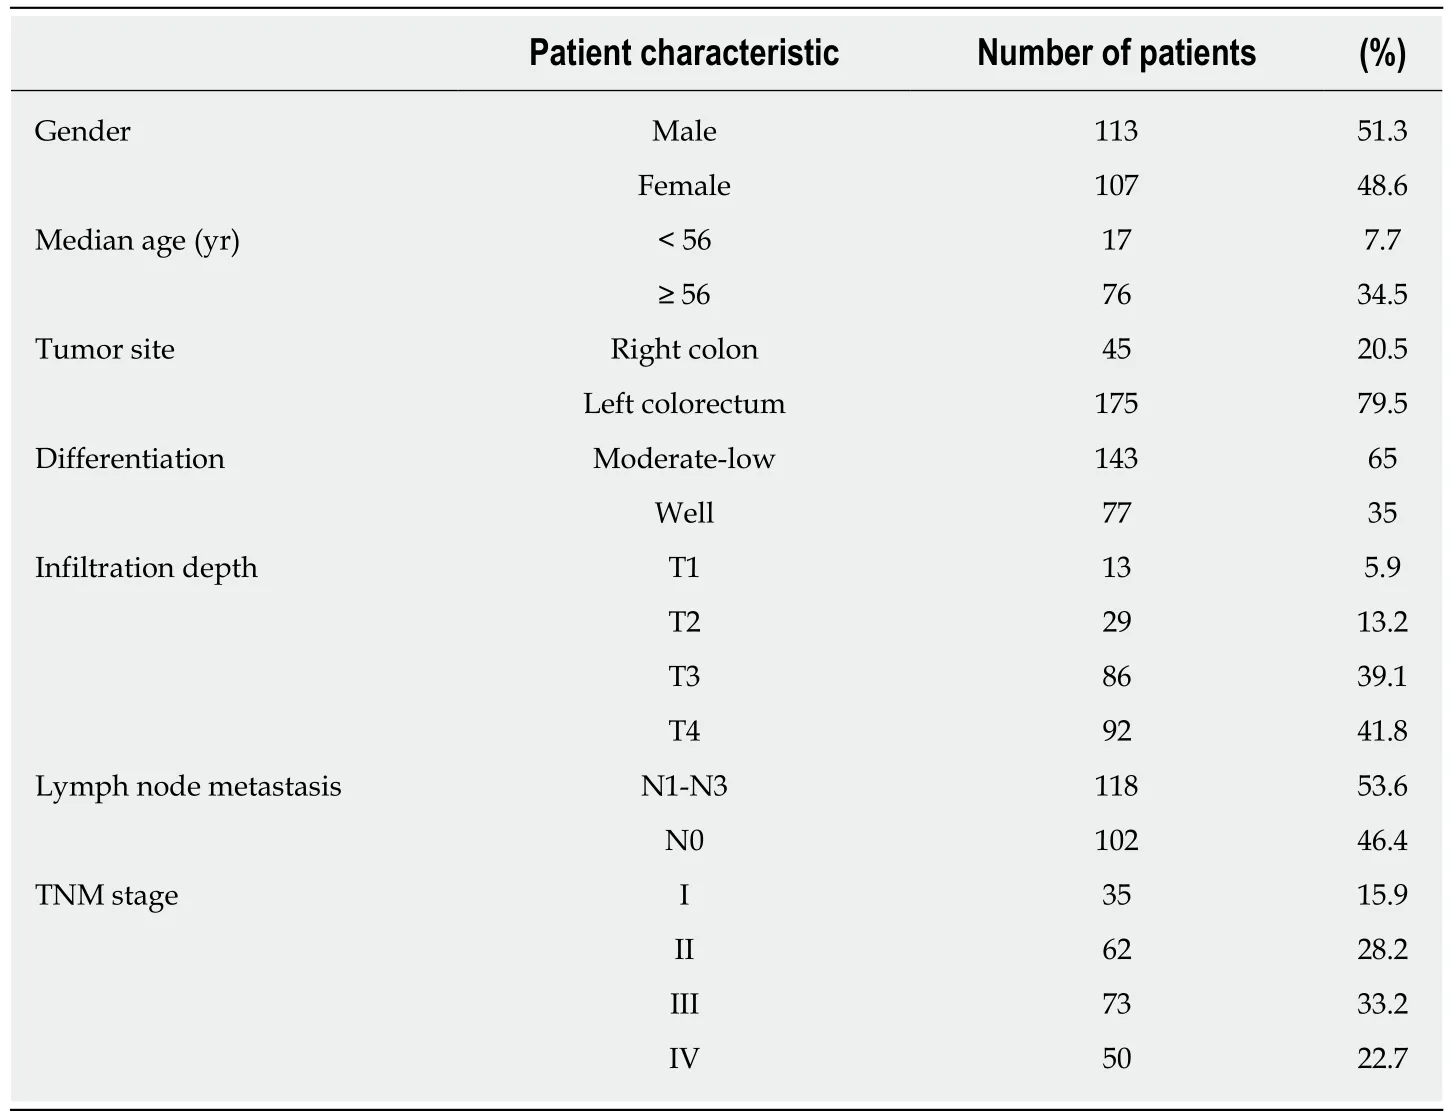
Table 1 Clinicopathological features of the 220 colorectal patients included in this study
Histochemistry score
KRAS, BRAF, ERK, and MEK protein expression was visualized as brown/yellow particles in the cytoplasm or cell membrane. To evaluate expression, we used a semiquantitative histochemistry score (H-score)[21]based on a combination of the percentage of cells positively stained (0 points, 0-4%; 1, 5%-24%; 2, 25%-49%; 3, 50%-74%; and 4, > 75%) and staining intensity (0 points, no color; 1, light yellow; 2, yellow;and 3, brown/yellow). The H-score = ΣPI(I+1), where PI represents the percentage of positive cells and I represents color intensity. The number of positive cells in each section and their staining intensity were converted into the corresponding values.
Statistical analysis
Analyses were performed using SPSS version 20.0 (IBM Corporation, Armonk, NY,United States). A χ² test was used to analyze the relationship between the KRAS gene mutation status and protein expression in CRC tissues. Correlations between clinicopathological parameters and protein expression were evaluated using Fisher's exact test. Progression-free survival (PFS) and overall survival (OS) were analyzed using the Kaplan-Meier method and the log-rank test. A Cox proportional hazards model was applied to identify predictors of OS and disease-free survival. A P-value <0.05 was considered significant.
RESULTS
Of the 220 samples originally obtained, 194-196 were successfully processed by IHC.Therefore, the number of cases available for statistical analysis was 194-196. Of the 196 CRC patients, 62 (31.6%) carried a KRAS mutation in the 12thcodon (53/62) or 13thcodon (9/62) of exon 2. The 12thcodon mutations included GGT→GTT (24 cases),GGT→GAT (21 cases), GGT→GCT (6 cases), and GGT →TGT (2 cases). All nine mutations in the 13thcodon were GGC→GAC (Figure 1).
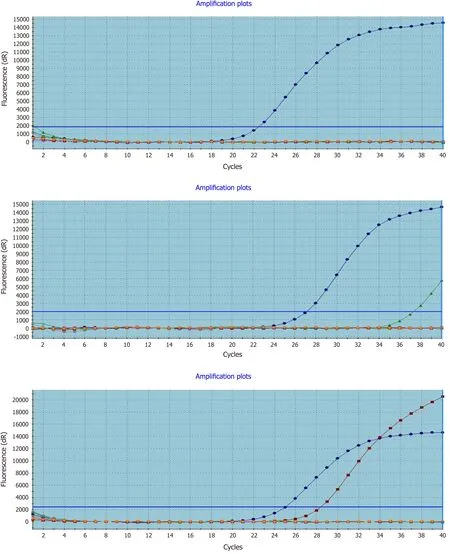
Figure 1 Real-time polymerase chain reaction detection of mutated KRAS in formalin-fixed paraffin-embedded colorectal cancer tissues. Left to right representative amplification plots for samples with wild-type, uncertain mutation status, and mutated KRAS genes.
Relationships between KRAS, BRAF, MEK, and ERK protein expression and clinicopathological features of CRC patients
The expression of KRAS, BRAF, MEK, and ERK proteins was detected by IHC (Figure 2). Of the 194-196 CRC tissues examined, 71.4% (140/196) stained positively for KRAS, 78.8% (153/194) for BRAF, 64.3% (126/196) for MEK, and 50.8% (99/195) for ERK. The expression of KRAS or ERK was associated with poor tumor differentiation(P < 0.05), and KRAS was also associated with age < 56 years (P < 0.05). MEK protein expression was positively associated with distant metastasis (P < 0.05; Tables 3 and 4).
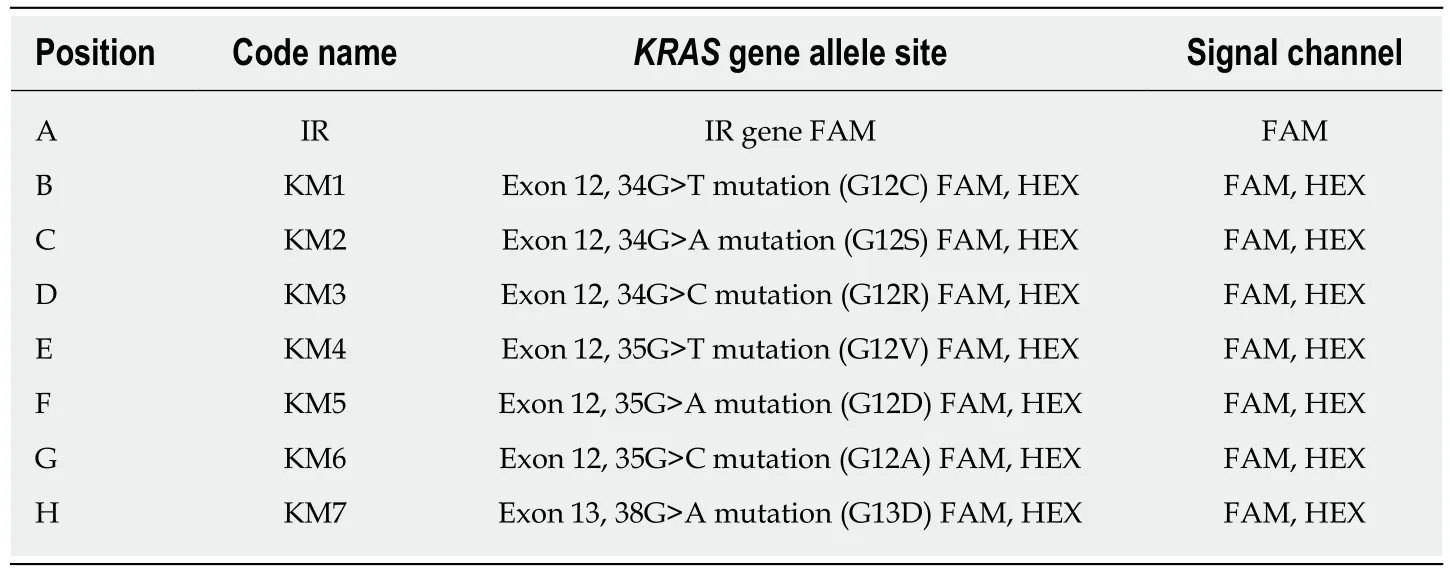
Table 2 Identification of KRAS mutations
Relationship between KRAS genotype and KRAS protein expression
IHC analysis indicated that KRAS protein was expressed in both the cytoplasm and cell membrane of CRC cells, but the majority was membrane localized. H-scores for KRAS protein IHC staining in the cell membrane were 133.4 ± 4.974 (n = 134) and 131.7 ± 5.091 (n = 134) for patients with mutant and wild-type KRAS, respectively,whereas the cytoplasmic scores were 59.76 ± 4.298 (n = 62) and 60.16 ± 3.354 (n = 133),respectively. These scores were not significantly different (Figures 3 and 4).
Relationship between KRAS genotype and downstream protein expression in CRC tissues
BRAF, MEK, and ERK proteins were expressed in 74.6%, 54.8%, and 45.2%,respectively, of KRAS mutant CRC tissues and in 74.2%, 58.2%, and 54.1%,respectively, of KRAS wild-type tissues. These differences were not statistically significant (Table 5).
The H-scores for BRAF, MEK, and ERK protein IHC staining were 64.07 ± 4.898,36.50 ± 2.770, and 16.09 ± 2.318, respectively, in KRAS mutant CRC tissues,respectively (n = 134), and 55.25 ± 2.915, 33.74 ± 4.113, and 14.36 ± 3.379, respectively,in KRAS wild-type tissues (n = 62). These differences were not statistically significant(Figures 5-7).
Relationship between the expression of KRAS and downstream proteins in CRC tissues
BRAF, MEK, and ERK protein expression was positive in 76.4%, 78.6%, and 69.6%,respectively, of KRAS protein-positive CRC tissues and in 69.6%, 8.6%, and 39.3%,respectively, of KRAS protein-negative tissues. MEK and ERK expression was significantly more common in KRAS-positive tissues than in KRAS-negative tissues (P< 0.05; Table 6).
Relationship between the expression of BRAF, MEK, and ERK in CRC tissues
MEK and ERK proteins were expressed in 67.5% and 52.7%, respectively, of BRAF-positive tissues and in 46.0% and 60.0%, respectively, of BRAF-negative tissues. These differences were not significant (Table 7). ERK was expressed in 57.9% (73/126) of MEK-positive tissues and 38.6% (27/70) of MEK-negative tissues, with a significant difference (P < 0.05).
Relationship between KRAS, BRAF, MEK, and ERK protein expression and prognosis for patients with stage II/III CRC
The 4-year PFS rates for stage II/III CRC patients with positive vs negative protein expression were 77.78% vs 90.29% (P = 0.0411) for KRAS, 83.33% vs 87.5% (P = 0.4395)for BRAF, 85% vs 87.50% (P = 0.6768) for MEK, and 85.71% vs 87.32% (P = 0.7657) for ERK. The 4-year OS rates for the same groups were 89.32% vs 93.33% (P = 0.4555) for KRAS, 86.11% vs 89.26% (P = 0.3109) for BRAF, 89.77% vs 91.67% (P = 0.6768) for MEK, and 88.31% vs 92.96% (P = 0.3380) for ERK. Only the 4-year PFS rates of the KRAS protein-positive and -negative groups were significantly different (P = 0.0411;Figure 8).
Multivariate analysis of the prognostic significance of KRAS, BRAF, MEK, and ERK expression in stage II/III CRC patients
Multivariate analysis showed that only positive KRAS protein expression was a risk factor for disease recurrence in patients with stage II/III CRC. The risk was 3.319-fold higher for KRAS-positive than KRAS-negative patients (95% confidence interval:1.231-8.944; Tables 8 and 9).

Figure 2 Expression of RAS pathway proteins in colorectal cancer. A-D: KRAS negative (A and B) and positive (C and D) expression at magnification × 40 (A and C) and × 100 (B and D). E-P: As described for (A-D), except that staining for BRAF protein (E-H), MEK protein (I-L), and ERK protein (M-P) is shown.
DISCUSSION
The epidermal growth factor receptor (EGFR) is a transmembrane tyrosine kinase receptor that activates downstream effector proteins via the RAS/RAF/MEK/ERK pathway. Previous work found that the KRAS gene mutation status correlated with the clinical efficacy of anti-EGFR antibody therapies[22-24], and that only wild-type KRAS tumors benefited from such therapy.
The KRAS gene, which is located on chromosome 12, is composed of four coding exons and one 5′ non-coding exon and produces a 21 kDa protein composed of 189 amino acids. Members of the RAS superfamily, including KRAS, have similar molecular structures and bind guanine nucleotides. RAS continuously cycles through active (GTP bound) and inactive (GDP bound) conformational states. The binary behavior of these proteins allows them to act as molecular switches in signaling processes. In this manner, the mutant KRAS gene results in a constitutively active GTP-bound state and the activation of downstream pro-proliferative signaling pathways[25,26]. The most common oncogenic mutations in CRCs are point mutations at positions 12, 13, and 61 of KRAS, with approximately 90% being in codons 12 and 13[22-27]. These amino acid mutations impair GTPase hydrolase activity and maintain the protein in an activated state, which results in continuous signaling to downstream effectors, even in the absence of extracellular stimulation. In our study, we detected a KRAS mutation rate of 30.9%, which is consistent with previous reports of 30%-40% in China[28]and was lower than those (30%-50%) observed in other countries[27,29-31].
To date, few studies have examined the relationship between KRAS genotype and protein expression. We found that KRAS protein was expressed in 55.8% of KRAS mutant tissues and in 44.2% of KRAS wild-type tissues, and the difference was not significant. The KRAS protein level, as measured using the semi-quantitative H-score,was also not significantly different between patients with mutant or wild-type KRAS tumors. Thus, there appears to be no obvious relationship between the KRAS mutation status and the expression level of KRAS protein. In addition to binding to GTP, RAS proteins must associate with cellular membranes in order to transduce signals[32-34]. We also found that the KRAS genotype had no effect on the distribution of KRAS protein between the cell membrane and cytoplasm. These data suggest that activation of KRAS or its downstream pathway components is unrelated to the expression level or subcellular location of KRAS protein.
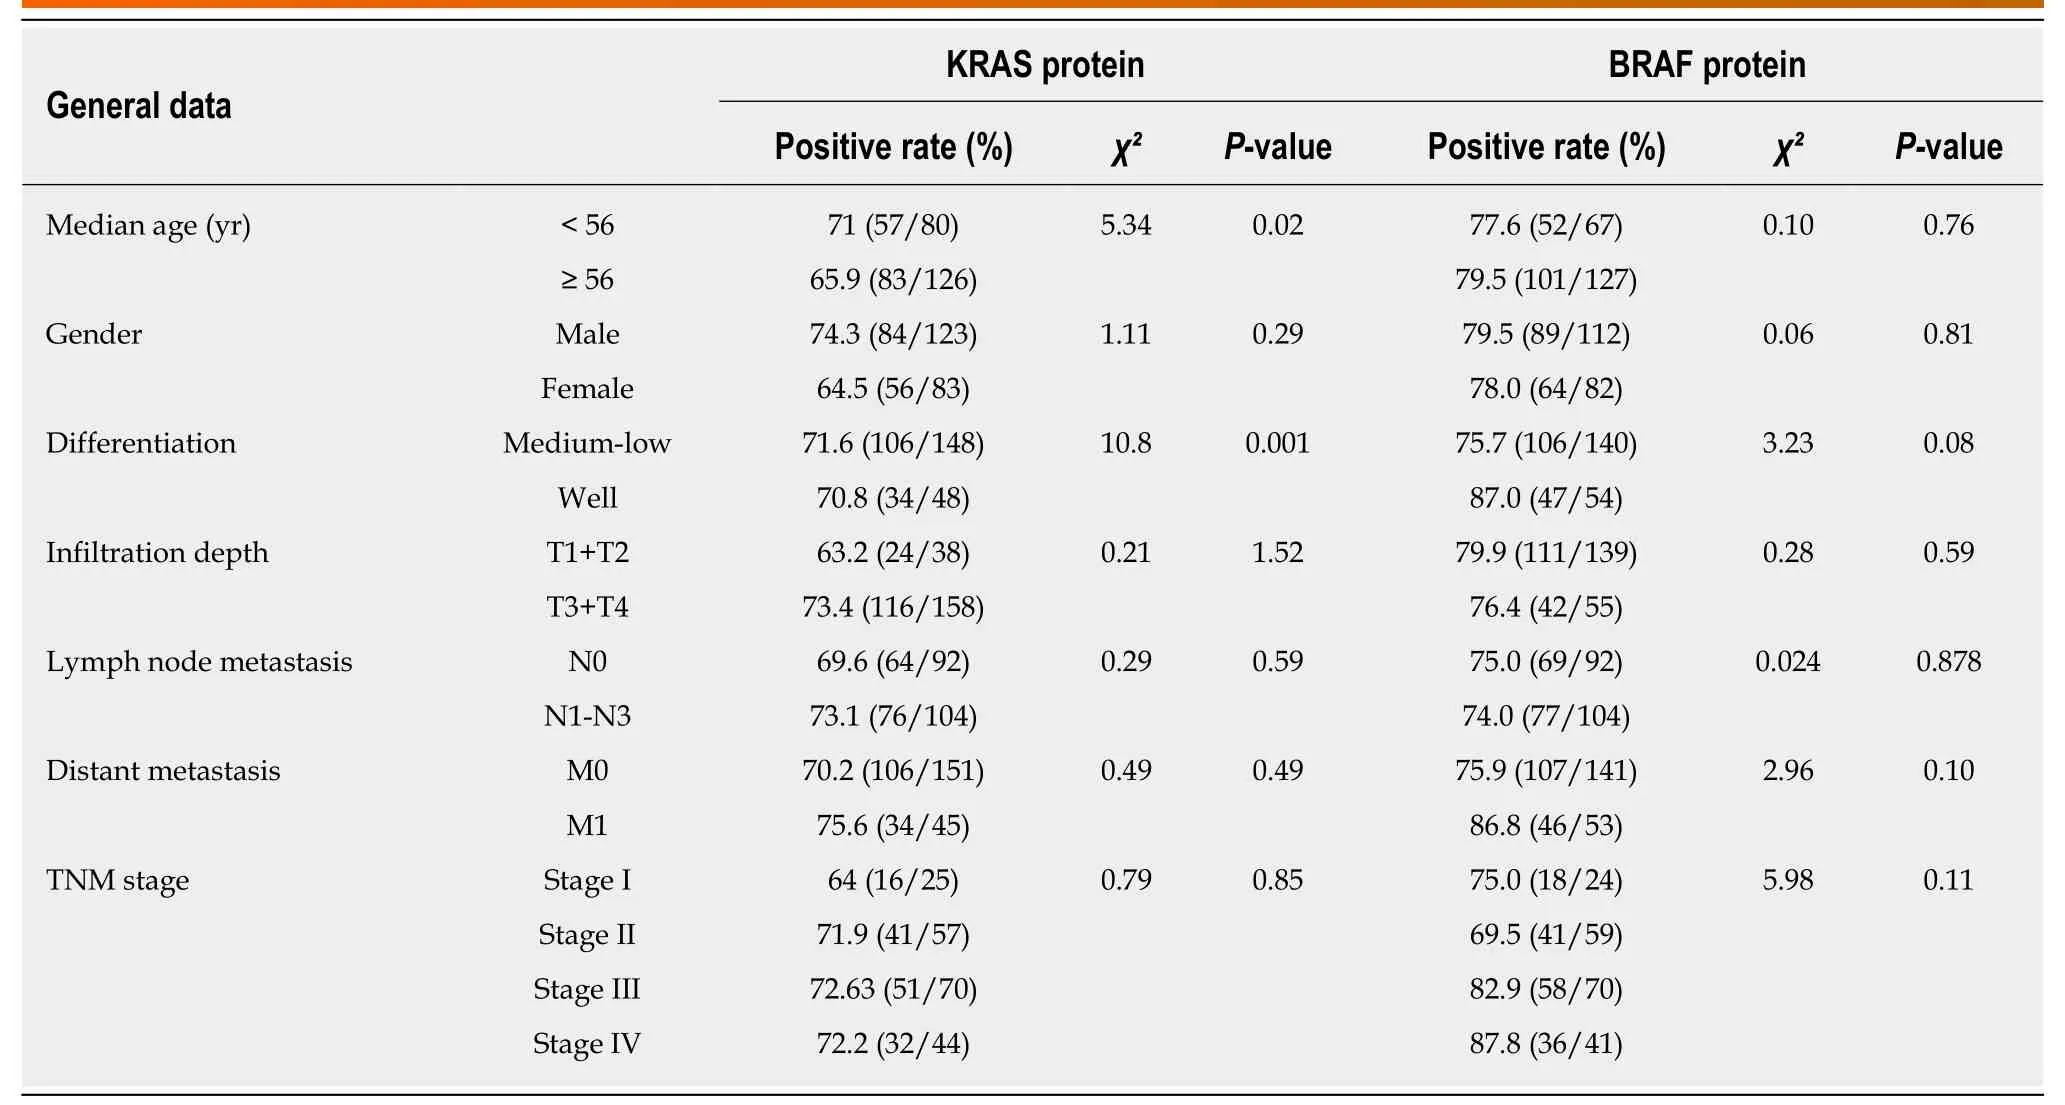
Table 3 Relationship between KRAS and BRAF protein expression and clinicopathological features of colorectal cancer patients
Unfortunately, KRAS gene mutations account for approximately 35% of the nonresponsive patients who receive anti-EGFR treatment[35]. Therefore, using the KRAS gene as a predictor of clinical outcome is not always useful. We also examined the frequency and level of BRAF, MEK, and ERK expression in tissues expressing mutant or wild-type KRAS. We detected no effects of the KRAS genotype on the expression of any of these proteins. However, MEK and ERK expression was significantly more common in KRAS protein-positive tumors than in KRAS-negative tumors. Similarly, ERK expression was significantly more common in the MEK-positive than in the MEK-negative group of tumors. Thus, increased expression of an upstream protein can elevate the expression of a downstream protein in the same signaling pathway. ERK is the sole substrate of MEK in the RAS/RAF/MEK/ERK signaling pathway and their expression levels are often similar[36].
BRAF protein is mainly activated via two mechanisms: upstream RAS signaling or mutation of BRAF. The BRAF gene mutation status is also correlated with the clinical efficacy of anti-EGFR antibody therapies[37]. BRAF protein is phosphorylated and activated, and BRAF in turn phosphorylates MEK1/MEK2, which activates ERK and promotes its entry into the nucleus to regulate gene expression. The BRAF gene is also mutated in many cancers[38]. Kadowaki et al[39]found a 4%-10% BRAF mutation rate in CRC patients, whereas the mutation rate can be as high as 90% in sigmatic serrated adenoma[40]. Little is known about BRAF protein expression in CRC tissue. We found that 78.8% of our CRC tumor specimens were positive for BRAF protein, but the frequency and level were not significantly different in samples from KRAS mutant and wild-type tissues. It is possible that the BRAF protein expression is high in both adenoma and carcinoma tissues.
Tumor stage, the most important factor affecting prognosis, is mainly based on the depth of tumor invasion, lymph node metastasis, and distant metastasis. The prognostic significance of KRAS, BRAF, MEK, and ERK protein expression in CRC tissues has not been investigated. In this study, we analyzed the 4-year PFS and OS rates according to KRAS, BRAF, MEK, and ERK positive or negative expression in patients with stage II/III cancer. Multivariate analysis showed that only KRAS protein expression was a risk factor for recurrence, suggesting that it could be used as a predictive marker for prognosis in CRC.
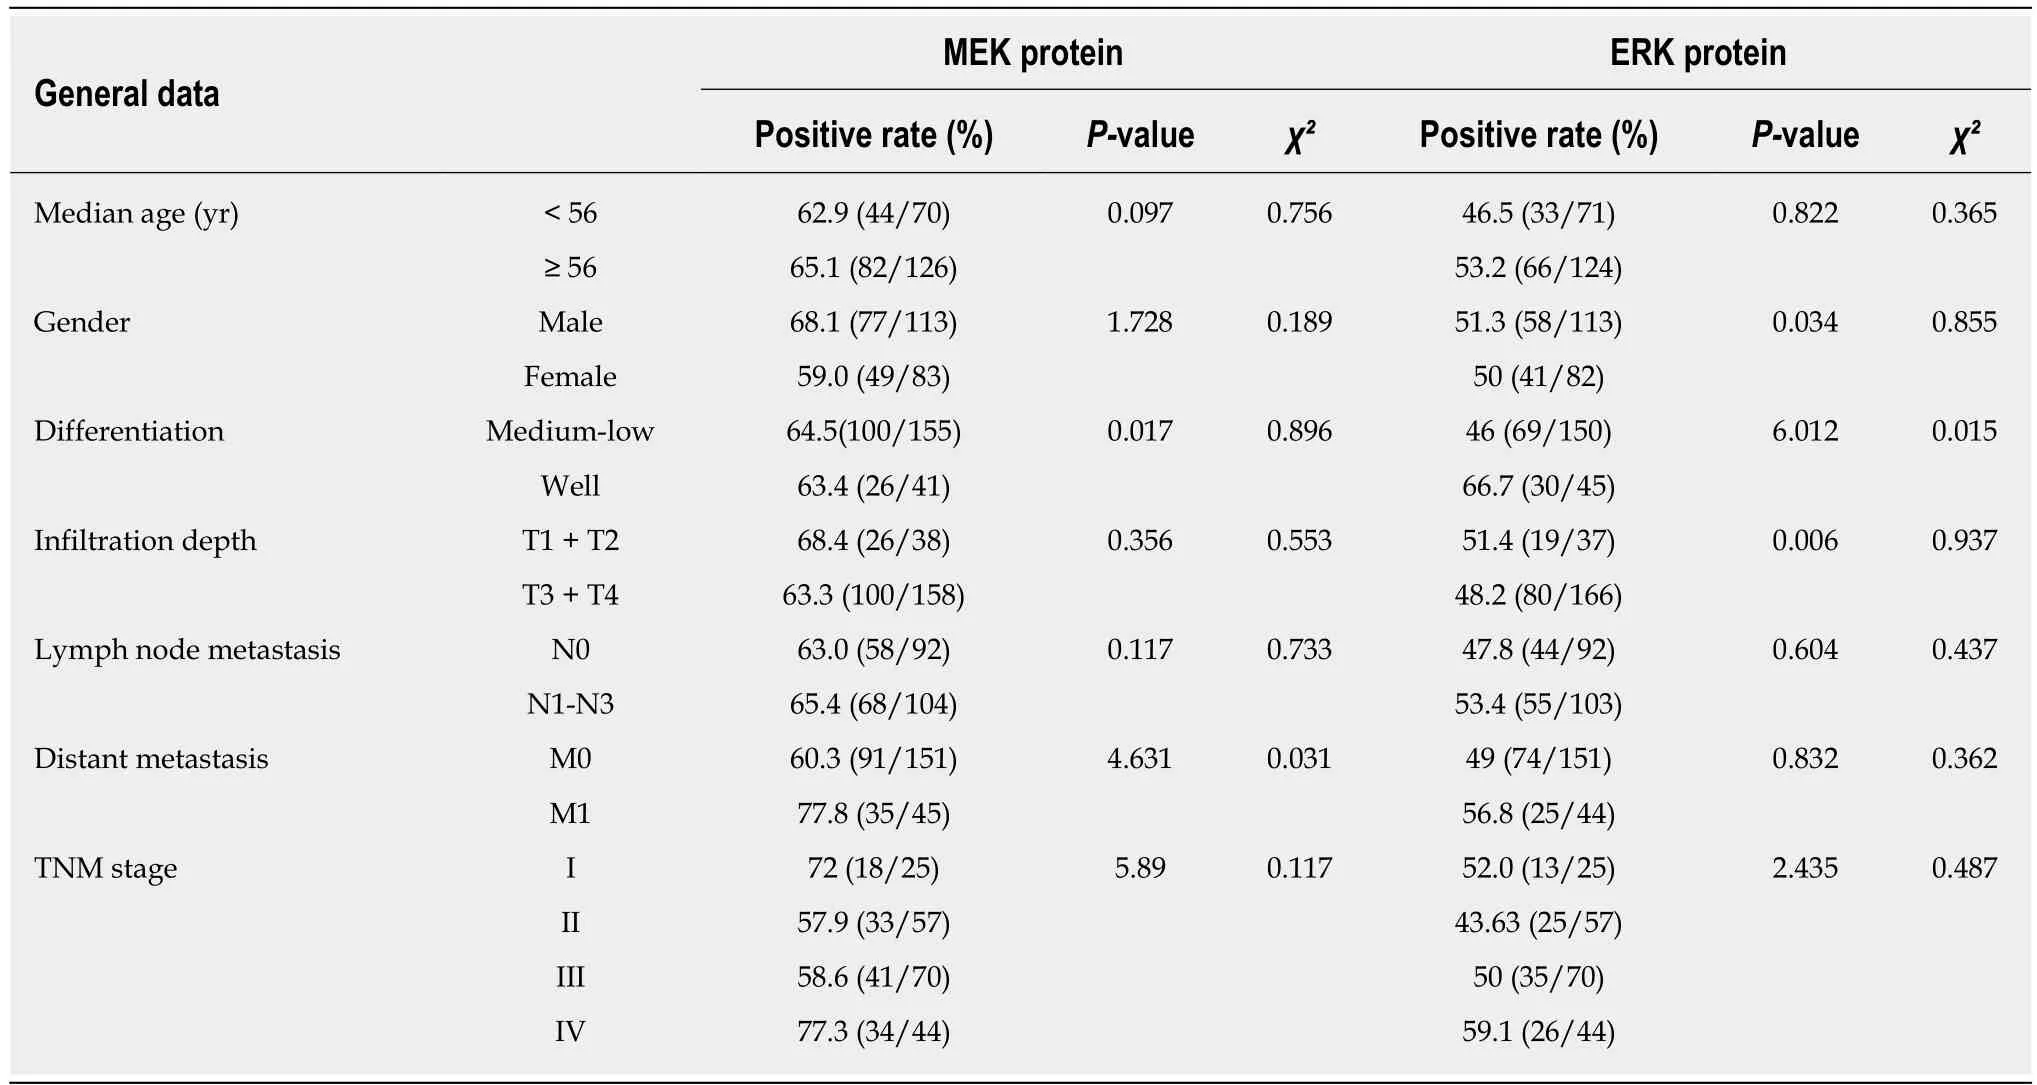
Table 4 Relationship between MEK and ERK protein expression and clinicopathological features of colorectal cancer patients
In summary, our data suggest that only using the KRAS gene as a predictor of clinical outcome is not enough, and combined detection of intracellular signal transduction pathways may advance our understanding of the development and treatment of tumors, including CRC.

Table 5 Relationship between KRAS genotype and expression of downstream proteins in colorectal cancer tissues

Table 6 Correlation between the expression of KRAS and downstream proteins

Table 7 Correlation between expression of BRAF and downstream proteins
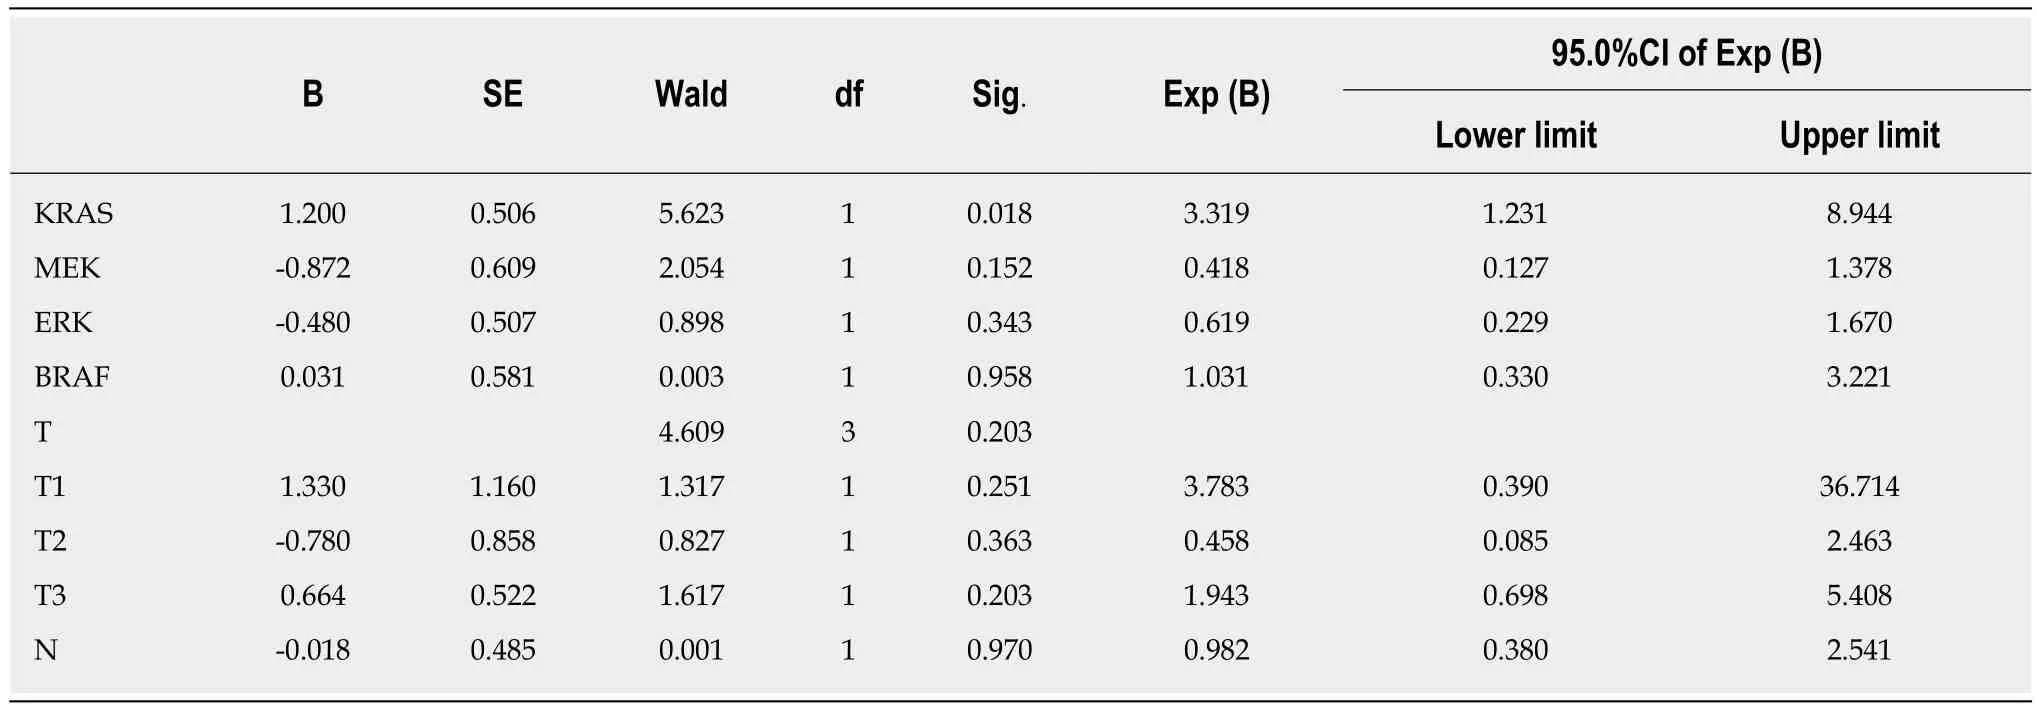
Table 8 Relationship between progression-free survival and KRAS, BRAF, MEK, and ERK protein expression
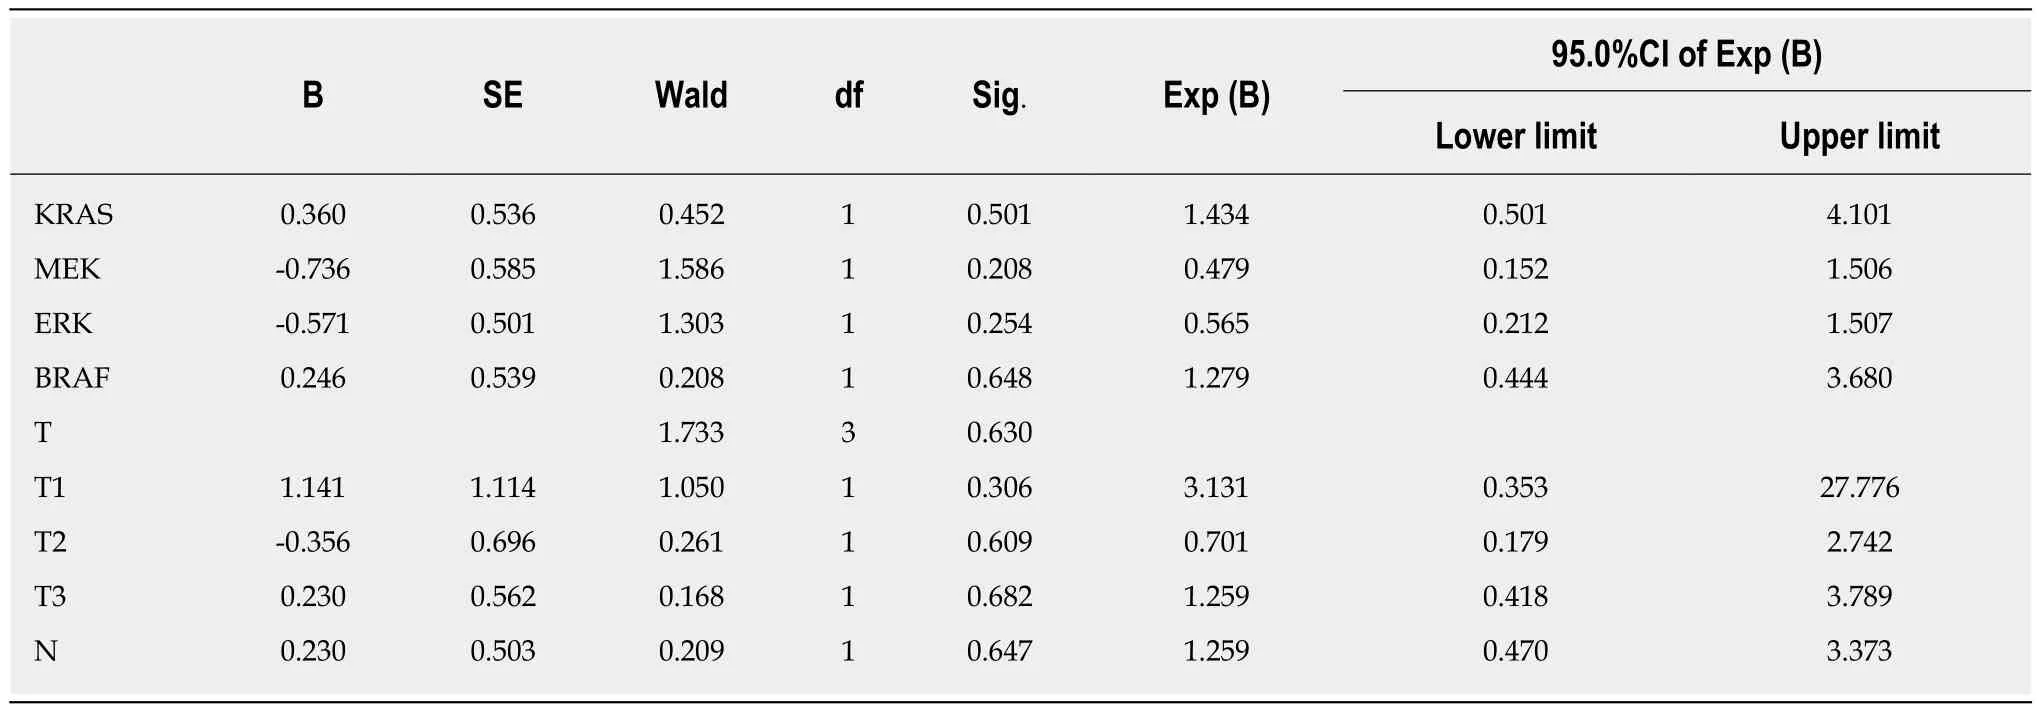
Table 9 Relationship between overall survival and KRAS, BRAF, MEK, and ERK protein expression
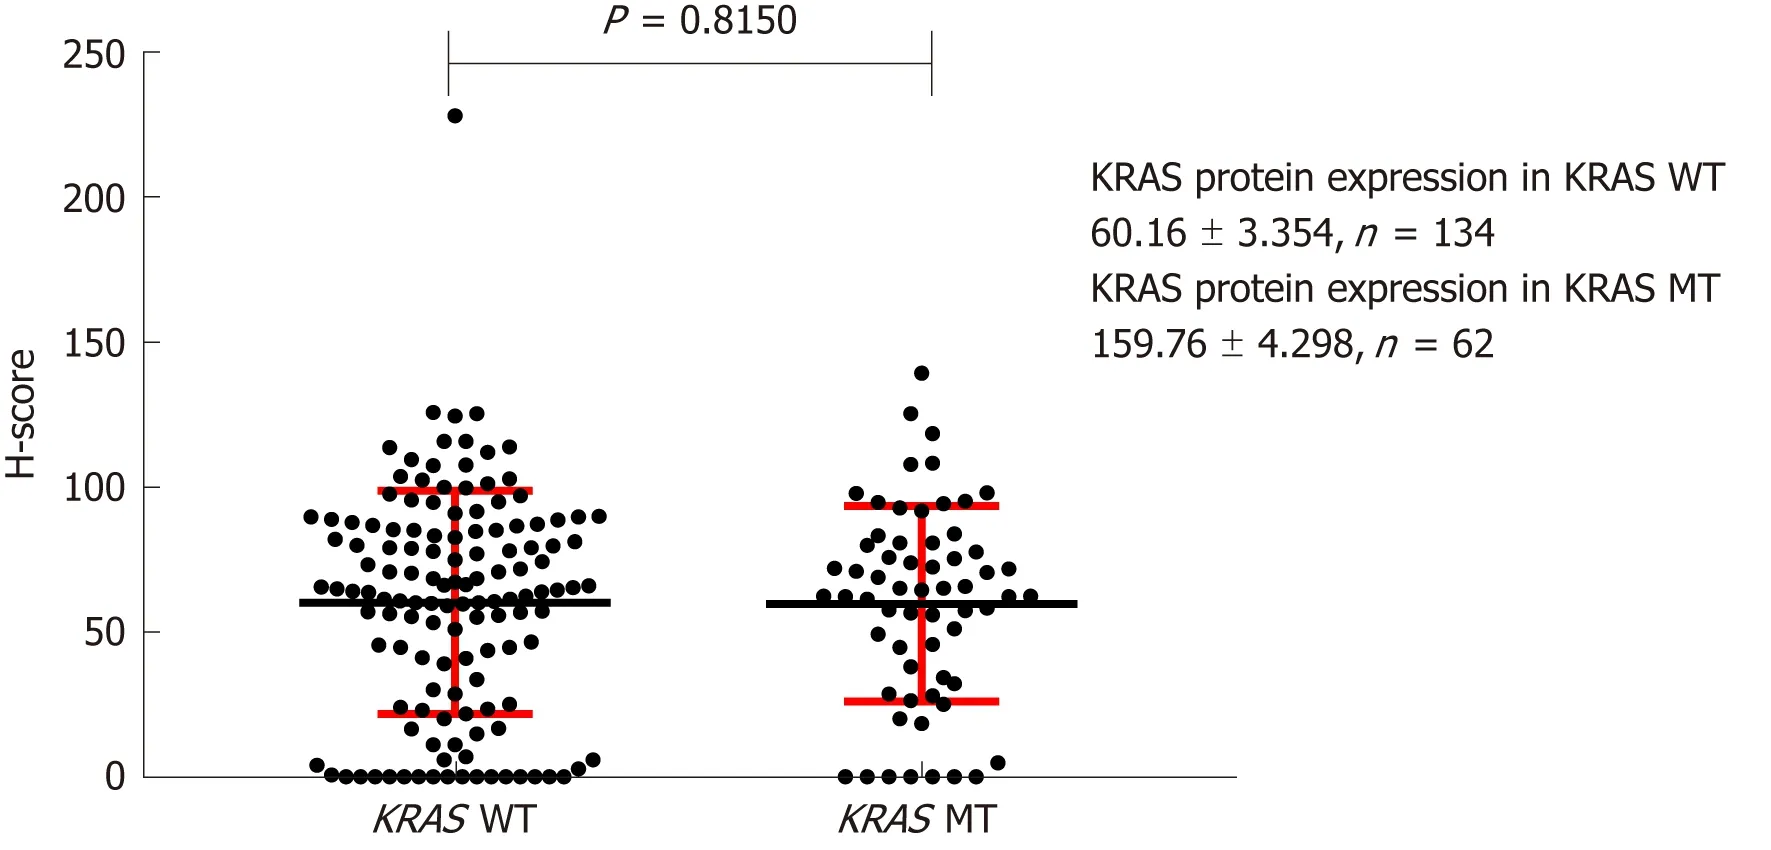
Figure 3 Effect of KRAS gene status on expression of KRAS protein on the cell membrane. H-score: Histochemistry score.
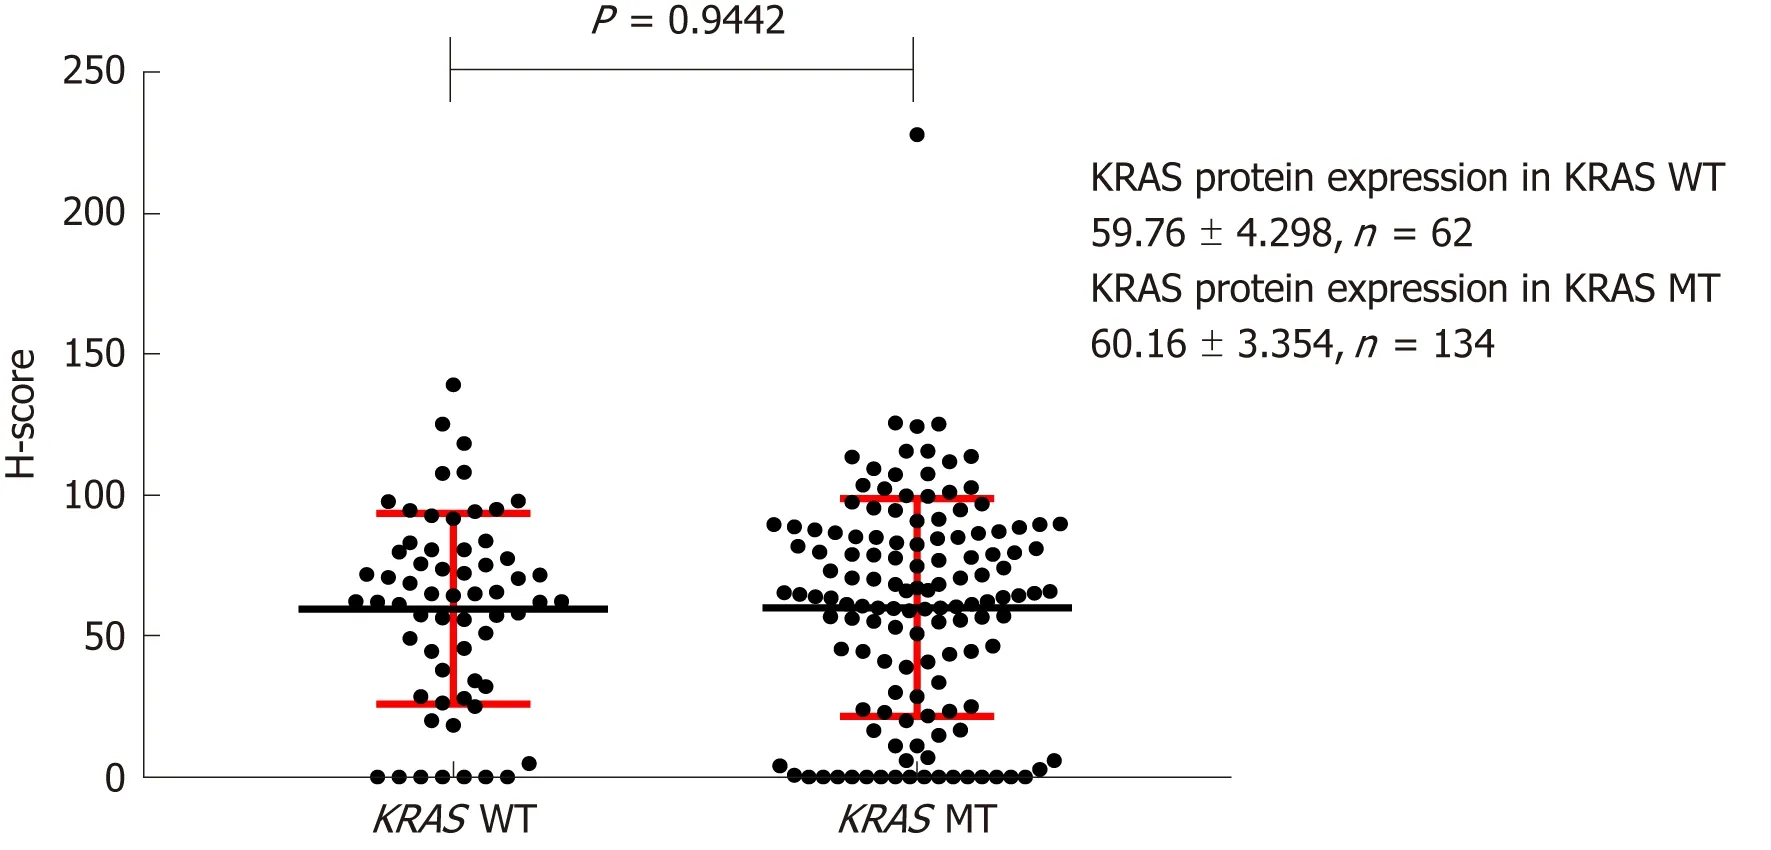
Figure 4 Effect of KRAS gene status on expression of KRAS protein in the cytoplasm. H-score: Histochemistry score.
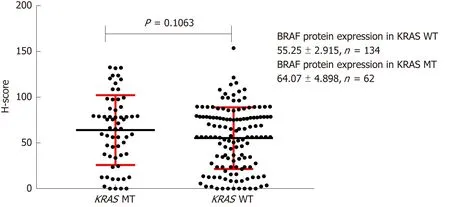
Figure 5 Effect of KRAS gene status on BRAF protein expression. H-score: Histochemistry score.
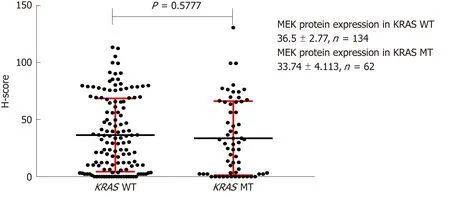
Figure 6 Effect of KRAS gene status on MEK protein expression. H-score: Histochemistry score.
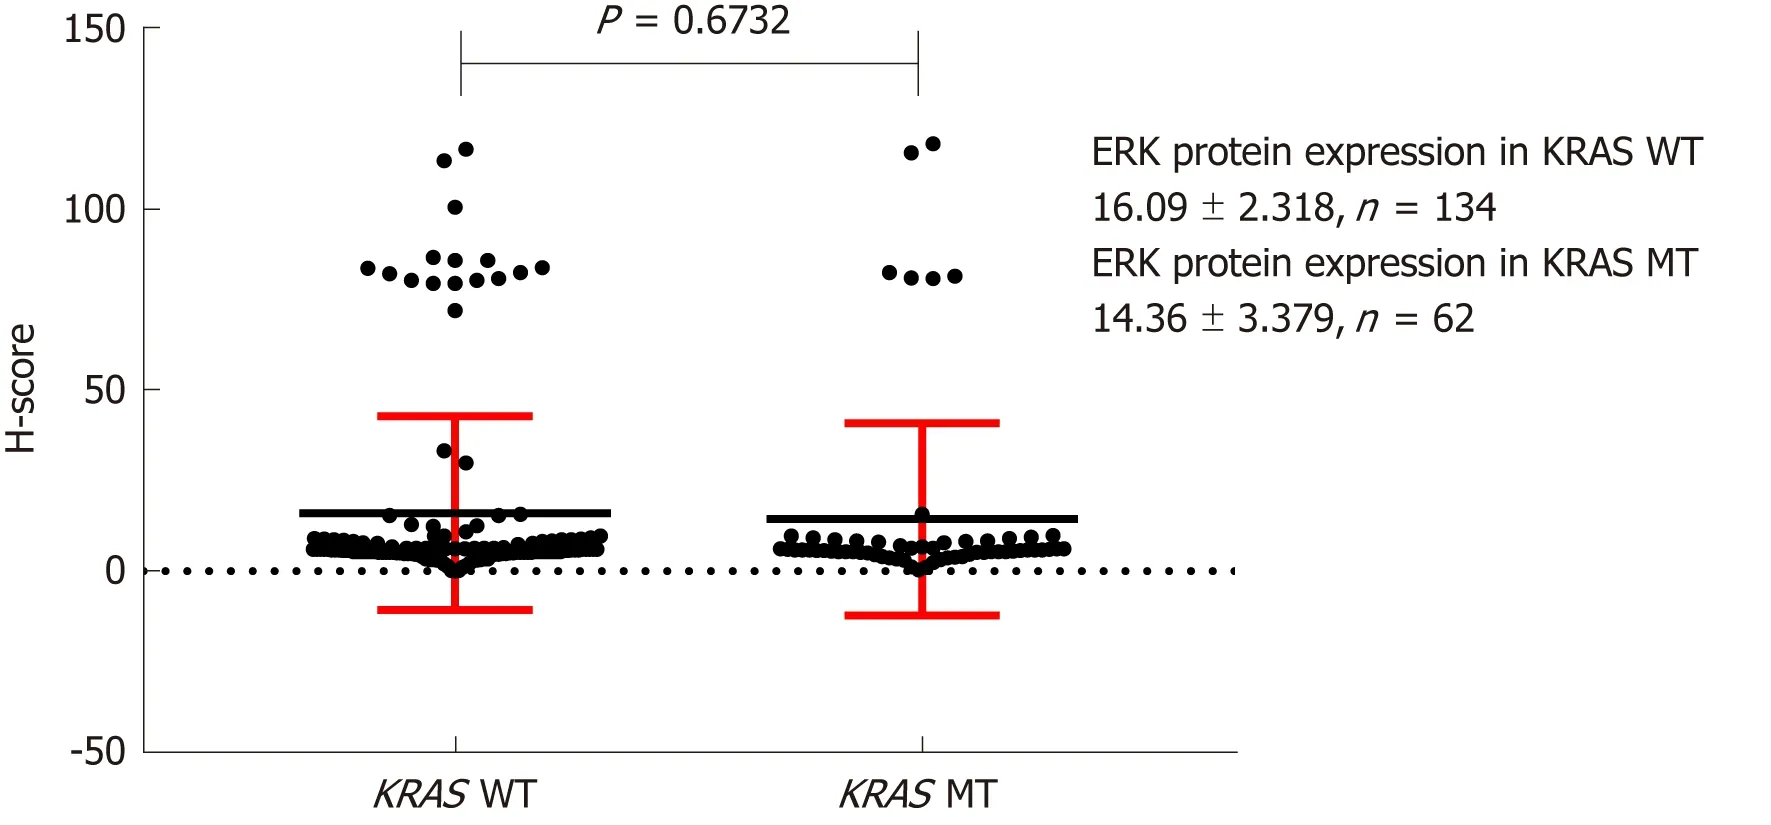
Figure 7 Effect of KRAS gene status on ERK protein expression. H-score: Histochemistry score.
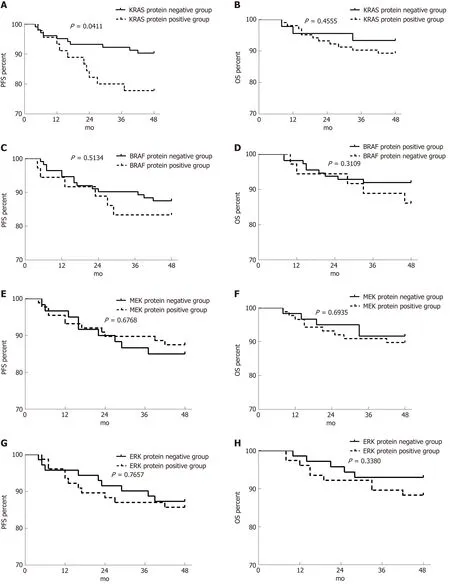
Figure 8 Effect of RAS pathway protein expression on progression-free survival and overall survival in patients with stage II/III colorectal cancer. A-H:Effects of KRAS (A and B), BRAF (C and D), MEK (E and F), and ERK (G and H) protein expression on progression-free survival (A, C, E, and G) and overall survival(B, D, F, and H). PFS: Progression-free survival; OS: Overall survival.
ARTICLE HIGHLIGHTS
Research background
The RAS signaling pathway plays a crucial role in the invasiveness and metastasis of tumor cells.Mutations in any one of the upstream genes (such as the RAS gene) may be transmitted to the protein through transcription or translation, resulting in abnormal activation of the signaling pathway. Patients with KRAS gene mutation have a poor prognosis. This study investigated the effect of KRAS mutations on its associated proteins in colorectal cancer. It is helpful to understand the cause of tumor progression and drug resistance caused by mutation of the KRAS gene.
Research motivation
By analyzing the effect of upstream gene mutation on the downstream protein expression of signal pathway, it is helpful to further understand the cause of drug resistance. Future studies should focus on the active forms and structures of signal molecules, and find out which forms and conformational proteins are active, which is conducive to the synthesis of corresponding targeted drugs.
Research objectives
The main goal was to find out which forms and conformational proteins are active. At present, it is found that the amount of protein is not the main factor affecting the activity. Achieving these goals can help to develop targeted therapies.
Research methods
In this study, the mutation of the KRAS gene was analyzed by real-time quantitative polymerase chain reaction, protein expression was analyzed by immunohistochemistry, and the impact of gene mutation on protein expression, the effect of gene and protein on prognosis, and the relationship between protein expression and clinicopathology were analyzed.
Research results
KRAS gene status had no significant effect on RAS pathway signaling molecules in colorectal cancer. Positive expression of KRAS and ERK was associated with poor tumor differentiation.MEK expression was associated with more distant metastasis. The 4-year progression-free survival rate was significantly higher in patients with KRAS-negative tumors than in those with KRAS-positive tumors. Multivariate analysis showed that only the expression of KRAS protein was a risk factor for tumor recurrence. These results are consistent with observations in clinical practice, indicating the credibility of the study. The specific reasons for the genetic and protein effects of these results need to be further clarified.
Research conclusions
In this study, the relationship between the KRAS gene and the RAS signaling pathway molecule was discussed. It was found that the gene-to-protein to functional change was a complex process, and the gene mutation did not cause an increase in the positive rate of downstream protein expression. KRAS protein was found to be involved in tumor differentiation and prognosis. The study also found that the farther apart the molecules in the signal pathway, the smaller the effect, suggesting that the signaling pathways are intertwined. The combination of targeted drugs and multi-channel blockade is better than single-channel blockade.
Research perspectives
The study began without considering the phosphorylation of the signal molecule and the effect of structure on function. Future research is best to study the effect of phosphorylation and spatial structure changes of a certain signal molecule on function. Using atomic force microscopy and mass spectrometry and cryo-electron microscopy equipment and electron microscopy negative staining preparation methods to observe the spatial structure of individual lipoprotein molecules can find which conformational proteins are active.
杂志排行
World Journal of Gastroenterology的其它文章
- Consensus on the digestive endoscopic tunnel technique
- Solutions for submucosal injection: What to choose and how to do it
- Targeted and immune therapies for hepatocellular carcinoma:Predictions for 2019 and beyond
- Ubiquitin-specific protease 22 enhances intestinal cell proliferation and tissue regeneration after intestinal ischemia reperfusion injury
- Nutrient drink test: A promising new tool for irritable bowel syndrome diagnosis
- Aspiration therapy for acute embolic occlusion of the superior mesenteric artery
