Safety Assessment and Distribution Characteristics of Heavy Metal Pollutants in Livestock and Poultry Meat from Different Regions of China
2019-02-18,,,,,*
, , , , , *
1. Guizhou Academy of Testing and Analysis, Guiyang 550002, China; 2. Guizhou Food Safety Testing Application Engineering Technology Research Center Co., Ltd., Guiyang 550002, China; 3. Food Safety and Nutrition (Guizhou) Information Technology Co., Ltd., Guiyang 550008, China
Abstract [Objective] To analyze and compare the heavy metal inspection results of different livestock and poultry meat from different farms, wholesale markets, farmers’ markets and supermarkets in different areas of China, in order to evaluate the health risks of livestock and poultry meat. [Method] A total of 10 500 samples of 5 kinds of livestock and poultry meat were collected in North China, Northeast China, East China, Central China, South China, Southwest China and Northwest China during 2015-2017. The samples were analyzed and evaluated with the method of index of food safety (IFS). [Result] the average over-standard rates of Pb, Cd, Cr, Hg and As in samples were 1.10%-2.48%, 0.67%-2.48%, 1.00%-2.57%, 0.81%-1.43% and 0.43%-1.00%, respectively, and the index of food safety was less than 1. The pollution levels of Pb, Cd, Cr, Hg and As in livestock and poultry meat in Southwest China were higher than those in other areas, while the pollution of As in Northeast China was severer than that in other areas. The order of IFS values of different heavy metals in different livestock and poultry meat was the same. [Conclusion] The index of food safety showed that the risk of heavy metal pollution in livestock and poultry meat did not exceed the acceptable limit.
Key words Livestock and poultry meat, Assessment method of index of food safety, Heavy metal, Food safety evaluation
1 Introduction
Livestock and poultry meat is indispensable in human food composition, and they can provide energy, fat, protein, vitamins, minerals and other nutrients to the human body[1]. According toChinaStatisticalYearbook2016, as of 2015, China’s output of pork, beef and mutton had reached 86.25 million t, the per capita consumption of frequently-consumed meat (pork, beef and mutton) had reached 26.2 kg, and the poultry consumption had reached 8.4 kg[2]. Heavy metals in livestock and poultry meat have become the focus in the quality and safety evaluation of livestock and poultry meat in China[3-4].
Heavy metals are toxic and harmful, transmitted through food chain or food production and processing[5]. They are mainly originated from environmental pollution caused by high-speed industrial development, industrial waste, waste residue, waste water, etc. Water pollution, soil pollution and air pollution attribute to excessive heavy metals in fodder and drinking water, which deposit in animals and enter human body through dietary intake, and will cause chronic damage to human body[6]. Long-term intake of such livestock and poultry meat will cause excess heavy metals in human body. Heavy metals have lasting effect on human body. They will not erupt in a short period of time, and their early clinical manifestations are not obvious, so they generally fail to attract enough attention before poisoning. Once the disease onsets, the consequence will be devastating[5], and will cause chronic potential chemical damage to the body[7-10]. More likely, mutational, carcinogenic, and teratogenic possibilities will be raised[11].
Therefore, it is necessary to evaluate the level of heavy metal pollution in livestock and poultry meat. In recent years, some scholars have proposed that food safety index can be used to quantitatively evaluate the impact of food contamination or harm on consumer health[12-14], and index of food safety (IFS) formula has been used to reflect food safety[15]. Since toxic effects of heavy metal pollutants are related to the specific intake amount into human body, it is more reasonable and scientific to use the ratio of actual intake amount to safe intake amount of a certain pollutant. In this study,IFSwas used to quantify the heavy metals in livestock and poultry meat samples from different regions, and to examine their distribution characteristics in different regions, thus laying a solid foundation for the control of heavy metal pollution in livestock and poultry meat.
2 Material and methods
2.1SamplesourceFive types of livestock and poultry meat (swine, cattle, mutton, chicken, duck) with highest per capita consumption in major farms, wholesale markets, farmers markets and supermarkets were examined, and their detection data were collected according to theNationalFoodSafetySupervisionandInspectionImplementationRules(2017 Edition)[16], inspecting North China (Beijing, Tianjin, Hebei Province, Shanxi Province, Inner Mongolia Autonomous Region), Northeast China (including Liaoning Province, Jilin Province, Heilongjiang Province), East China (including Shanghai, Jiangsu Province, Zhejiang Province, Anhui Province, Fujian Province, Jiangxi Province, Shandong Province), Central China (including Henan Province, Hubei Province, Hunan Province, Jiangxi Province), South China (including Guangdong Province, Guangxi Zhuang Autonomous Region, Hainan Province), Southwest China (including Sichuan Province, Guizhou Province, Yunnan Province, Chongqing Municipality, Tibet Autonomous Region) and Northwest China (including Shaanxi Province, Gansu Province, Qinghai Province, Ningxia Hui Autonomous Region, Xinjiang Uygur Autonomous Region)[17]. Besides farms, only local livestock and poultry meat was collected at other collection sites. A total of 10 500 samples were collected for casual inspection, self-test and inspection, while three above-mentioned regions produced 300 data for each species. Total five kinds of livestock and poultry meat (swine, cattle, mutton, chicken and duck) and seven parts of China were under inspection.
2.2EvaluatingmethodandstandardHeavy metal pollutants in human body are mainly derived from daily food, while Pb, Cd, Cr, Hg and As are common heavy metals in livestock and poultry meat[18]. In order to evaluate edible safety of heavy metal content in livestock and poultry meat in various regions of China, according to GB2762-2017 (NationalFoodSafetyStandard:FoodContaminantLimits), the contents of Pb, Cd, Cr, Hg and As in livestock and poultry meat were calculated. The limits of Pb, Cd, Cr, Hg and As are 0.2, 0.1, 1.0, 0.05 and 0.5 mg/kg, respectively[19]. The food safety index evaluation method was used to assess their health risks of eating. The average food safety index was calculated by formula (1).
(1)
wherenrepresents the total number of samples; andIFSCrepresents the safety index of heavy metal pollutantC, whose value was calculated by formula (2)[7].
IFSC=EDIC×f/(SIC×bw)
(2)
whereSICis safe intake amount of food, and the value of pollutant limit is used;bwis the average weight of Chinese residents, taking it as 60 (kg)[7];fis correction factor, making it 1[7]; andEDICis actual daily intake estimation for heavy metalC, calculated by formula (3)[7].
EDIC=∑(Ri×Fi)
(3)
whereRiis the residual level of heavy metalCin foodi, namely, the inspection result ofC, mg/kg; andFiis estimated daily consumption of foodi, g/(person·day), calculated as 160 g/(person·day)[20]. The calculation result tells the influence degree of hazardous substances on food safety.
WhenIFSCis much smaller than l, hazardous substanceChas no impact on the safety of livestock and poultry meat; whenIFSC≤ 1, the risk of hazardous substanceCon food safety is acceptable; and whenIFSC>1, hazardous substanceC’s impact on food safety exceeds acceptable limit. WhenIFSCis much less than 1, food safety status of subject consumer is very good; whenIFSC≤1, the food safety status of subject consumer is acceptable; and whenIFSC>1, the food safety status of subject consumer is unacceptable.
3 Result and analysis
3.1Resultsandanalysisofexcessiveheavymetalpollutantsindifferentlivestockandpoultrymeatfrom2015to2017As shown in Table 1, China’s over-standard rates of Pb, Cd, Cr, Hg and As in pork from 2015 to 2017 were 1.19%, 2.48%, 1.29%, 1.43% and 0.62%, respectively. Excessive Cd is found in pork samples, and the over-standard rate was 4 times that of As. The areas with highest over-standard rates of Pb, Cd, Cr, Hg and As were Southwest China, East China, Southwest China, Southwest China and Northeast China. Among them, Cd in pork in East China and Northwest China, Pb and Hg in pork in Southwest China were as high as 3% and more (including 3%). Southwest region had the highest over-standard rate of Hg in pork, reaching 3.67%, and the number of over-standard samples reached 11. No excessive Pb was found in North China area, and no As was found in East China.
As shown in Table 2, China’s over-standard rates of Pb, Cd, Cr, Hg and As in beef from 2015 to 2017 were 1.81%, 0.86%, 1.00%, 0.81% and 0.43%, respectively. Excessive Pb was found in beef samples, the total number of over-standard samples reached 38, and the over-standard rate was 4 times that of As. Among them, excessive Pb in beef was found in South China, and the over-standard rate exceeded 3% (including 3%). While As in beef had low over-standard rate, with the number of samples exceeding the standard less than 9. No As was found in beef in East China. The areas with the highest over-standard rates of Pb, Cd, Cr, Hg and As in beef in China were Southwest China, Southwest China, Southwest China, Southwest China and Northeast China.
As shown in Table 3, the over-standard rates of Pb, Cd, Cr, Hg and As in mutton were 1.48%, 0.67%, 2.24%, 0.86% and 0.62%, respectively. Excessive Cr was found in mutton, the total number of over-standard samples reached 47, and the over-standard rate was 3 times higher than those of Cd and As. Among them, excessive Cr in mutton was found in South China and Southwest China, and the over-standard rate exceeded 3% (including 3%). Over-standard rate of Cr in Southwest China was significant, reaching 3.33%. While Cd and As had low over-standard rates in mutton, and the total number of over-standard samples were less than 14. Besides, no excessive As was found in mutton in East China. Mutton with highest over-standard rates of Pb, Cd, Cr, Hg and As was distribute in southwest, southwest, southwest, southwest and northeast regions.
As shown in Table 4, the over-standard rates of Pb, Cd, Cr, Hg and As in chicken were 2.48%, 1.48%, 2.24%, 0.95% and 1.00%. The over-standard rates of Pb and Cr in chicken in China were 2 times higher than those of Hg and As. Among them, East China, South China and Southwest China had the highest over-standard rate of Pb in chicken, reaching 3.33%. The over-standard rate of Cr in chicken was relatively high in Central China, reaching 2.67%. Areas with the highest over-standard rates of Cd, Hg and As were southwest China, southwest China and Northeast China. East China and Northwest China had lower over-standard rate of As in chicken, while Central China had lower over-standard rate of Cd in chicken.
As can be seen from Table 5, the over-standard rates of Pb, Cd, Cr, Hg and As in duck were 1.10%, 1.10%, 2.57%, 1.10% and 0.86%. China had severely high over-standard rate of Cr in duck, up to 2.57%. Among them, Southwest China had significantly excessive (3.33%) Cr in duck. The over-standard rates of Pb, Cd, Hg and As in duck were relatively low, and no Pb exceeded safety standard in North China. Areas with the highest over-standard rates of Pb, Cd, Cr, Hg and As were Southwest China, Southwest China, Southwest China, Southwest China and Northeast China.
Comparing Table 1-Table 5, in China, beef and chicken had high over-standard rates of Pb, pork had high over-standard rate of Cd, while mutton and duck had excessive heavy metal of Cr. The livestock and poultry meat had the highest over-standard rate of Cr, with 196 samples with excessive Cr, and the overall over-standard rate reached 1.87%. The livestock and poultry meat had the lowest over-standard rate of As, with 74 samples with excessive As. The overall over-standard rate was only 0.7%, which was half lower than that of Cr. Among them, East China had lowest As over-standard rate in livestock and poultry meat, represented by no As in pork, beef and mutton.
Table1TestresultsofPb,Cd,Cr,HgandAsinporkinChinain2015-2017
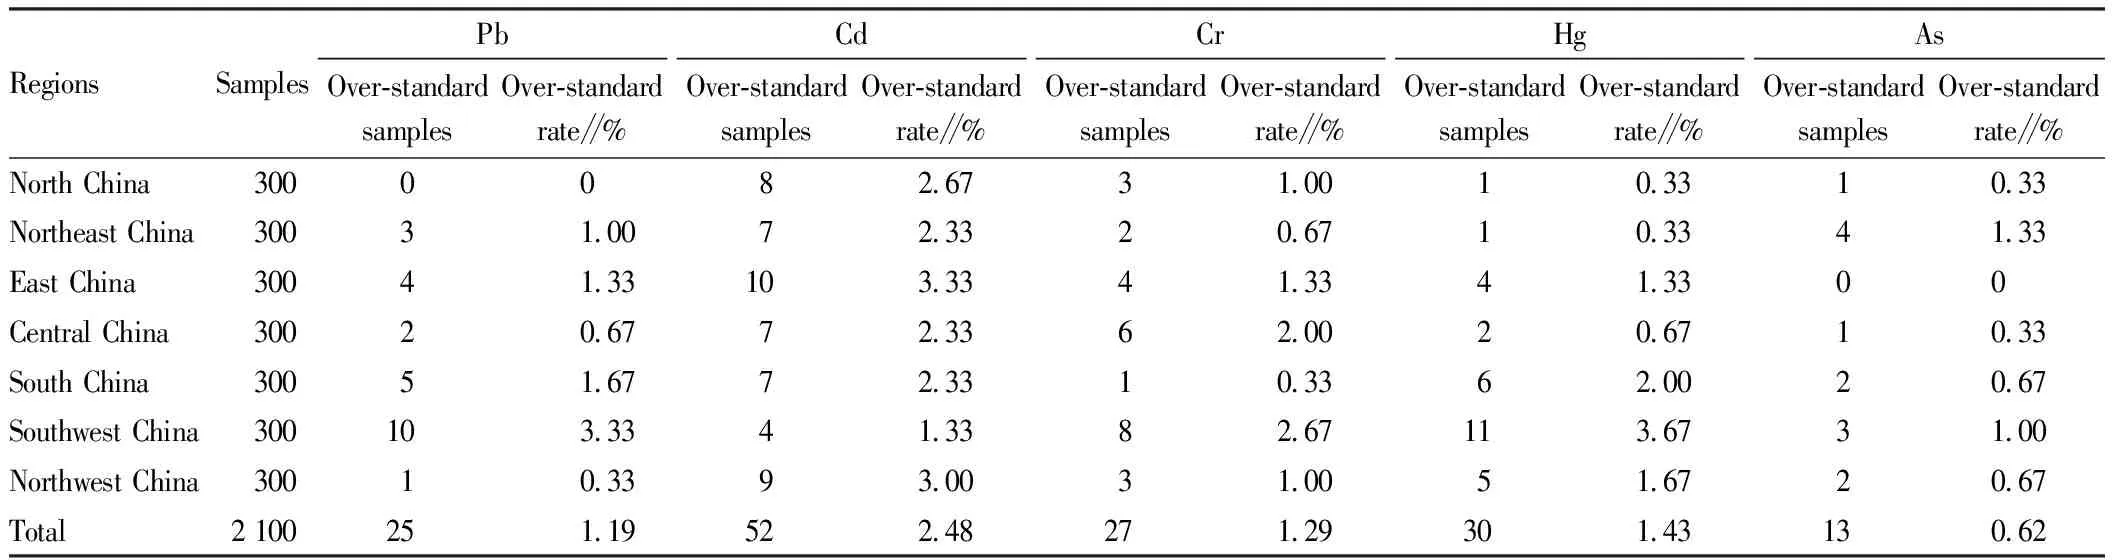
RegionsSamplesPbOver-standardsamplesOver-standardrate∥%CdOver-standardsamplesOver-standardrate∥%CrOver-standardsamplesOver-standardrate∥%HgOver-standardsamplesOver-standardrate∥%AsOver-standardsamplesOver-standardrate∥%North China3000082.6731.0010.3310.33Northeast China30031.0072.3320.6710.3341.33East China30041.33103.3341.3341.3300Central China30020.6772.3362.0020.6710.33South China30051.6772.3310.3362.0020.67Southwest China300103.3341.3382.67113.6731.00Northwest China30010.3393.0031.0051.6720.67Total2 100251.19522.48271.29301.43130.62
Table2TestresultsofPb,Cd,Cr,HgandAsinbeefinChinain2015-2017
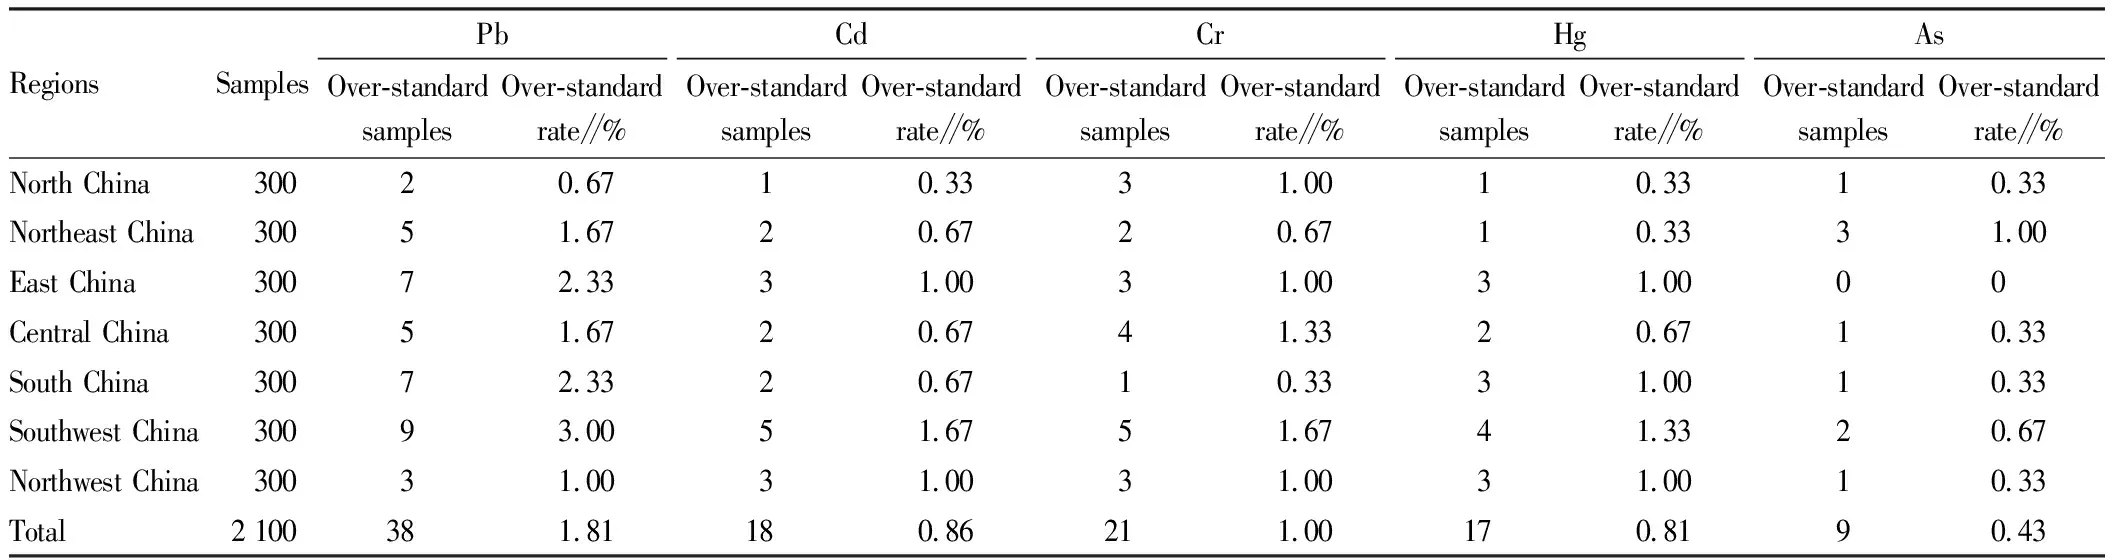
RegionsSamplesPbOver-standardsamplesOver-standardrate∥%CdOver-standardsamplesOver-standardrate∥%CrOver-standardsamplesOver-standardrate∥%HgOver-standardsamplesOver-standardrate∥%AsOver-standardsamplesOver-standardrate∥%North China30020.6710.3331.0010.3310.33Northeast China30051.6720.6720.6710.3331.00East China30072.3331.0031.0031.0000Central China30051.6720.6741.3320.6710.33South China30072.3320.6710.3331.0010.33Southwest China30093.0051.6751.6741.3320.67Northwest China30031.0031.0031.0031.0010.33Total2 100381.81180.86211.00170.8190.43
Table3TestresultsofPb,Cd,Cr,HgandAsinmuttoninChinain2015-2017
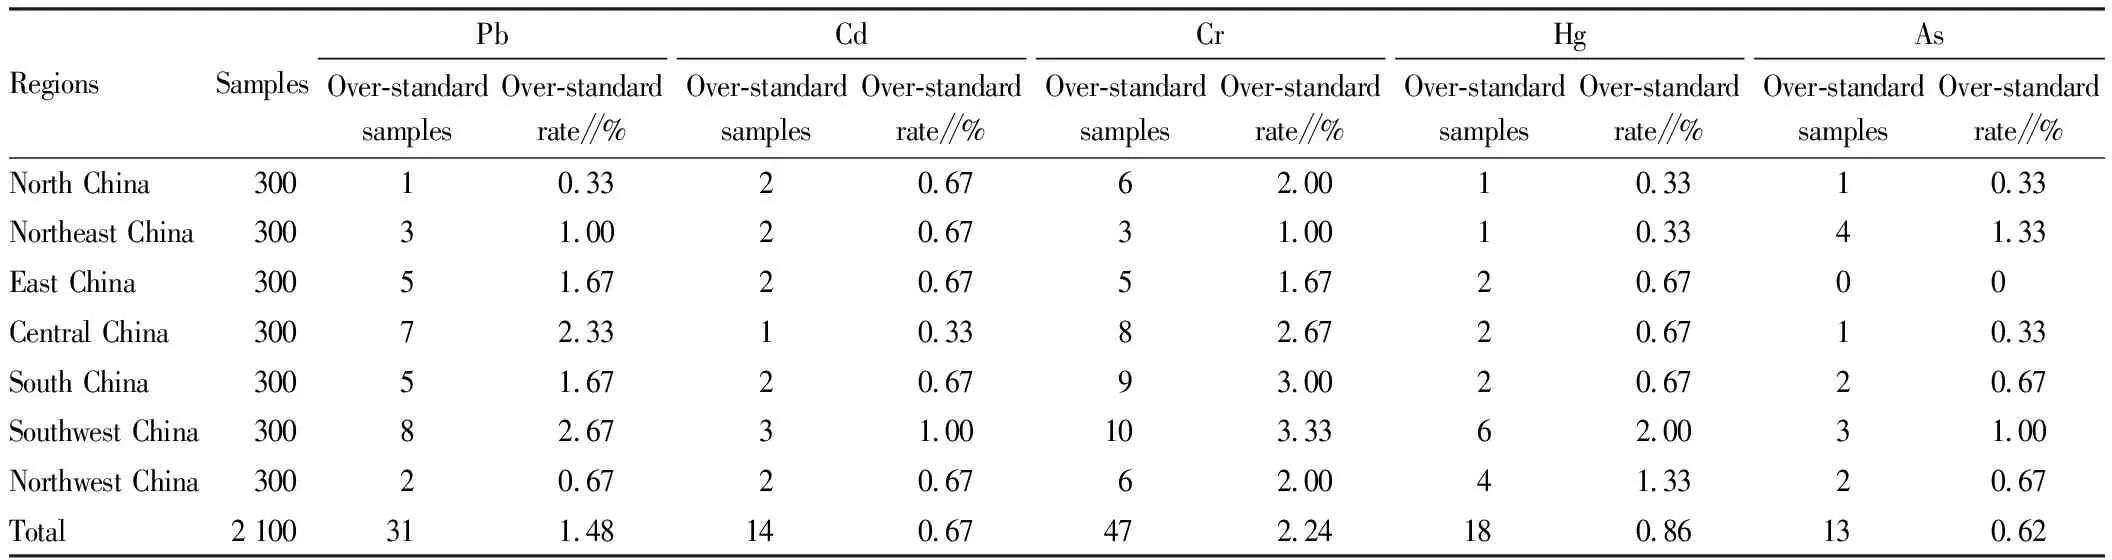
RegionsSamplesPbOver-standardsamplesOver-standardrate∥%CdOver-standardsamplesOver-standardrate∥%CrOver-standardsamplesOver-standardrate∥%HgOver-standardsamplesOver-standardrate∥%AsOver-standardsamplesOver-standardrate∥%North China30010.3320.6762.0010.3310.33Northeast China30031.0020.6731.0010.3341.33East China30051.6720.6751.6720.6700Central China30072.3310.3382.6720.6710.33South China30051.6720.6793.0020.6720.67Southwest China30082.6731.00103.3362.0031.00Northwest China30020.6720.6762.0041.3320.67Total2 100311.48140.67472.24180.86130.62
Table4TestresultsofPb,Cd,Cr,HgandAsinchickeninChinain2015-2017
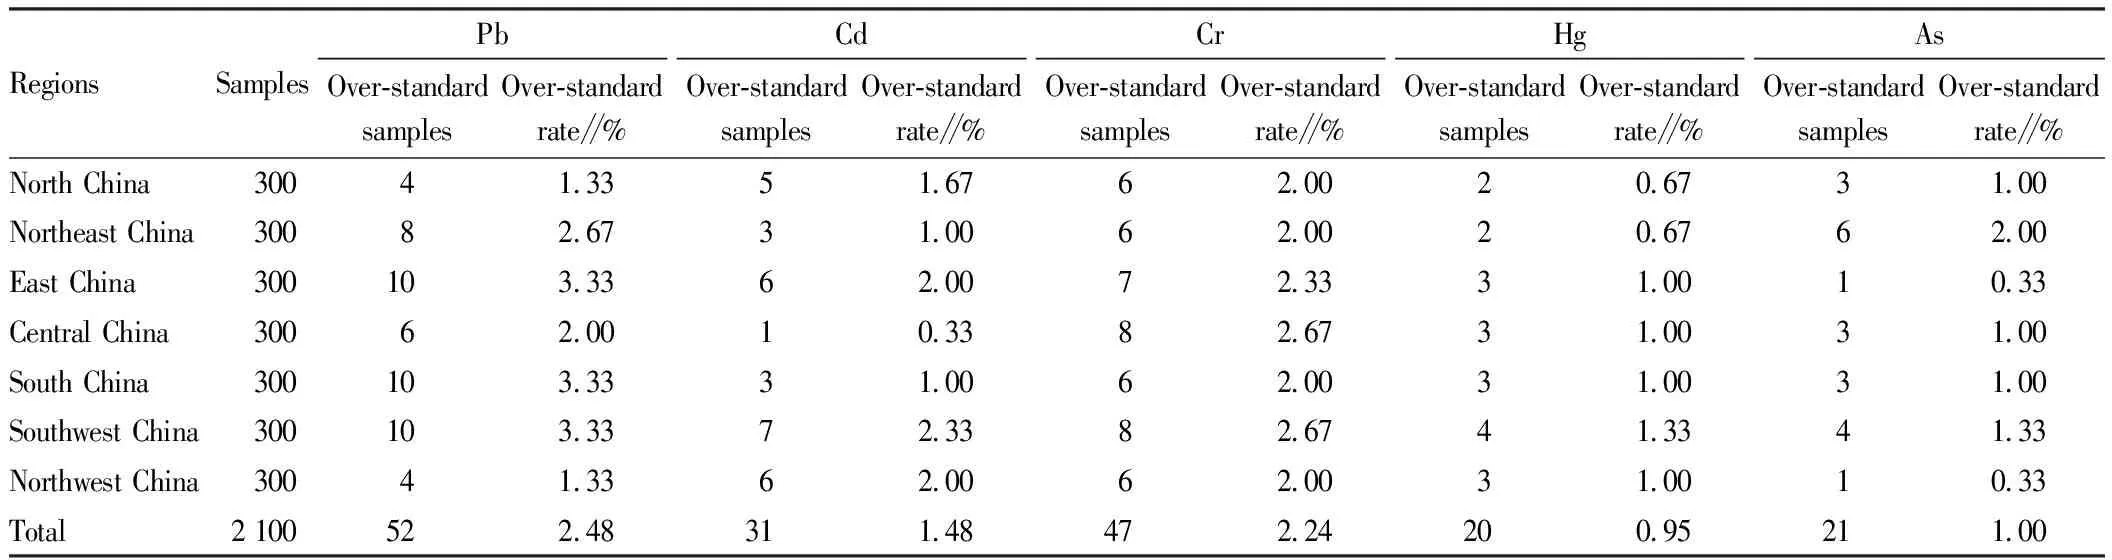
RegionsSamplesPbOver-standardsamplesOver-standardrate∥%CdOver-standardsamplesOver-standardrate∥%CrOver-standardsamplesOver-standardrate∥%HgOver-standardsamplesOver-standardrate∥%AsOver-standardsamplesOver-standardrate∥%North China30041.3351.6762.0020.6731.00Northeast China30082.6731.0062.0020.6762.00East China300103.3362.0072.3331.0010.33Central China30062.0010.3382.6731.0031.00South China300103.3331.0062.0031.0031.00Southwest China300103.3372.3382.6741.3341.33Northwest China30041.3362.0062.0031.0010.33Total2 100522.48311.48472.24200.95211.00
Table5TestresultsofPb,Cd,Cr,HgandAsinduckinChinain2015-2017
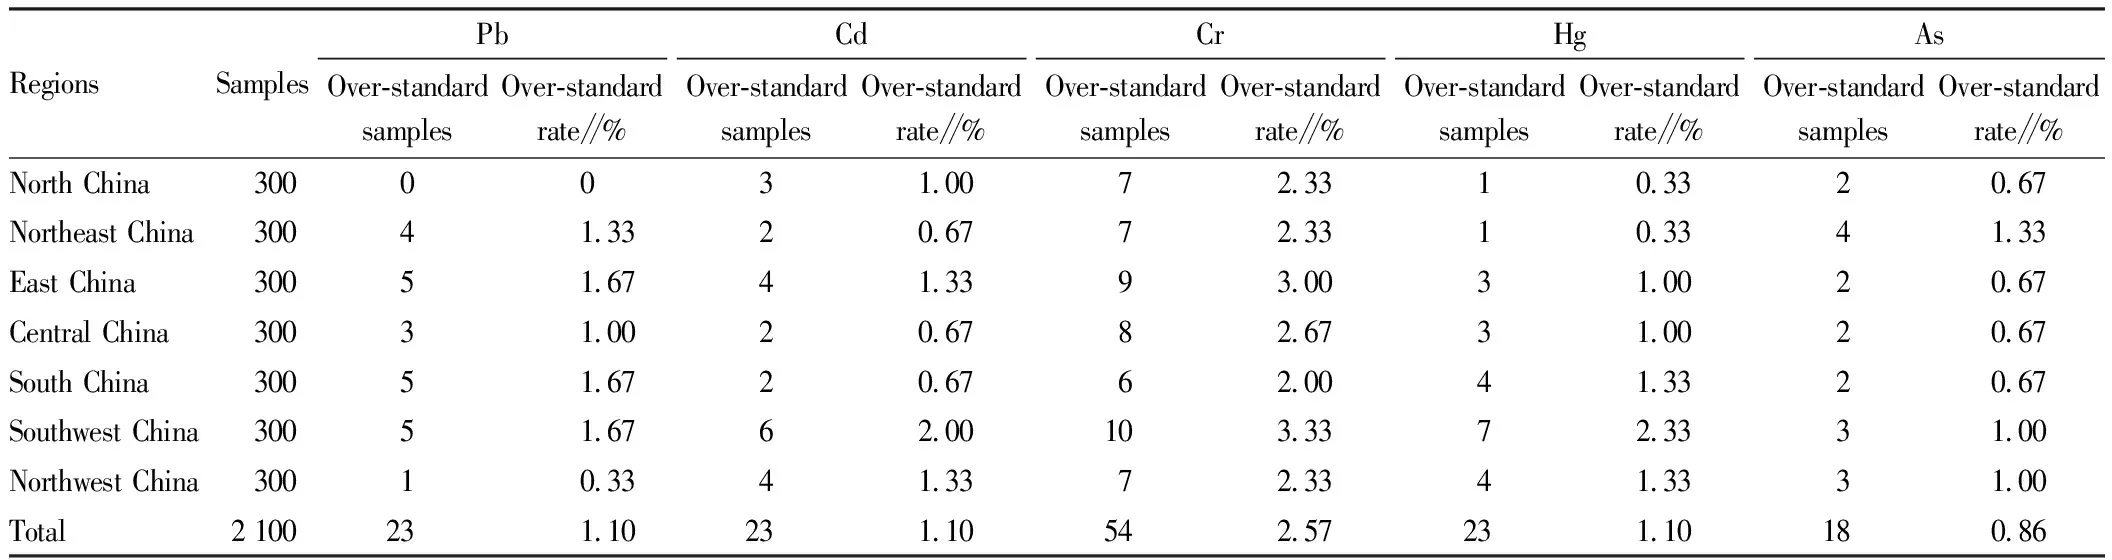
RegionsSamplesPbOver-standardsamplesOver-standardrate∥%CdOver-standardsamplesOver-standardrate∥%CrOver-standardsamplesOver-standardrate∥%HgOver-standardsamplesOver-standardrate∥%AsOver-standardsamplesOver-standardrate∥%North China3000 031.0072.3310.3320.67Northeast China30041.3320.6772.3310.3341.33East China30051.6741.3393.0031.0020.67Central China30031.0020.6782.6731.0020.67South China30051.6720.6762.0041.3320.67Southwest China30051.6762.00103.3372.3331.00Northwest China30010.3341.3372.3341.3331.00Total2 100231.10231.10542.57231.10180.86
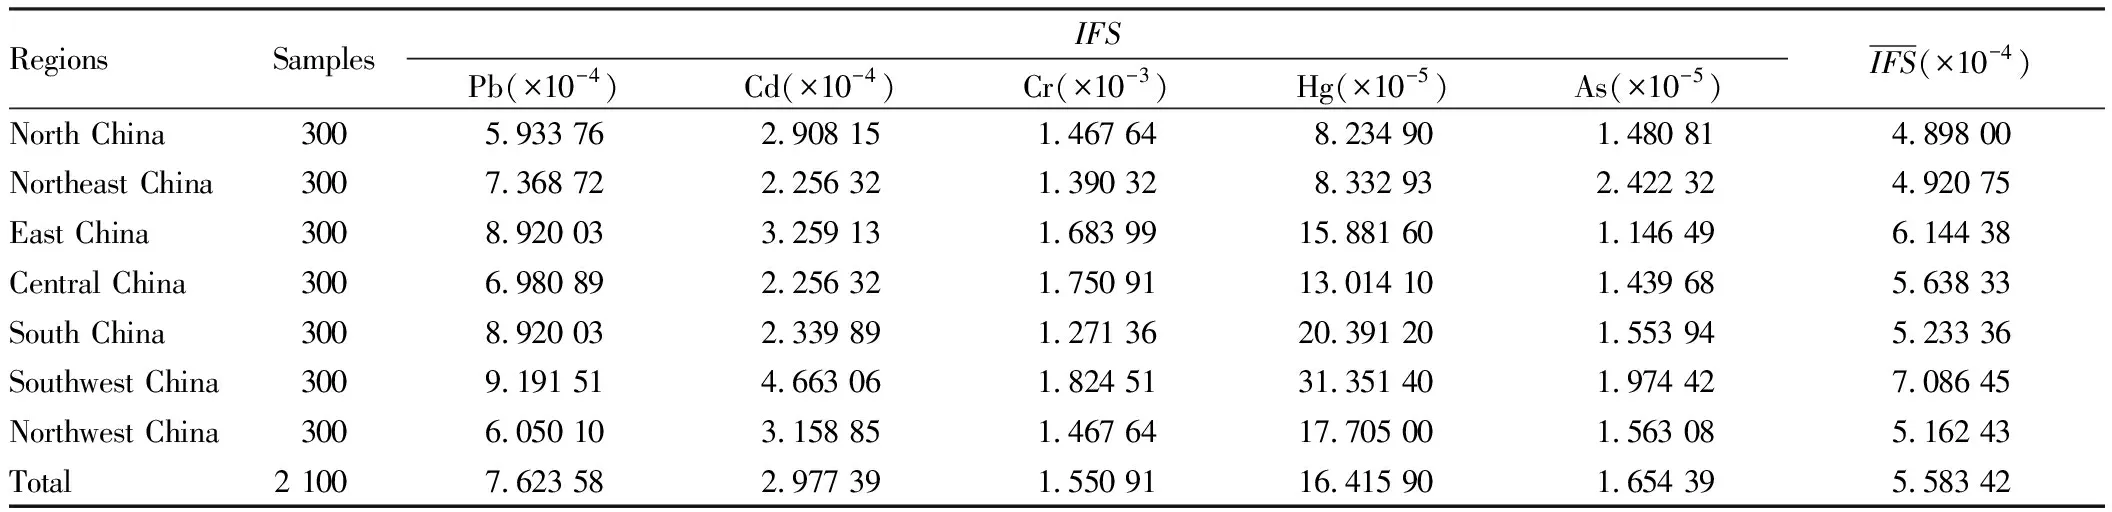
3.2EvaluationandanalysisonfoodsafetyindexesofheavymetalsinlivestockandpoultrymeatThe average IFSs of heavy metals in China’s pork were rated as Cr > Pb > Cd > Hg > As (Table 6). The averageIFSof Cr was almost twice that of Pb, 5.3 times that of Cd, 9.6 times that of Hg, and 96 times that of As. Although the impact of heavy metal Cr on food safety status of livestock and poultry meat is not that severe, it should still be taken seriously. The averageIFSof As was much less than 1, which was almost negligible, indicating that this heavy metal has no influence on food safety status of pork. The averageIFSof Pb in pork in Southwest China was relatively large, almost twice the averageIFSin North China. Southwestern region had the highestIFSvalue of Cd in pork, almost twice the values in Northeast China (which had the lowest CdIFS), Central China and South China. The averageIFSof Cr in pork had no distinct differences among various regions, while the maximum mean (southwest region) was only 1.43 times the minimum mean (South China). The highestIFSof Hg in pork was seen in the Southwest China, and the lowest in North China. The highestIFSof As in pork was seen in northeast region, and the lowest in East China.
As shown in Table 6, Southwest China pork had highest heave metal content, while the Northeast and North China had the lowest. This proved that pork consumers in Northeast China and North China enjoyed the best food safety status. The food safety status for pork consumers in the southwest was worse than in other regions.
China’s averageIFSsof heavy metals in beef were rated as Cr > Pb > Cd > As > Hg (Table 7). The averageIFSof Cr was almost 10 times that of Pb, 88 times that of Cd, 129 times that of As, and 178 times that of Hg. Test and detection of Cr in beef should arouse due attention. The averageIFSsof Cd, Hg and As were negligible, indicating that these heavy metals in beef have no effect on food safety status. Southwest China had relatively large average PbIFSin beef, almost 1.5 times that in North China. Southwestern region has highestIFSvalue of Cd in beef, which was almost twice than Northeast China (with lowest CdIFS), Central China and South China. The averageIFSof Cr in beef had no distinct difference among various regions, while the maximum mean (southwest region) was only 1.44 times higher than the minimum mean (South China). The highestIFSof Hg in beef was in the southwest, and the smallest was in North China. The highestIFSof As in beef was seen in the northwest, and the lowest in the east.
It can be seen from Table 7 that the heavy metal contents in beef in the southwestern China were the highest, while those in the northeast and south China were lowest. It was proven that beef consumers in Northeast and South China enjoyed the best food safety status, while beef consumers in Southwest China had relatively unsatisfied food safety status.
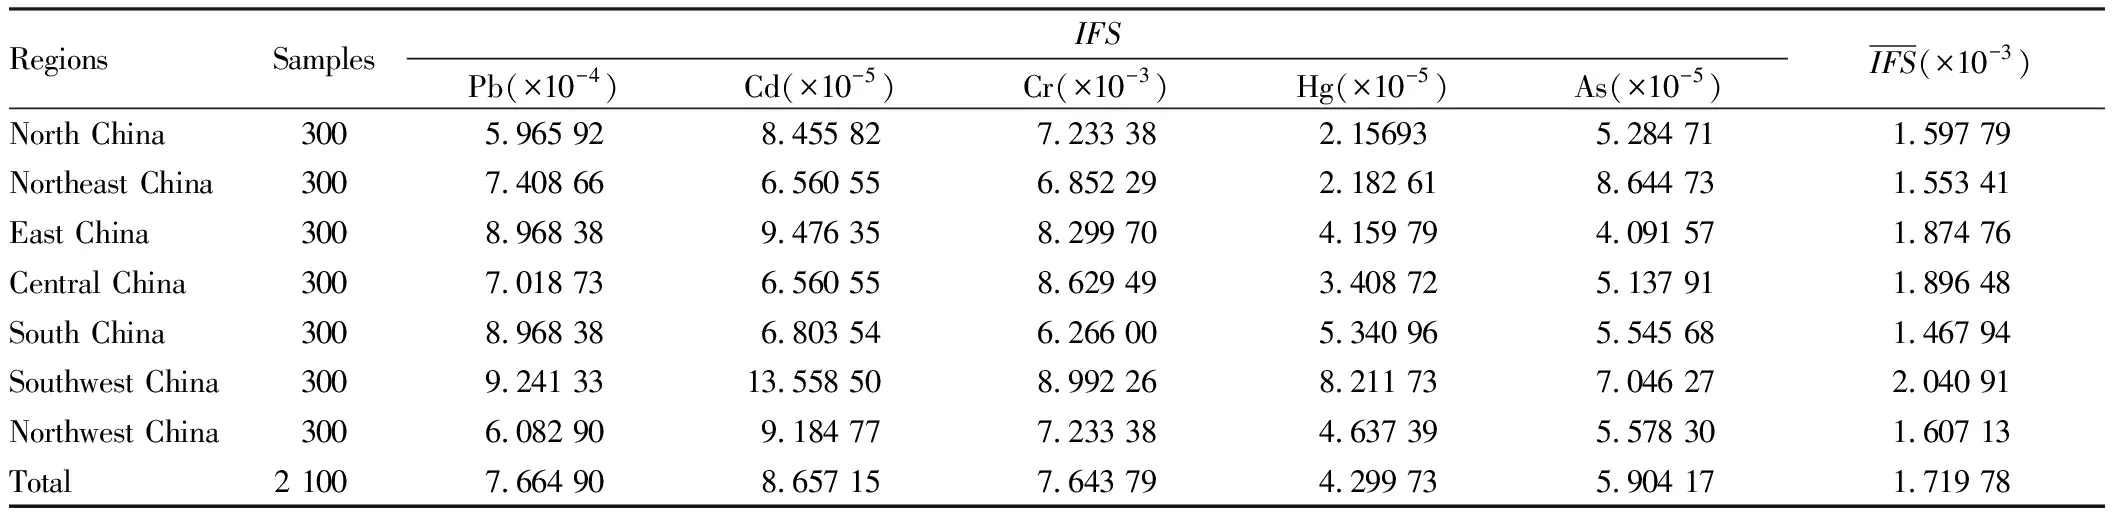
In China, the averageIFSsof heavy metals in mutton were rated as Cr > Pb > As > Cd > Hg (Table 8). The averageIFSof Cr was almost 10 times that of Pb, about 82 times the values of As and Cd, and 276 times that of Hg. The food safety status of mutton is mainly determined by the heavy metal Cr in the mutton, while other heavy metals have less impact. Compared with the averageIFSsof Pb in other regions, Southwest China had highestIFSPb in mutton. TheIFSof Pb in Southwest China was almost 1.5 times those of North China and Northwest China (both had the lowest PbIFS). The highestIFSvalue of Cd in mutton was also seen in southwestern region, which was almost twice that in the northeastern, central and southern parts of China, which had the lowest CdIFSs. The maximumIFSof Cr in mutton was seen in southwest region, 1.4 times higher than the minimum value (South China). The mean value of HgIFSin mutton in each region was much less than 1, which was negligible. The highestIFSvalue of As in mutton was seen in the northeast region, and the lowest was in East China.
It can be seen from Table 8 that the mutton in the southwestern China had the highest heavy metal contents, while northeastern and southern parts of China had lower contents. Mutton consumers in Northeast China and South China enjoyed the best food safety status, while food safety status for mutton consumers in the southwest was not as good as other regions.
In China, the averageIFSsof heavy metals in chicken were rated as Cr > Pb > Hg > Cd > As (Table 9). The averageIFSof Cr was almost 6 times that of Pb, about 48 times that of Hg, 63 times that of Cd, and 876 times that of As. The results showed that safety status of chicken are easily affected mainly by heavy metals of Cr and Pb, while Hg, Cd and As have almost no effect. The averageIFSvalue of Pb in chicken in Southwest China was larger than those in other areas. TheIFSvalue of Pb in Southwest China is was almost 1.5 times that of North China (with the lowest PbIFS). The largestIFSvalue of Cd in chicken was seen in the southwest, while the smallest is was in Northeast China and East China. The maximum CrIFSmean value in chicken was seen in the southwest region, and it was 1.3 times higher than the minimum mean (South China). Southwest region has had the highest HgIFSin chicken, and, while lowest was in North China. TheIFSvalue of As in chicken is was much less than 1, with maximum in the northeast region, and minimum in East China.
It can be seen from Table 9 that heavy metal contents in chicken in southwestern China were the highest, while those in North China, Northeast China and South China were lower. This showed that chicken consumers in North China, Northeast China and South China enjoyed better food safety status.
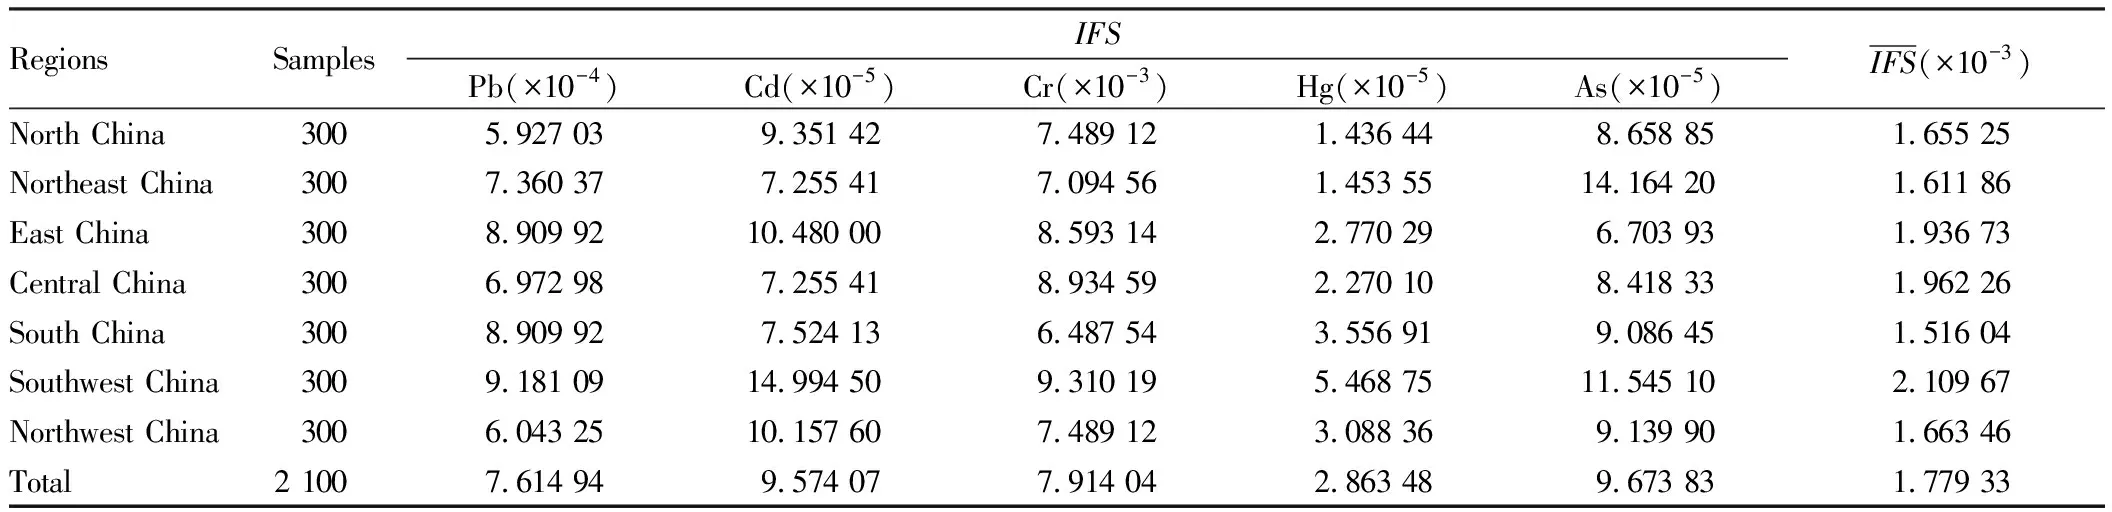
From 2015 to 2017, the averageIFSsof Pb, Cd, Cr, Hg and As in duck meat in China were shown in Table 10. The averageIFSsof Cd, Hg and As in duck meat in China were small, while that of Cr was the largest. The averageIFSsof heavy metals in duck meat were rated as Cr>Pb>Cd>Hg>As. The averageIFSof Cr was almost 10 times that of Pb, 130 times that of Cd, 201 times that of Hg, and 252 times that of As. Cr and Pb in duck meat are more likely to affect food safety status, while the other three heavy metals almost have no effect. The averageIFSof Pb in duck meat in southwestern China was the largest, 1.5 times that of the northern part, which had lowest Pb content. The highest averageIFSof Cd in duck meat was in southwest region, and the lowest was in Northeast and Central China. The maximum averageIFSof Cr in duck was seen in southwest region, which was 1.4 times the minimum mean (South China). The highest value of average HgIFSin duck meat was in southwest region, while the lowest was in North China and Northeast China. TheIFSvalue of As in duck meat was much less than 1, the largest of which was in Northeast China and the smallest in East China.
It can be seen from Table 10 that Southwest China had the highest contents of heavy metals in duck meat, while the lowest were in Northwest, Northeast and South China. It could be seen that duck consumers in Northwest, Northeast and South China enjoyed better food safety status.
Seen from Table 11, the content of heavy metals in livestock and poultry meat in various regions of China are rated as Southwest China > Central China > East China > Northwest China> North China > Northeast China > South China. Among them, southwest region had the highest content of heavy metals in livestock and poultry meat, indicating that food safety status of livestock and poultry meat in this region was not ideal when compared with other regions. In the northeast and south regions, the content of heavy metals in livestock and poultry meat was the lowest, indicating that food safety status of livestock and poultry meat in these two regions were the best.
From Tables 6-10, it can be seen that theIFSvalues of Pb in livestock and poultry meat in China were rated as Southwest China > East China > South China > Northeast China > Central China > Northwest China > North China. TheIFSvalues of Cd in poultry meat were rated as Southwest China > East China > Northwest China > North China > South China > Central China > Northeast China. TheIFSvalues of Cr in livestock and poultry meat were rated as Southwest China > Central China > North China > Northwest China > Northeast China > South China. TheIFSvalues of Hg in livestock and poultry meat were rated as Southwest China > South China > Northwest China > East China > Central China> Northwest China > North China. TheIFSvalues of As in livestock and poultry meat were rated as East China > Southwest China > Northwest China > South China > East China > Central China > Northwest China.
Table6AverageindexesoffoodsafetyofPb,Cd,Cr,HgandAsinporkinChinain2015-2017
RegionsSamplesIFSPb(×10-4)Cd(×10-4)Cr(×10-3)Hg(×10-5)As(×10-5)IFS(×10-4)North China3005.933 762.908 151.467 648.234 901.480 814.898 00Northeast China3007.368 722.256 321.390 328.332 932.422 324.920 75East China3008.920 033.259 131.683 9915.881 601.146 496.144 38Central China300 6.980 892.256 321.750 9113.014 101.439 685.638 33South China3008.920 032.339 891.271 3620.391 201.553 945.233 36Southwest China3009.191 514.663 061.824 5131.351 401.974 427.086 45Northwest China3006.050 103.158 851.467 6417.705 001.563 085.162 43Total2 1007.623 582.977 391.550 9116.415 901.654 395.583 42
Table7AverageindexesoffoodsafetyofPb,Cd,Cr,HgandAsinbeefinChinain2015-2017
RegionsSamplesIFSPb(×10-4)Cd(×10-5)Cr(×10-3)Hg(×10-5)As(×10-5)IFS(×10-3)North China3005.965 928.455 827.233 382.156935.284 711.597 79Northeast China3007.408 666.560 556.852 292.182 618.644 731.553 41East China3008.968 389.476 358.299 704.159 794.091 571.874 76Central China3007.018 736.560 558.629 493.408 725.137 911.896 48South China3008.968 386.803 546.266 005.340 965.545 681.467 94Southwest China3009.241 3313.558 508.992 268.211 737.046 272.040 91Northwest China3006.082 909.184 777.233 384.637 395.578 301.607 13Total2 1007.664 908.657 157.643 794.299 735.904 171.719 78
Table8AverageindexesoffoodsafetyofPb,Cd,Cr,HgandAsinmuttoninChinain2015-2017
RegionsSamplesIFSPb(×10-4)Cd(×10-5)Cr(×10-3)Hg(×10-5)As(×10-5)IFS(×10-3)North China3005.927 039.351 427.489 121.436 448.658 851.655 25Northeast China3007.360 377.255 417.094 561.453 5514.164 201.611 86East China3008.909 9210.480 008.593 142.770 296.703 931.936 73Central China3006.972 987.255 418.934 592.270 108.418 331.962 26South China3008.909 927.524 136.487 543.556 919.086 451.516 04Southwest China3009.181 0914.994 509.310 195.468 7511.545 102.109 67Northwest China3006.043 2510.157 607.489 123.088 369.139 901.663 46Total2 1007.614 949.574 077.914 042.863 489.673 831.779 33
Table9AverageindexesoffoodsafetyofPb,Cd,Cr,HgandAsinchickeninChinain2015-2017
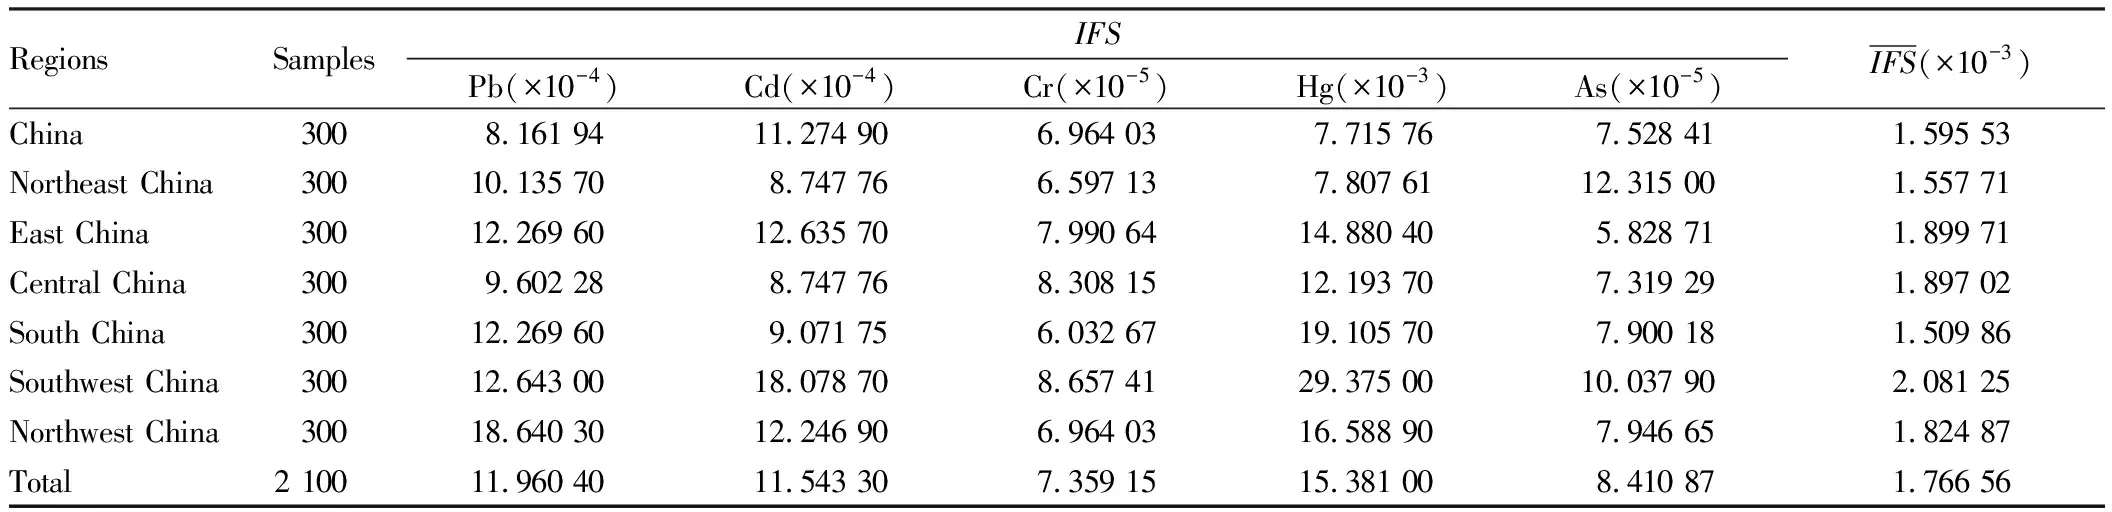
RegionsSamplesIFSPb(×10-4)Cd(×10-4)Cr(×10-5)Hg(×10-3)As(×10-5)IFS(×10-3)China3008.161 9411.274 906.964 037.715 767.528 411.595 53Northeast China30010.135 708.747 766.597 137.807 6112.315 001.557 71East China30012.269 6012.635 707.990 6414.880 405.828 711.899 71Central China3009.602 288.747 768.308 1512.193 707.319 291.897 02South China30012.269 609.071 756.032 6719.105 707.900 181.509 86Southwest China30012.643 0018.078 708.657 4129.375 0010.037 902.081 25Northwest China30018.640 3012.246 906.964 0316.588 907.946 651.824 87Total2 10011.960 4011.543 307.359 1515.381 008.410 871.766 56
Table10AverageindexesoffoodsafetyofPb,Cd,Cr,HgandAsinduckinChinain2015-2017
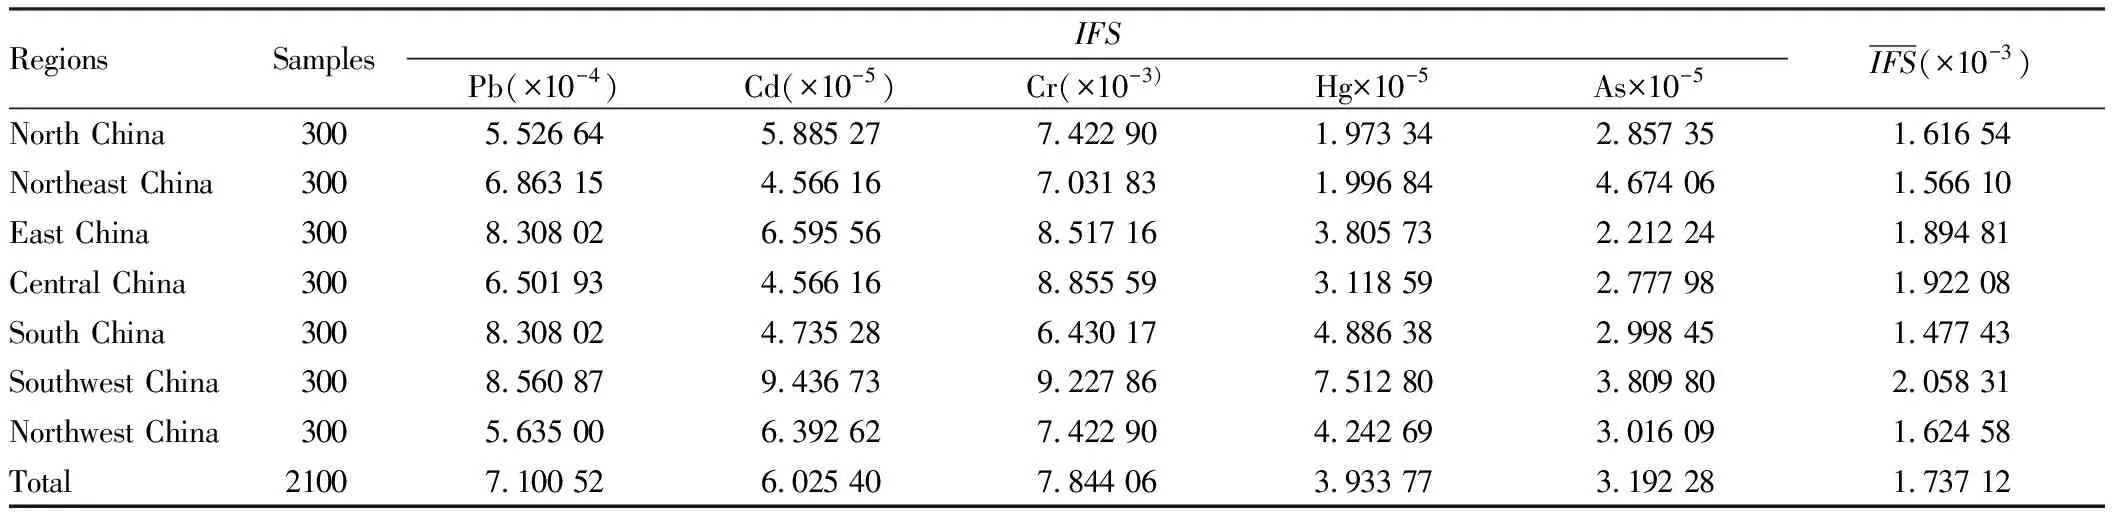
RegionsSamplesIFSPb(×10-4)Cd(×10-5)Cr(×10-3)Hg×10-5As×10-5IFS(×10-3)North China3005.526 645.885 277.422 901.973 342.857 351.616 54Northeast China3006.863 154.566 167.031 831.996 844.674 061.566 10East China3008.308 026.595 568.517 163.805 732.212 241.894 81Central China3006.501 934.566 168.855 593.118 592.777 981.922 08South China3008.308 024.735 286.430 174.886 382.998 451.477 43Southwest China3008.560 879.436 739.227 867.512 803.809 802.058 31Northwest China3005.635 006.392 627.422 904.242 693.016 091.624 58Total21007.100 526.025 407.844 063.933 773.192 281.737 12
Table11AverageindexesoffoodsafetyofPb,Cd,Cr,HgandAsinlivestockandpoultrymeatinChinain2015-2017
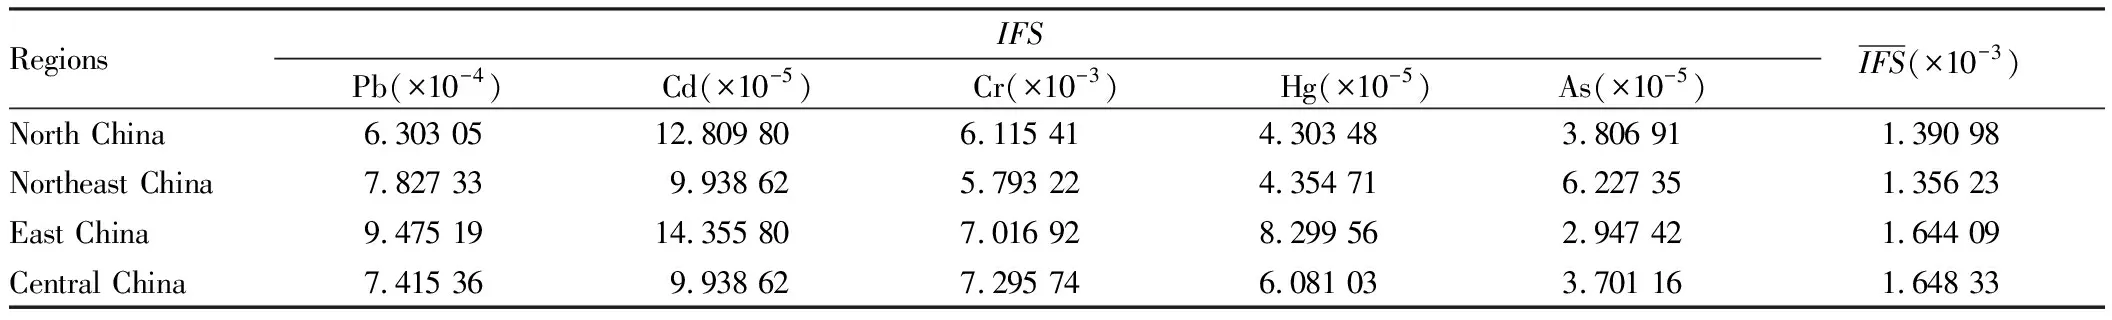
RegionsIFSPb(×10-4)Cd(×10-5)Cr(×10-3)Hg(×10-5)As(×10-5) IFS(×10-3)North China6.303 0512.809 806.115 414.303 483.806 911.390 98Northeast China7.827 339.938 625.793 224.354 716.227 351.356 23East China9.475 1914.355 807.016 928.299 562.947 421.644 09Central China7.415 369.938 627.295 746.081 033.701 161.648 33
(To be continued)
(Continued)
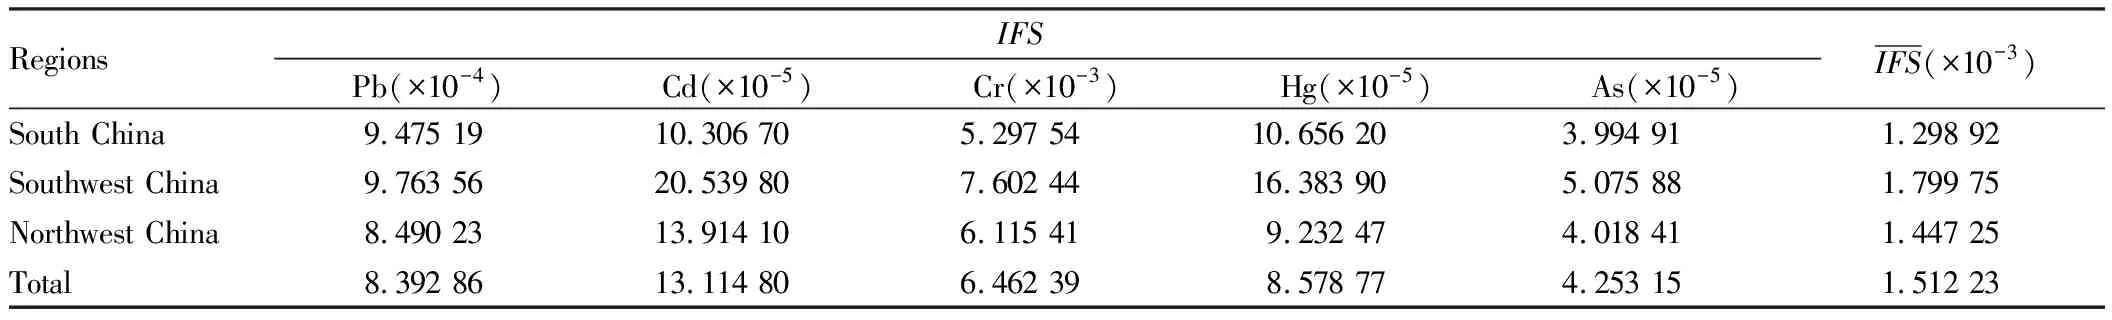
RegionsIFSPb(×10-4)Cd(×10-5)Cr(×10-3)Hg(×10-5)As(×10-5) IFS(×10-3)South China9.475 1910.306 705.297 5410.656 203.994 911.298 92Southwest China9.763 5620.539 807.602 4416.383 905.075 881.799 75Northwest China8.490 2313.914 106.115 419.232 474.018 411.447 25Total8.392 8613.114 806.462 398.578 774.253 151.512 23
4 Conclusions
In this paper, the food safety index method was used to comprehensively report heavy metal pollution inspection results in livestock and poultry meat in different regions of China, based on calculating the over-standard rates of heavy metals. The average food safety indexes (IFSs) of heavy metals in livestock and poultry meat in each region were far less than 1, indicating good food safety status. The results showed that the pollution of Pb, Cd, Cr and Hg in livestock and poultry meat in Southwest China was more severe than that in other regions, while the As pollution in Northeast China was severer than other regions. Different regions of China showed similar orders forIFSvalues of heavy metals in livestock and poultry meat. This method can be used to quantitatively assess food contamination level and objectively evaluate food safety status, with more reasonable and justified evaluation results. Therefore, it can be widely promoted in food contamination assessment.
杂志排行
Asian Agricultural Research的其它文章
- Research Progress of Adansonia digitata
- Overlapped Tray Seedling Raising Model for Mechanical Transplanting of Rice
- Reform of Rural Planting Structure in China since the Reform and Opening-up and Its Main Problems
- Effects of Different Seedling Raising Substrates on Quality of Rice Seedlings
- Cucumber Downy Mildew: Research Progress and Registered Fungicides
- Optimization of Fermentation Process of Carrot Juice by Probiotics and Analysis of Aroma Components