Elastography-based screening for esophageal varices in patients with advanced chronic liver disease
2019-01-29RafaelPaternostroThomasReibergerTheresaBucsics
Rafael Paternostro, Thomas Reiberger, Theresa Bucsics
Abstract Elastography-based liver stiffness measurement (LSM) is a non-invasive tool for estimating liver fibrosis but also provides an estimate for the severity of portal hypertension in patients with advanced chronic liver disease (ACLD). The presence of varices and especially of varices needing treatment (VNT) indicates distinct prognostic stages in patients with compensated ACLD (cACLD). The Baveno VI guidelines suggested a simple algorithm based on LSM < 20 kPa (by transient elastography, TE) and platelet count > 150 G/L for ruling-out VNT in patients with cACLD. These (and other) TE-based LSM cut-offs have been evaluated for VNT screening in different liver disease etiologies. Novel point shear-wave elastography (pSWE) and two-dimensional shear wave elastography(2D-SWE) methodologies for LSM have also been evaluated for their ability to screen for “any” varices and for VNT. Finally, the measurement of spleen stiffness (SSM) by elastography (mainly by pSWE and 2D-SWE) may represent another valuable screening tool for varices. Here, we summarize the current literature on elastography-based prediction of “any” varices and VNT. Finally,we have summarized the published LSM and SSM cut-offs in clinically useful scale cards.
Key words: Elastography; Liver stiffness; Spleen stiffness; Shear wave; Magnetic resonance elastography; Varices; Portal hypertension; Cirrhosis; Advanced chronic liver disease
INTRODUCTION
In 2015, the Baveno VI consensus defined the term “compensated advanced chronic liver disease” (cACLD) in order to better define the spectrum of advanced fibrosis and cirrhosis in asymptomatic patients[1]. In patients with chronic liver diseases, transient elastography (TE) is recommended to screen for cACLD, with values between 10-15 kPa being suggestive and > 15 kPa being highly suggestive for cACLD[1]. Importantly,patients with cACLD should be evaluated for the presence of clinically significant portal hypertension (CSPH) and undergo regular surveillance for hepatocellular carcinoma (HCC). Detection of CSPH most commonly relies on endoscopic screening for esophageal varices (EV) but may be (earlier) identified by hepatic venous pressure gradient (HVPG) measurements showing HVPG ≥ 10 mmHg. Screening for EV is a cornerstone in the management of cirrhotic patients, since the presence of EV indicates a distinct inferior prognosis within cACLD patients. Moreover, varicesneeding-treatment (VNT) are defined by large size (≥ 5 mm) but also include small varices (< 5 mm) in case of Child-C cirrhosis or if red spot signs are present (1,4).Patients with VNTs should receive primary prophylaxis of varices bleeding in order to prevent variceal bleeding, and reduce the risk of decompensation and death[2-4].
Fibrosis-induced increases of hepatic vascular resistance represents the main causative factor for CSPH. Consequently, CSPH leads to development of portosystemic collaterals, such as esophageal-, umbilical-, fundal- and/or rectalvarices. Thus, in cACLD patients the degree of hepatic fibrosis, i.e., LSM results are highly suggestive of CSPH and thus, for EV and VNT. Pathophysiologically, CSPH precludes the formation of EV and can be present in compensated patients that have not yet developed EV[5]. However, due to the limited availability of HVPG, CSPH is clinically most often diagnosed only after EV are detected by upper-gastrointestinal endoscopy[1,5]. Nevertheless, endoscopy is an invasive procedure, requiring training and specialized infrastructure and is not well perceived by patients. Therefore in recent years, several studies have investigated liver elastography as a non-invasive method for the diagnosis of EV and VNT. The Baveno VI consensus statement defined non-invasive criteria based on liver stiffness measurement (LSM) by transient elastography and platelet count by which patients can safely avoid screening endoscopy[1]. In this comprehensive literature review, we summarize current knowledge on non-invasive elastography-based methods for the detection of EV and VNT and its implications in daily clinical practice.
Esophageal varices
Referring to our national guidelines[5], EV should be graded as: absent, small (< 5mm of diameter) or large (> 5 mm of diameter), and the presence of red spots should be indicated for risk stratification[5]. While international guidelines also discriminate between small, medium and large varices[1,3]this discrimination is neither clinically useful, as the international recommendations for the management of medium-to-large varices are similar but only different to small varices and there is considerable interobserver disagreement during endoscopical assessment of variceal size. Thus, we define for the purpose of this review the following categories: “any EV” as any EV detected on endoscopy (including small varices) and “varices-needing-treatment”(VNT) as all (medium)/large varices (≥ 5mm) and small varices found in patients with Child-Pugh C cirrhosis or small varices presenting red spot signs. Accordingly,the capability of non-invasive elastography methods to detect “any varices” and“VNT” was analyzed seperately.
ELASTOGRAPHY METHODS
Over the years, several methods to non-invasively stage fibrosis have been implemented: vibration-controlled or transient elastography (TE), point shear-waveelastography (pSWE), two dimensional shear wave elastography (2D-SWE) and magnetic resonance elastography (MRE).
Elastography assesses tissue elasticity, which is defined as the tendency of tissue that resists deformation when force is applied and the return to its original form once the force is removed[6]. To calculate stiffness certain formulas are used that include variables for tissue elasticity, tissue density and shear wave velocity[7]. In SWE,dynamic stress is applied to the tissue via mechanical vibrations in TE, and acoustic radiation impulses in pSWE and 2D-SWE[6]. Shear waves generated by the device are propagated by the underlying tissue, and measured perpendicular to the acoustic radiation force or parallel to the one-dimensional TE impulse[6]. The shear wave propagation speed varies between tissue densities. This propagation velocity is then measured by the device and reflects tissue elasticity[6]. In MRE, a passive driver,stimulated by acoustic waves enacts physical pressure pulses on the right abdomen and thus, the liver, which is captured and visualized using specific magnetic resonance sequences and software algorithms. In contrast to TE and ultrasound-based SWE that evaluate liver stiffness only locally in small, defined areas limited to a few mm² (pSWE, TE) or up to 4 cm² (2D-SWE), MRE is able to assess stiffness within the entire volume of the liver (3D-SWE). MRE has been reported to be highly reproducible and very accurate in differentiating between low stages of liver fibrosis[8,9].
While most studies on TE, pSWE, 2D-SWE and MRE have focused on correlation with liver fibrosis on histology, several other studies have focused on their potential to non-invasively predict the presence of EV and VNT. We summarized the most important studies in Table 1 (TE), Table 2 (pSWE), Table 3 (2D-SWE) and Table 4(MRE). We furthermore created graphical charts marking important cut-offs for each method, that can easily be implemented in daily clinical practice (see Figure 1 for TE-,Figure 2 for pSWE- , Figure 3A for 2D-SWE- and Figure 3B for MRE-derived cut-offs).
TE
TE is a one dimensional SWE method that measures liver (LSM) or spleen (SSM)stiffness at a depth of 2.5-6.5 cm beneath the skin with an exploration volume of 3 cm²[6]. The propagation velocity of the shear wave is directly proportional to the stiffness of the liver, which in other words means “the faster, the stiffer”[10]. Results measured by SWE are usually presented as either m/s (tissue velocity) or kPa(estimated tissue elasticity). To secure reliability and validity, at least ten measurements should be performed and results must fulfill established quality criteria (median/interquartile range ratio ≤ 30%)[10,11]. However, LSM results obtained in obese patients and patients with ascites have to be interpreted with caution; in some rare cases, valid measurements cannot be obtainable by TE-based LSM[10]. For obese patients, a separate probe (XL) has been developed that increases the proportion of (obese) patients in whom valid LSM can be obtained since measurements are read at high depth and recommendation to use the XL-probe are based on higher skin-to-liver-capsule distances. However, the LSM results obtained by the TE-XL probe may slightly deviate from the standard TE-M probe[12-14].
One of the first studies to report LSM cut-offs for predicting EV was Kazemi et al. in 2006[15]. In a prospective cohort with mixed etiologies, the authors identified 13.9 kPa for any varices (including small varices) and 19.0 kPa for VNT as the suitable cut-offs.In the same year, Foucher et al[16]published a cut-off of 27.5 kPa for ruling-out VNT,also in a mixed cohort of patients. Since then, several studies have been published(Table 1); unfortunately, results on optimal LSM cut-offs vary exceedingly. For the prediction of presence of varices of any size (“any varices”), cut-offs between 6.8 kPa[17]and 28.0 kPa[18]were reported. For the prediction of VNT, which should not be missed by non-invasive screening, values ranged between 14 kPa[19]and 43 kPa[20]. One of the main issues for the highly variable results are diverse aims and approaches of the authors: in studies with a focus on ruling in the presence of EV reporting positivepredictive values (PPV) > 90%, cut-offs range from 15 kPa[21]to 28kPa[18], whereas studies focusing on ruling out EV and reporting negative-predictive values (NPV) >90%, results ranged between 19 kPa[15]and 48 kPa[20].
In 2015 the Baveno VI consensus report on the treatment of portal hypertension[1]was published. These guidelines proposed that in cACLD patients with LSM values <20 kPa and platelet count (PLT) > 150 G/L, screening endoscopy for esophageal varices can be omitted, since these patients have a very low risk for VNT. Since then,multiple studies validating these criteria have been published[19,22-24]. Finally, in a metaanalysis by Marot[25]analyzing data of 3364 patients, the LSM cut-off of 20 kPa (alone)was found to predict the presence of EV with a PPV of 43% and a NPV of 86%.Importantly, another meta-analysis by Pu including 2697 patients reported similar results with a sensitivity of 84% and a specificity of 68% (PPV and NPV not reported)[26].
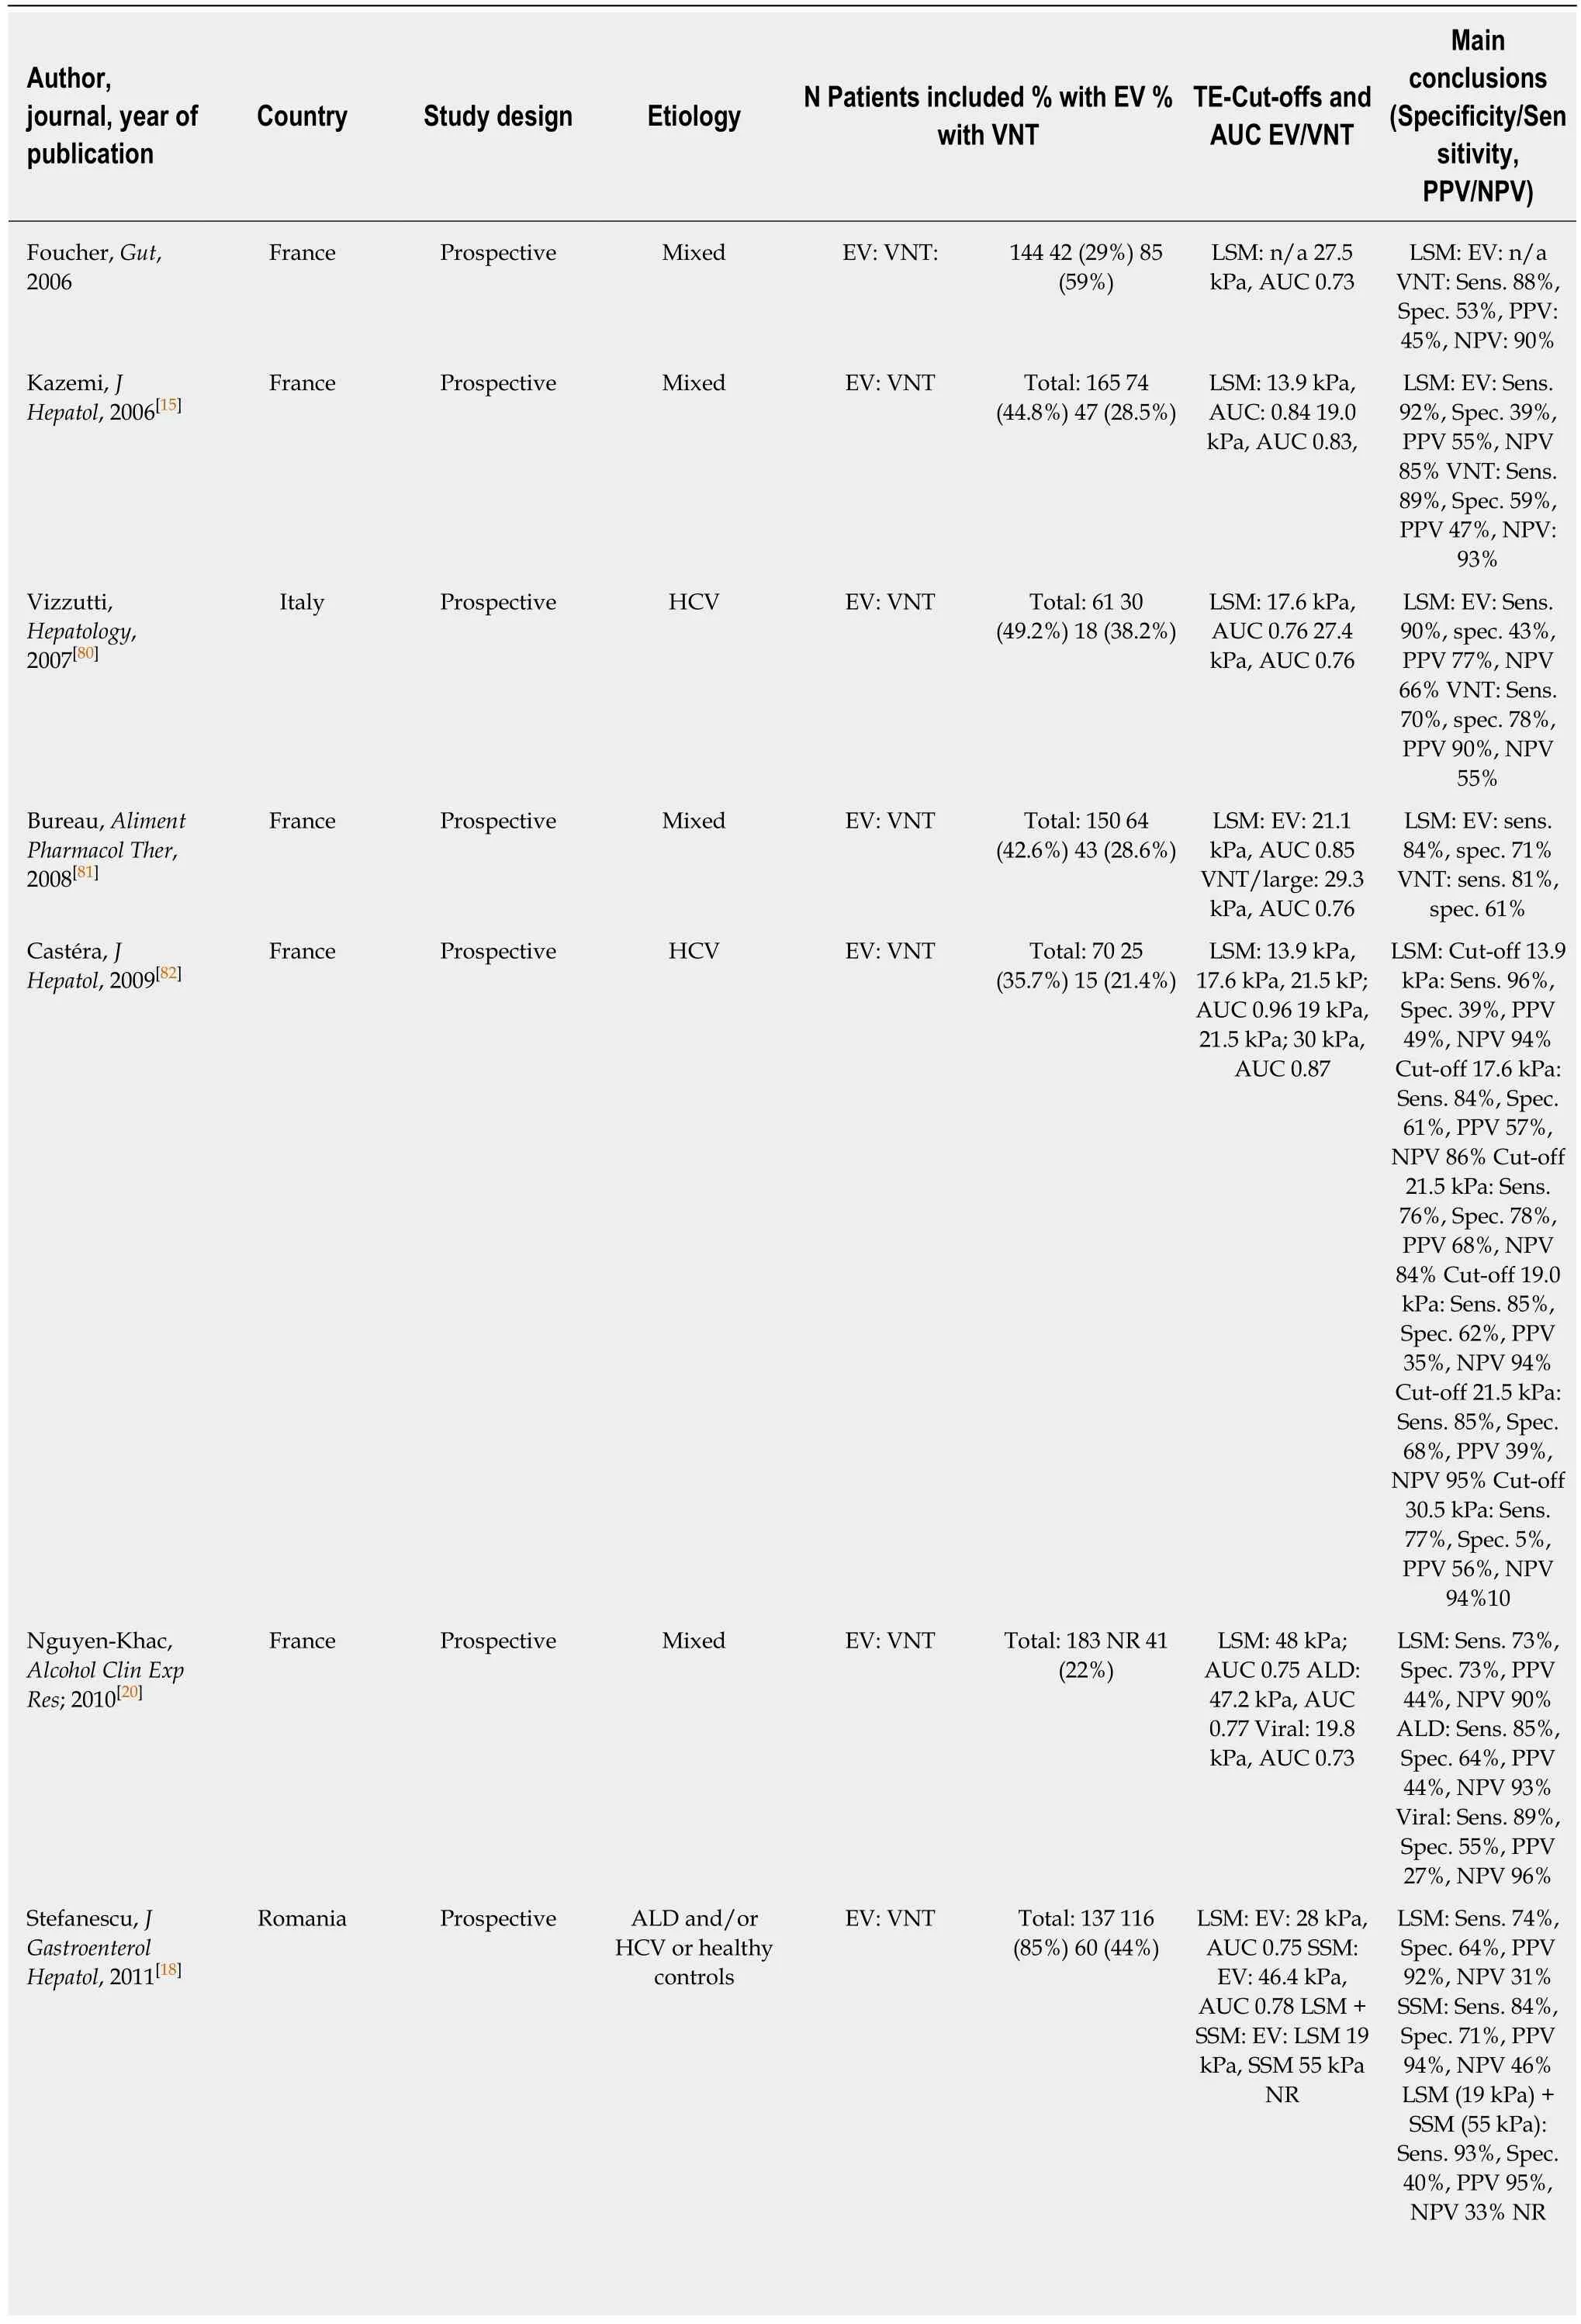
Table 1 Studies on transient elastography for the prediction of varices
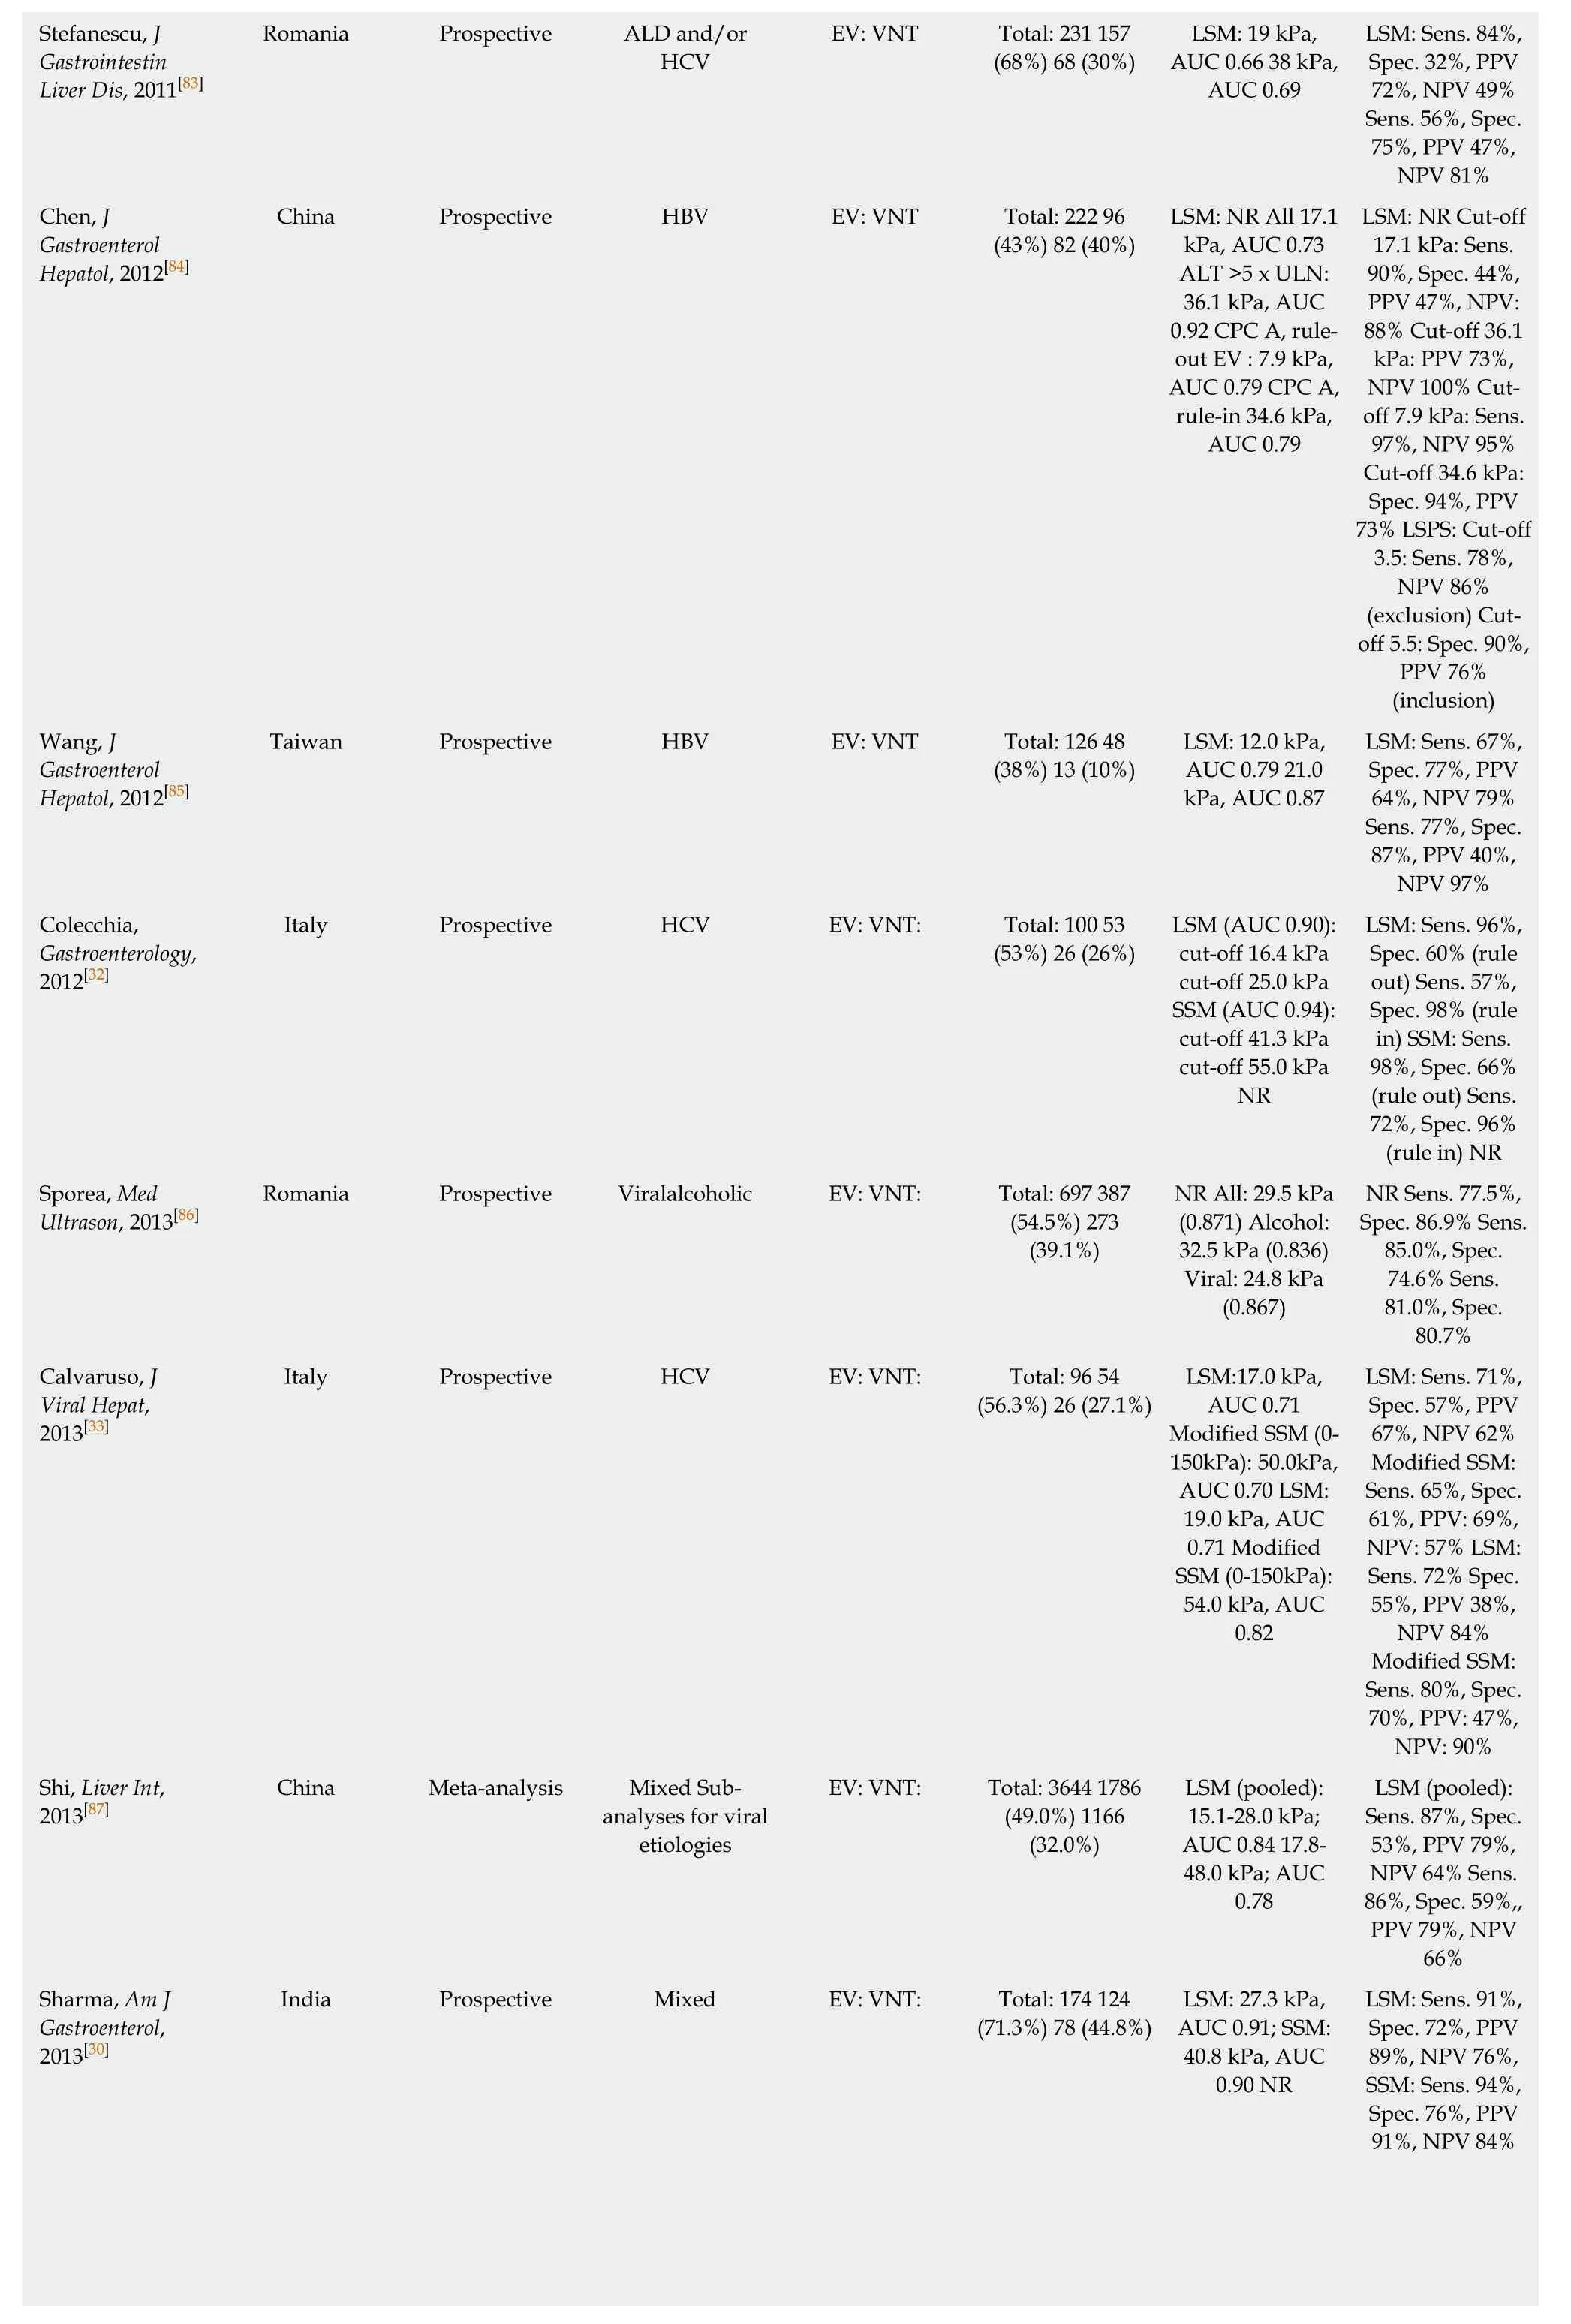
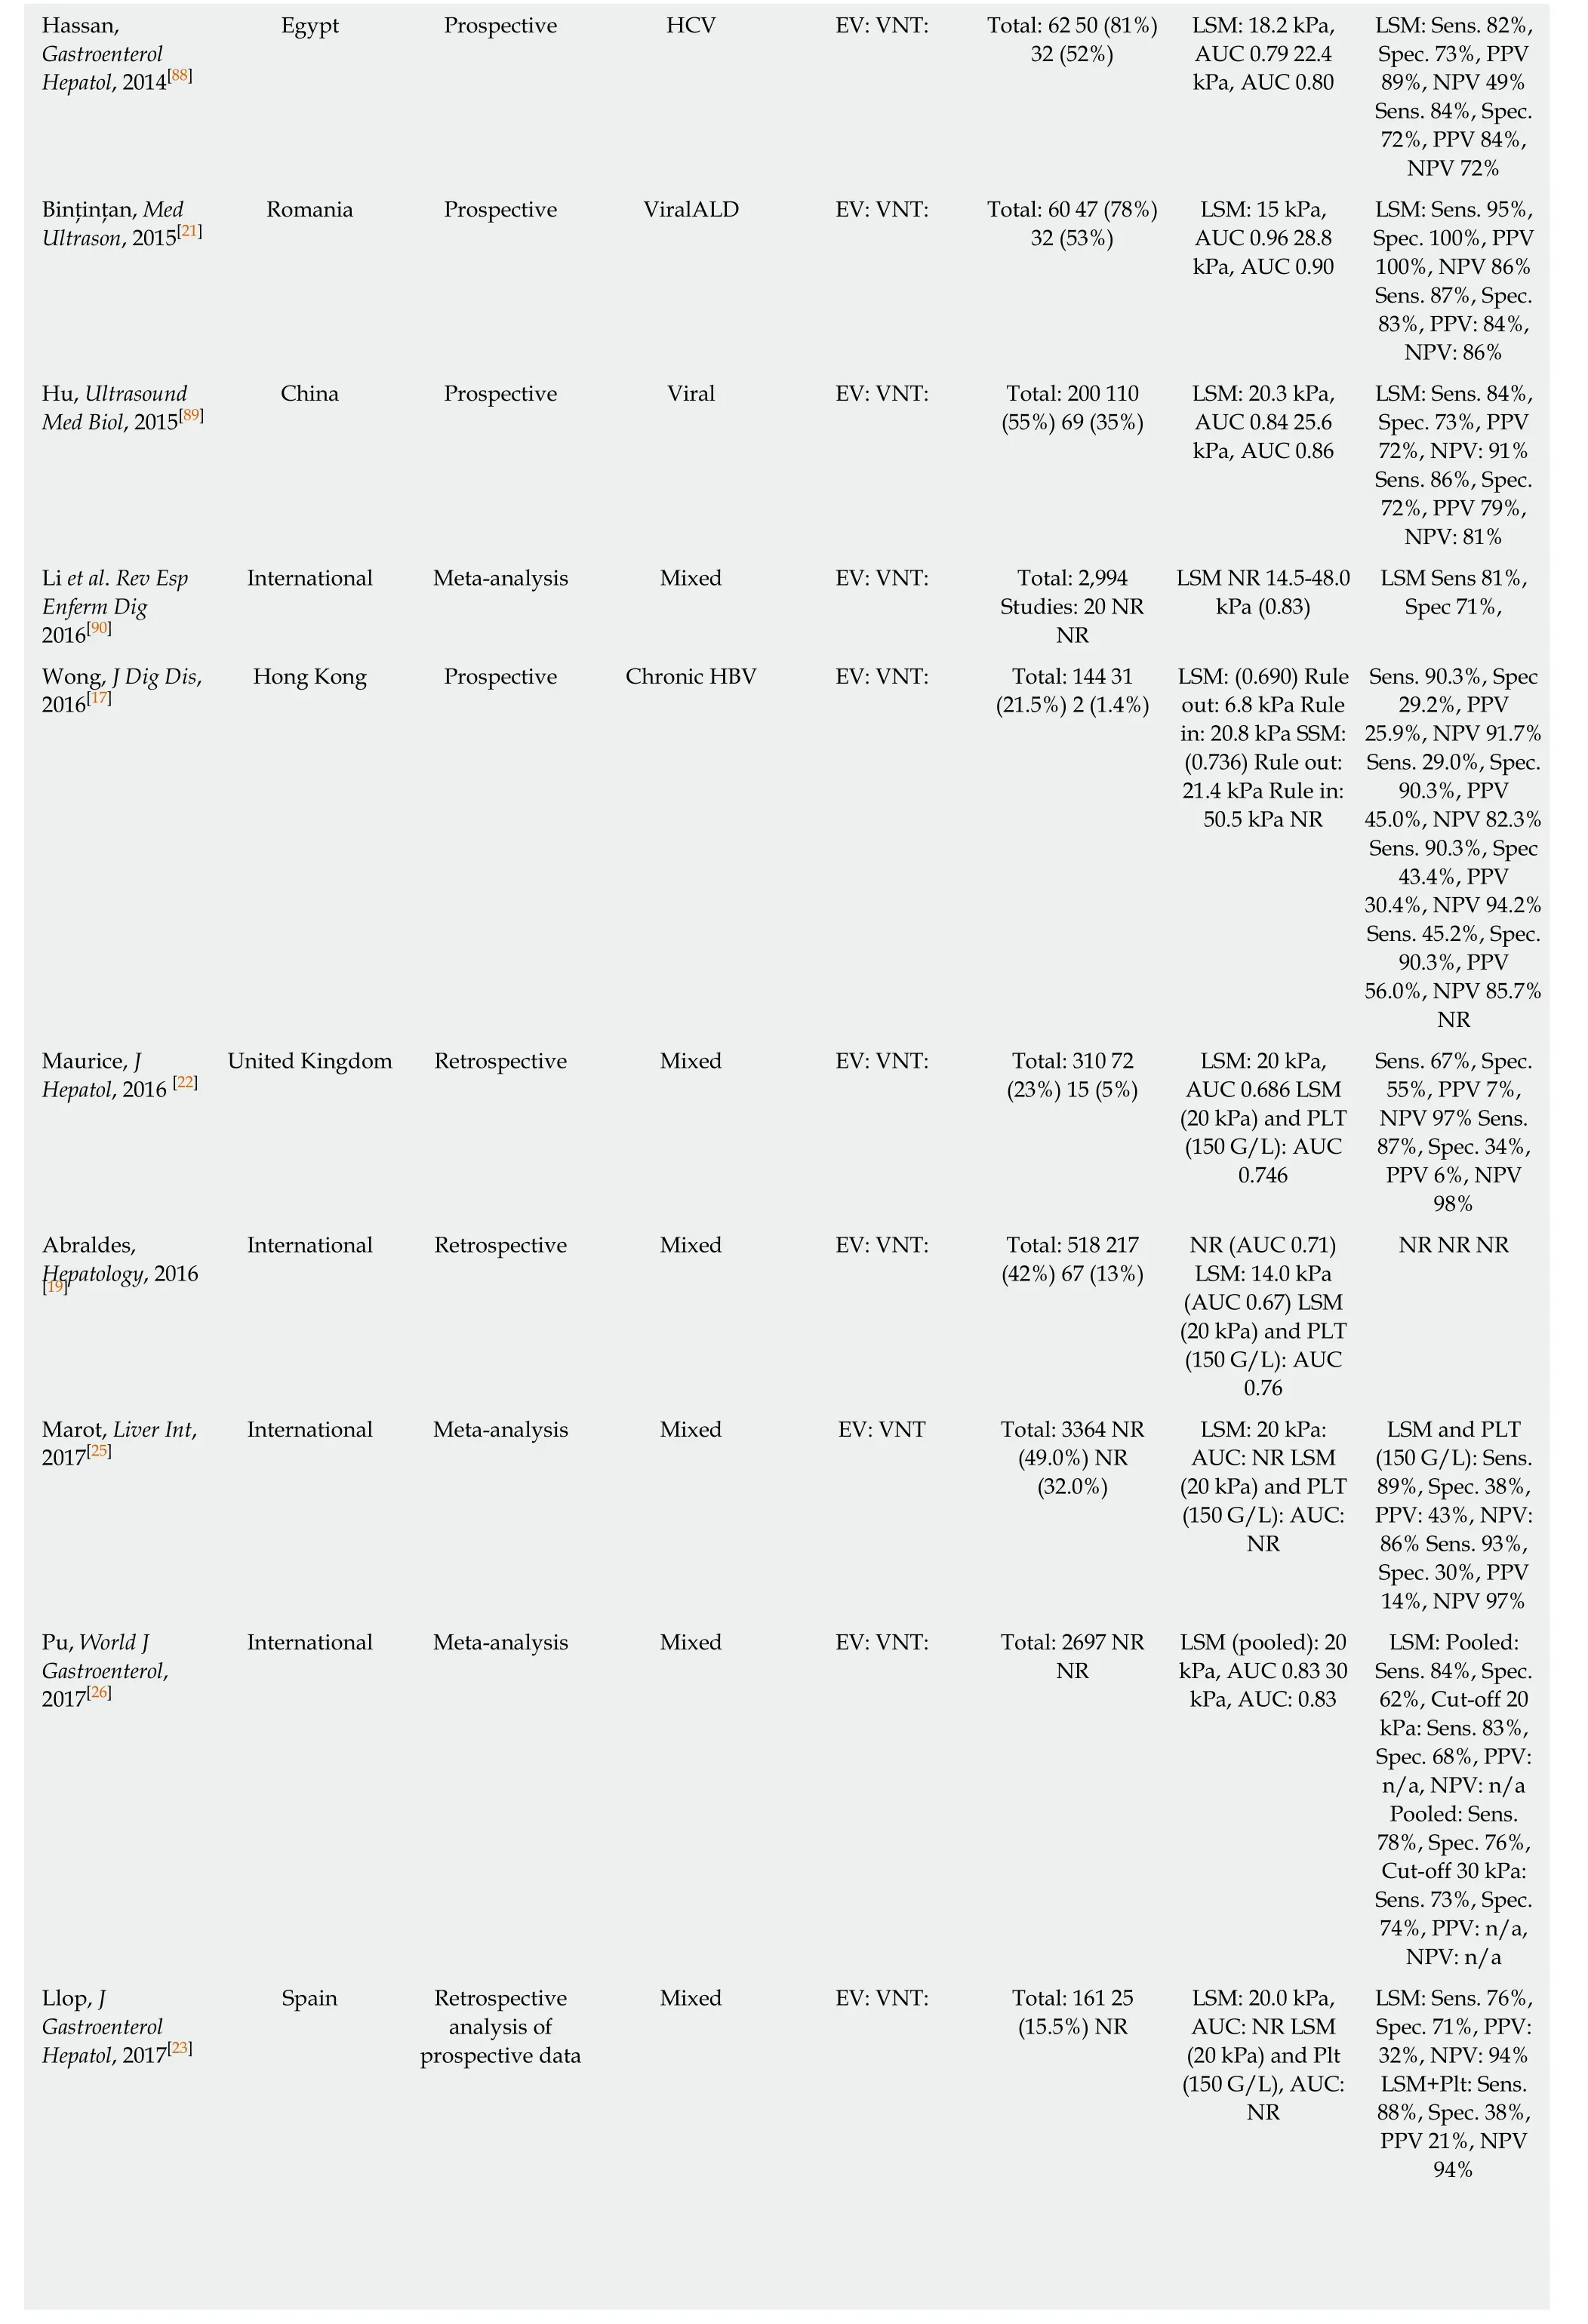
Hassan,Gastroenterol Hepatol, 2014[88]LSM: Sens. 82%,Spec. 73%, PPV 89%, NPV 49%Sens. 84%, Spec.72%, PPV 84%,NPV 72%Binţinţan, Med Ultrason, 2015[21]Egypt Prospective HCV EV: VNT: Total: 62 50 (81%)32 (52%)LSM: 18.2 kPa,AUC 0.79 22.4 kPa, AUC 0.80 LSM: Sens. 95%,Spec. 100%, PPV 100%, NPV 86%Sens. 87%, Spec.83%, PPV: 84%,NPV: 86%Hu, Ultrasound Med Biol, 2015[89]Romania Prospective ViralALD EV: VNT: Total: 60 47 (78%)32 (53%)LSM: 15 kPa,AUC 0.96 28.8 kPa, AUC 0.90 China Prospective Viral EV: VNT: Total: 200 110(55%) 69 (35%)LSM: 20.3 kPa,AUC 0.84 25.6 kPa, AUC 0.86 LSM: Sens. 84%,Spec. 73%, PPV 72%, NPV: 91%Sens. 86%, Spec.72%, PPV 79%,NPV: 81%Li et al. Rev Esp Enferm Dig 2016[90]International Meta-analysis Mixed EV: VNT: Total: 2,994 Studies: 20 NR NR LSM NR 14.5-48.0 kPa (0.83)LSM Sens 81%,Spec 71%,Wong, J Dig Dis,2016[17]Sens. 90.3%, Spec 29.2%, PPV 25.9%, NPV 91.7%Sens. 29.0%, Spec.90.3%, PPV 45.0%, NPV 82.3%Sens. 90.3%, Spec 43.4%, PPV 30.4%, NPV 94.2%Sens. 45.2%, Spec.90.3%, PPV 56.0%, NPV 85.7%NR Maurice, J Hepatol, 2016 [22]Hong Kong Prospective Chronic HBV EV: VNT: Total: 144 31(21.5%) 2 (1.4%)LSM: (0.690) Rule out: 6.8 kPa Rule in: 20.8 kPa SSM:(0.736) Rule out:21.4 kPa Rule in:50.5 kPa NR Sens. 67%, Spec.55%, PPV 7%,NPV 97% Sens.87%, Spec. 34%,PPV 6%, NPV 98%Abraldes,Hepatology, 2016 United Kingdom Retrospective Mixed EV: VNT: Total: 310 72(23%) 15 (5%)LSM: 20 kPa,AUC 0.686 LSM(20 kPa) and PLT(150 G/L): AUC 0.746 NR NR NR[19]International Retrospective Mixed EV: VNT: Total: 518 217(42%) 67 (13%)NR (AUC 0.71)LSM: 14.0 kPa(AUC 0.67) LSM(20 kPa) and PLT(150 G/L): AUC 0.76 Marot, Liver Int,2017[25]International Meta-analysis Mixed EV: VNT Total: 3364 NR(49.0%) NR(32.0%)LSM: 20 kPa:AUC: NR LSM(20 kPa) and PLT(150 G/L): AUC:NR LSM and PLT(150 G/L): Sens.89%, Spec. 38%,PPV: 43%, NPV:86% Sens. 93%,Spec. 30%, PPV 14%, NPV 97%Pu, World J Gastroenterol,2017[26]International Meta-analysis Mixed EV: VNT: Total: 2697 NR NR LSM (pooled): 20 kPa, AUC 0.83 30 kPa, AUC: 0.83 LSM: Pooled:Sens. 84%, Spec.62%, Cut-off 20 kPa: Sens. 83%,Spec. 68%, PPV:n/a, NPV: n/a Pooled: Sens.78%, Spec. 76%,Cut-off 30 kPa:Sens. 73%, Spec.74%, PPV: n/a,NPV: n/a Llop, J Gastroenterol Hepatol, 2017[23]Spain Retrospective analysis of prospective data Mixed EV: VNT: Total: 161 25(15.5%) NR LSM: 20.0 kPa,AUC: NR LSM(20 kPa) and Plt(150 G/L), AUC:NR LSM: Sens. 76%,Spec. 71%, PPV:32%, NPV: 94%LSM+Plt: Sens.88%, Spec. 38%,PPV 21%, NPV 94%
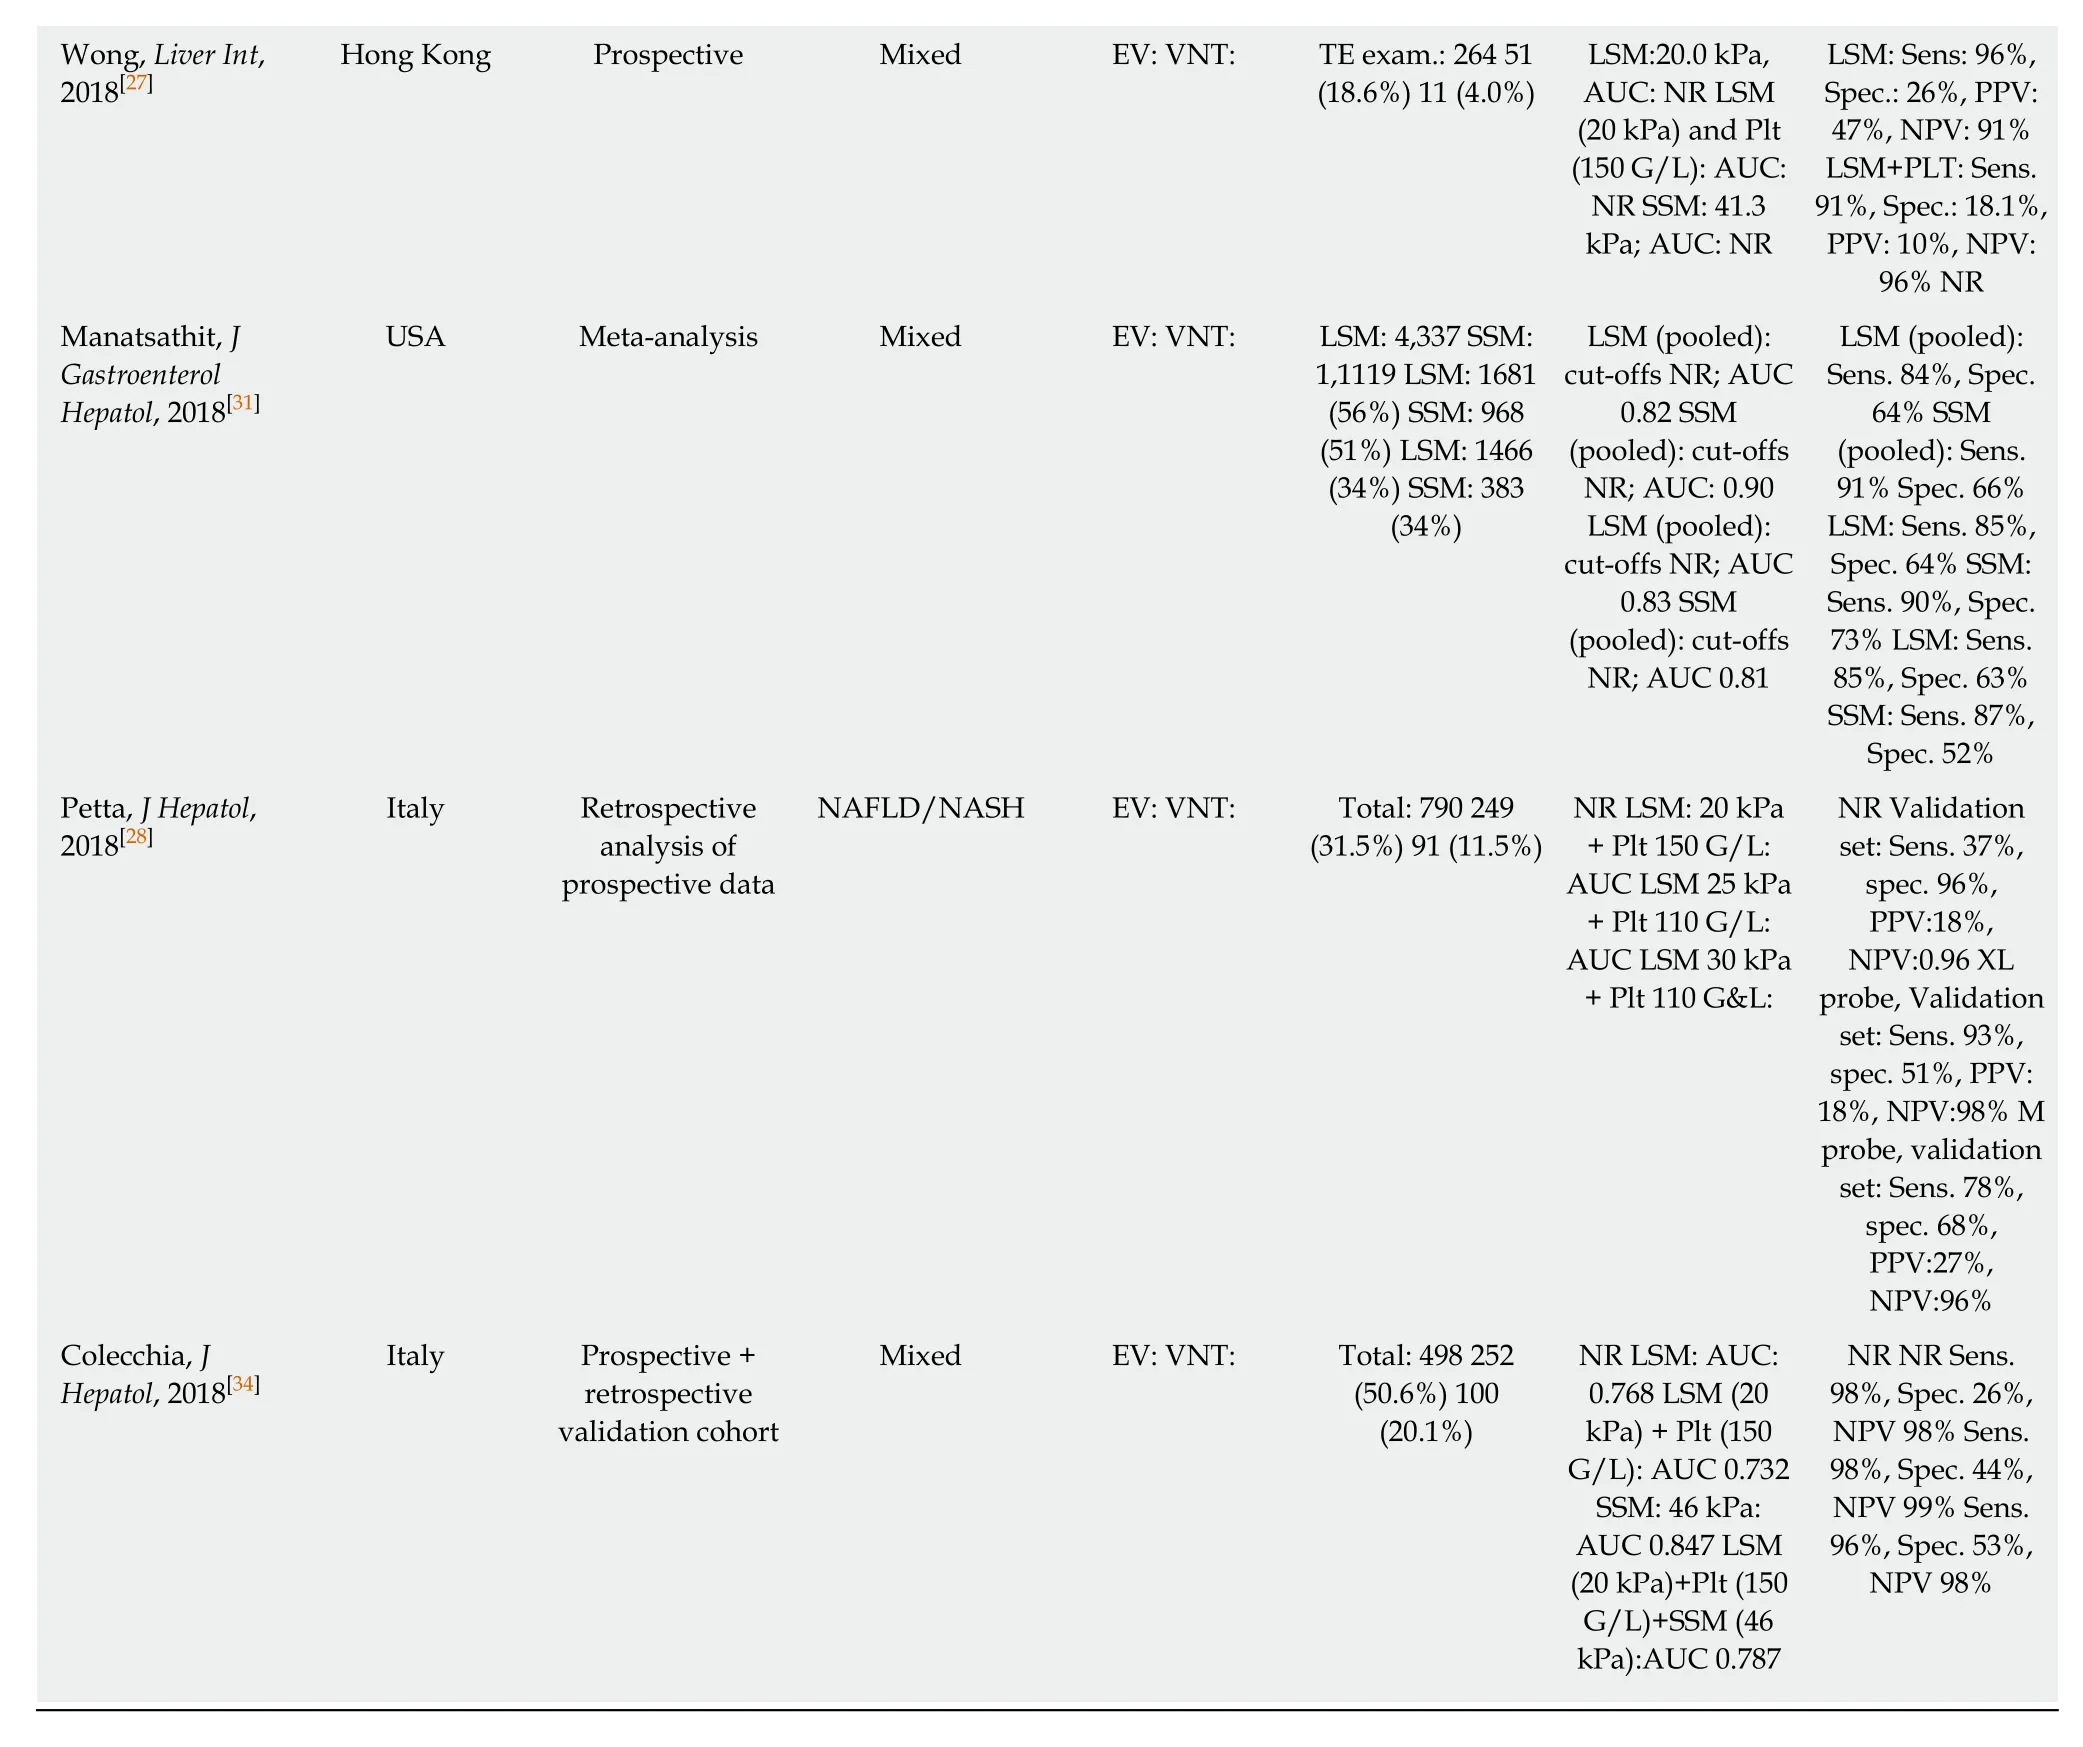
AUC: Area under the (receiver operating) curve; CSPH: Clinically significant portal hypertension; LSM: Liver stiffness measurement; L-SWE: Liver shear wave elastography esophageal varices; TE: Transient elastography; Plt: Platelet count; VNT: Varices needing treatment; Se: Sensitivity; SSM: Spleen stiffness measurement; Sp: Specificity; +LR: Positive likelihood ratio; -LR: Negative likelihood ratio; NR: Not reported; S-SWE: Spleen share wave elastography; ASPS: ARFI-spleen diameter to platelet ratio; ARFI: Acoustic radiation force impulse; PRED: Prediction of significant EV score.
In summary, LSM is a very valuable non-invasive tool for non-invasive exclusion of VNT. However, due to the high variance of results (cut-offs, PPV and NPV values)reported in the literature, we cannot recommend to rely on TE as a single tool for the prediction of EV or VNT, but advise using combination algorithms instead.
TE: combination algorithms
Since the publication of the Baveno VI guidelines[1], most studies reported data on the combination algorithm of LSM + PLT (commonly at the cutoff 150G/L) to rule-out VNT. One of the first studies was the 'Anticipate study'[19]; however, with an AUC of 0.76, results for this algorithm were rather disappointing. Maurice et al[22]evaluated these criteria in 310 patients and reported a PPV of 6% and a NPV of 98%, indicating that these criteria be highly accurate for ruling out VNT as intended. Wong et al[27]prospectively analyzed 274 patients and found similar results with a PPV of 9.5% and a NPV of 95.5%. Most recently, the Baveno VI criteria were tested in a large cohort of NAFLD patients and performed very well, missing only 0.9% of large EV[28].Moreover, a large meta-analysis by Marot including 3364 patients with mixed etiologies of liver disease reported an excellent NPV for ruling out VNT (98%) using the cut-offs proposed by the Baveno VI consensus[25].
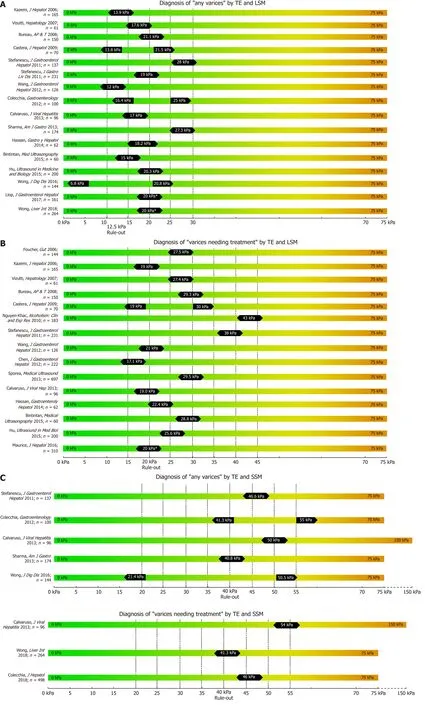
Figure 1 Summary of studies that reported transient elastography derived cut-offs on the non-invasive diagnosis of any varices (A), varices needing treatment (B) using liver stiffness measurement and spleen stiffness measurement respectively (C).
However, according to a recent study by Augustín et al, 40% of all endoscopies performed when applying the Baveno VI criteria to rule out VNTs did not detect varices. The surprisingly low number of spared endoscopies could be increased by raising the cut-off for LSM to 25kPa and lowering the PLT threshold to 110 G/L(‘expanded Baveno VI criteria')[24]. Also Jangouk et al. refined and redefined the Baveno VI criteria by applying the 'Meld-6' rule, where patients that did not fulfill the Baveno VI criteria due to PLT < 150 G/L but had a MELD of six (i.e., normal/preserved liver function) were all not found with VNT, proposing that the number of spared endoscopies could be increased by this adaption of the Baveno VI criteria[29].
In 2013, Sharma et al[30]identified not only LSM, but also spleen stiffness measurement (SSM) as a non-invasive surrogate parameter for the prediction of EV.Indeed, several studies have subsequently investigated the predictive value of SSM using TE[27,30-34]. Importantly, SSM is also able to capture portal hypertension that is due to pre-sinusoidal or pre-hepatic causes that may not be detected by LSM. SSM has universally been shown to be at least equal, if not superior to LSM in regard to the detection of EV as well as of VNT[27,30-34]. This includes a very recent meta-analysis from 2018 by Manatsathit[31]including 4337 patients of mixed etiologies who calculated a pooled AUC of 0.90 for SSM for the detection of any EV as compared to a pooled AUC of 0.82 for LSM, and a pooled AUC of 0.81 vs 0.83 for the detection of VNT for LSM and SSM, respectively. Sharma et al[30]even concluded in their study that, in contrast to LSM, SSM can differentiate between small and large varices.
However, there is a limitation to SSM, as routine TE units (Fibroscan®, Echosens,France) are generally capped at a fibrosis value of 75 kPa. While LSM mostly remains within this range in cACLD patients, in severe portal hypertension SSM can exceed this threshold, especially in patients at highest risk of VNT. For this reason, in a study by Calvaruso et al[33]investigating SSM for the prediction of VNT, the authors used a modified TE unit with a maximum stiffness limit of 150 kPa, demonstrating superior ability of SSM to predict VNT with an AUC of 0.80 as compared to LSM with an AUC of 0.71, respectively. Accordingly, Stefanescu et al[18]combined LSM (cutoff 19 kPa)and SSM (cutoff: 55kPa) into a simple diagnostic algorithm to rule-in any EV with a sensibility of 93% and a PPV of 95%.
In conclusion, combining TE-based LSM with other non-invasive parameters such as PLT or SSM significantly increases the diagnostic accuracy for predicting the presence of EV. Given the convincing evidence, the combined Baveno VI criteria to rule out VNT at TE-based LSM < 20kPa and PLT > 150G/L have already been adapted into national guidelines[5].
Point shear wave elastography
In contrast to TE as a 1D-SWE that uses vibration-controlled dynamic stress, pSWE and 2D-SWE are based on the ultrasound-based acoustic radiation force impulse(ARFI) technology[6]. In pSWE, ARFI is used to generate a high-intensity shortduration acoustic pulse that slightly displaces liver tissue at one specific point[6,35]. As ARFI is usually implemented into modified ultrasound probes, one of the major advantages compared to TE is the availability to visualize liver tissue via B-Mode[6,10].Furthermore, the tissue is being displaced directly in the liver with focus on the ROI rather than on the body surface, making the technique less prone to ascites or obesity[6,10]. However, pSWE is limited by the small region of interest (ROI) compared to other SWE modalities, which makes it more prone to “sample” bias and to artefacts,e.g., due to patient movements[10]. In 2014, Salzl et al[36]reported an AUC of 0.855 for the prediction of CSPH and an AUC of 0.743 for the prediction of EV using pSWE (as compared to EV prediction by TE with an AUC of 0.802). Similar results were found in a Japanese cohort of patients with mixed etiologies with an AUC 0.833 for the prediction of CSPH, an AUC of 0.789 for any varices and AUC an 0.788 for VNT respectively[37]. Most recently LSM via pSWE was found to predict presence of EV with an AUC of 0.913, as compared to pSWE-based SSM with an AUC of 0.675[38],however, only 21 patients with “low-grade EVs” and none with VNT have been included.
After the promising result of TE-based SSM, several studies have been published on the value of pSWE-based SSM for the diagnosis of CSPH and for EV[35]. The AUC of pSWE-based SSM ranged from 0.578[39]to 0.959[40]for any EV and between 0.580[41]to 0.955[37]for VNT. In a large cohort of 340 patients with mixed etiologies, SSM had the best diagnostic accuracy for the identification of patients with any EV (AUC 0.937 for viral, AUC 0.923 for non-viral etiologies) or VNT (AUC 0.924 for viral, 0.944 for non-viral etiologies) when compared to other non-invasive parameters (such as LSM,spleen diameter and PLT)[42].
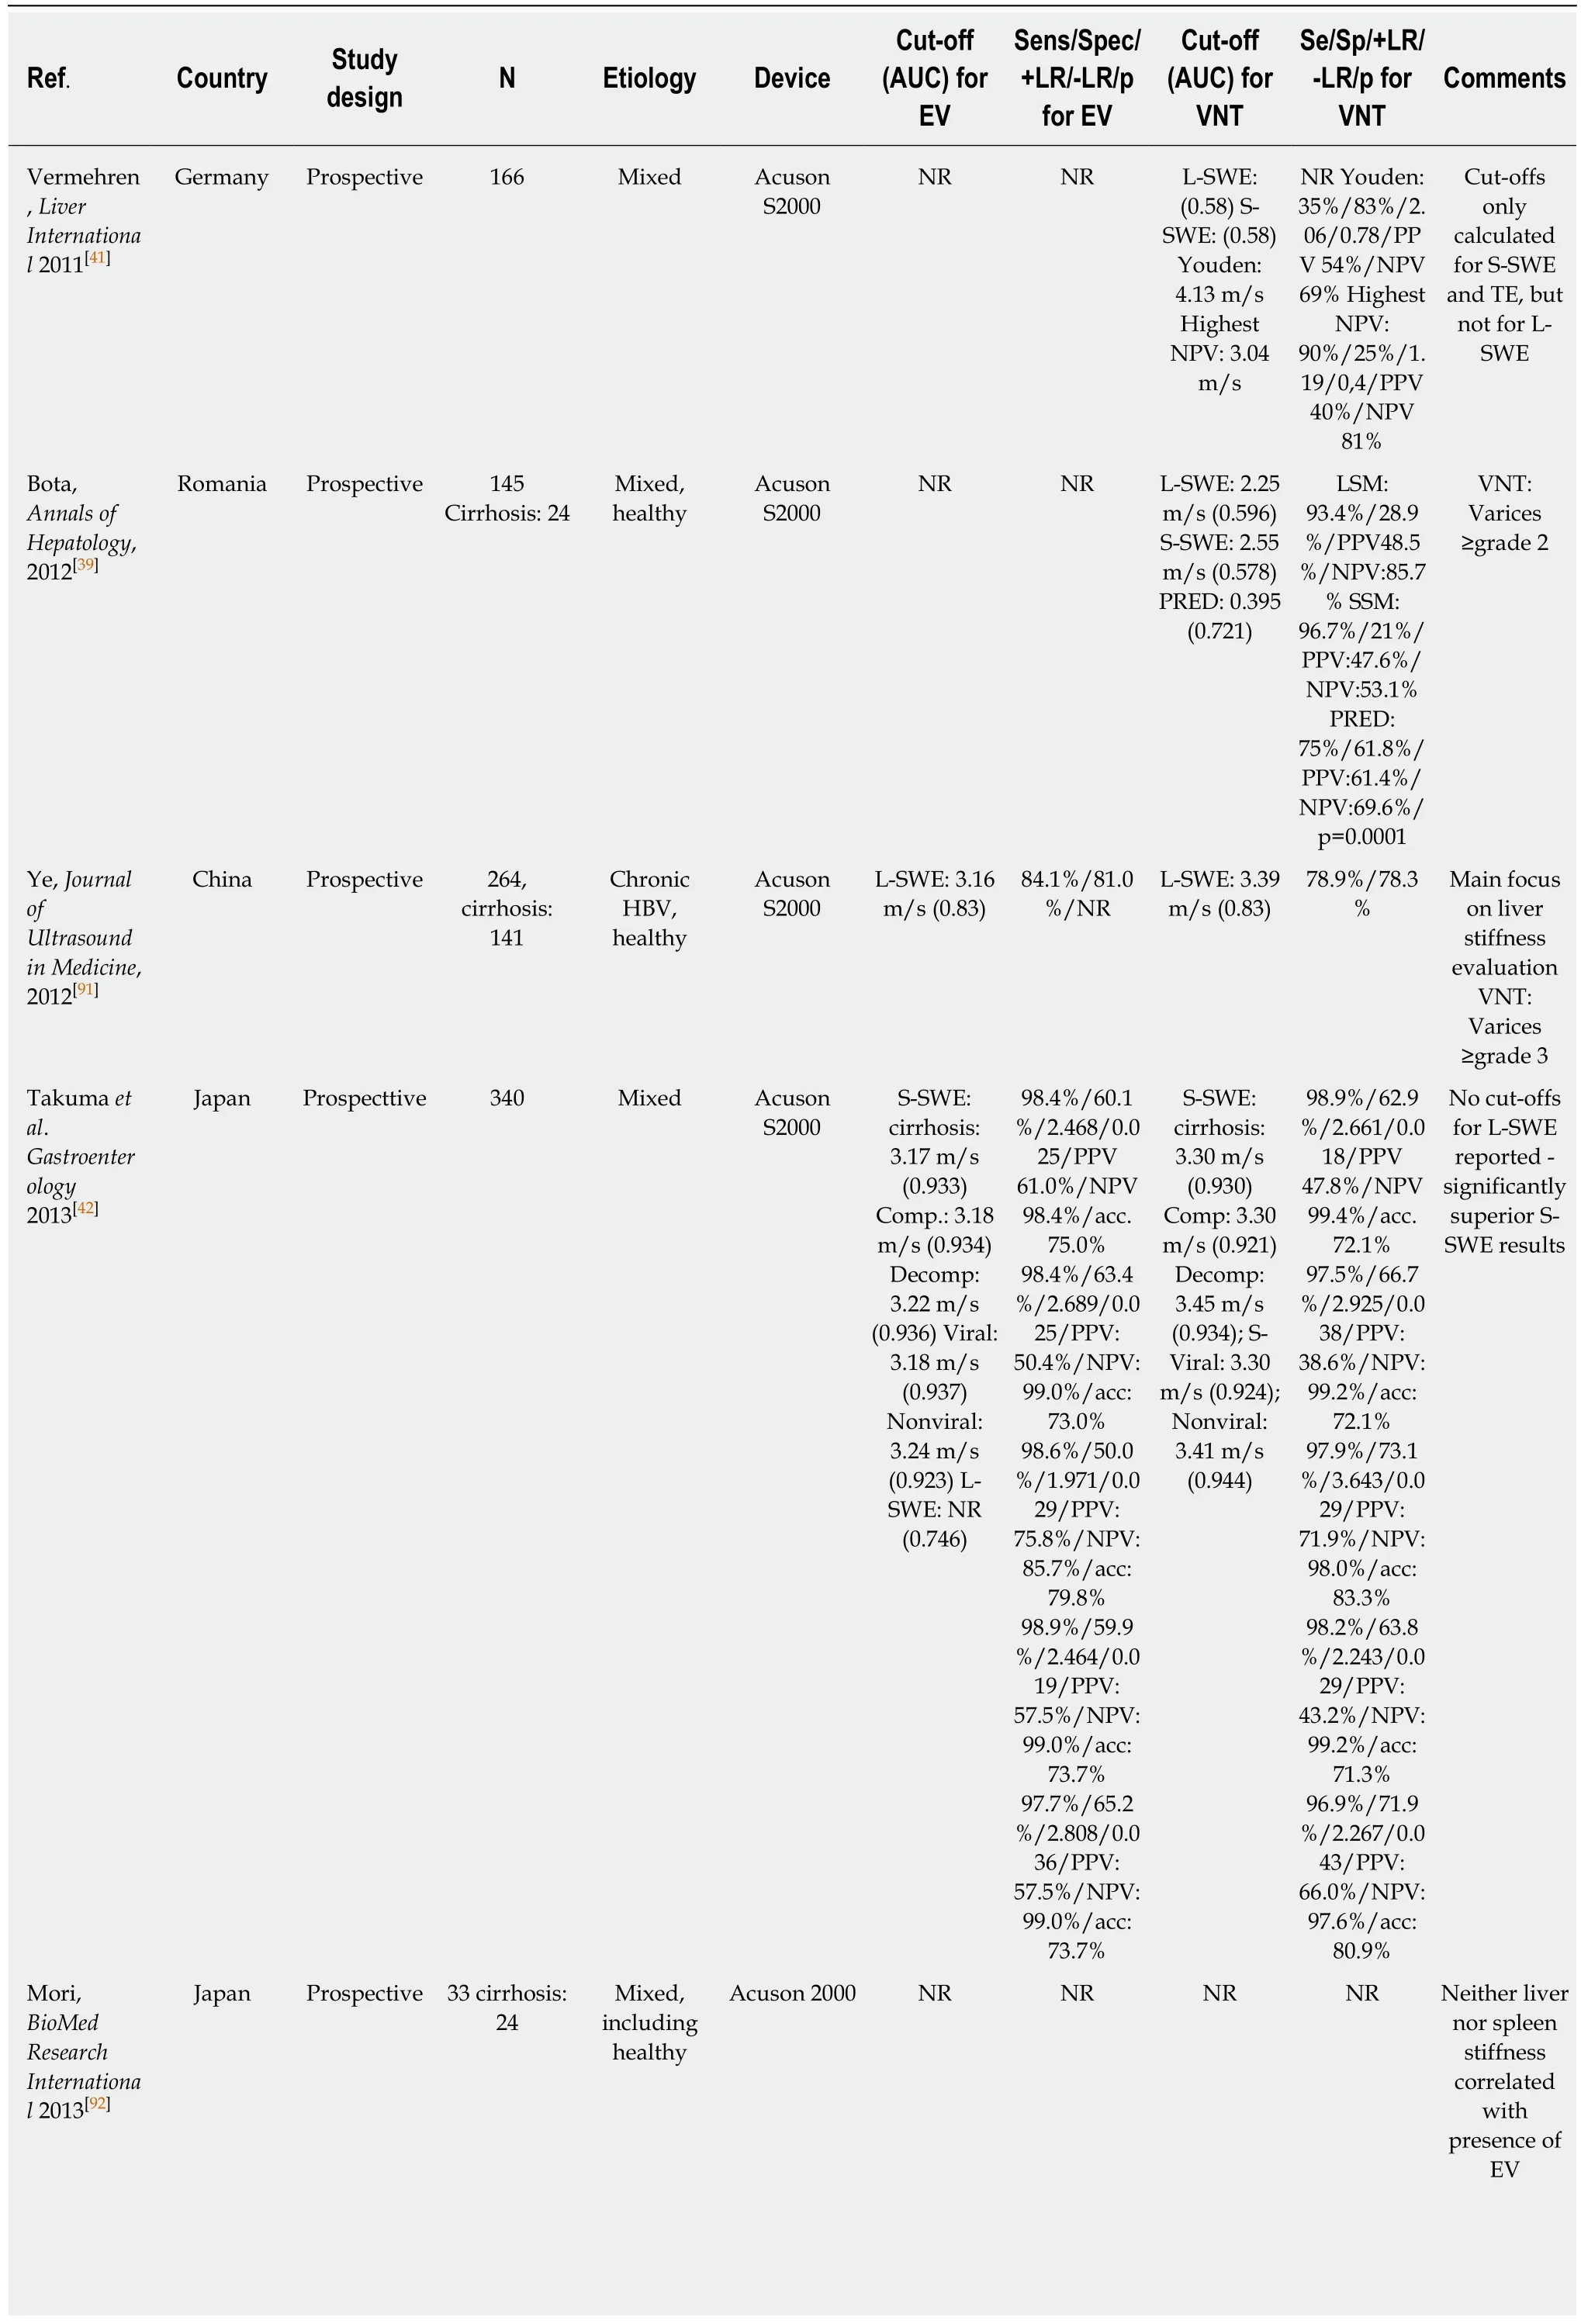
Table 2 Point shear wave elastography for the prediction of varices
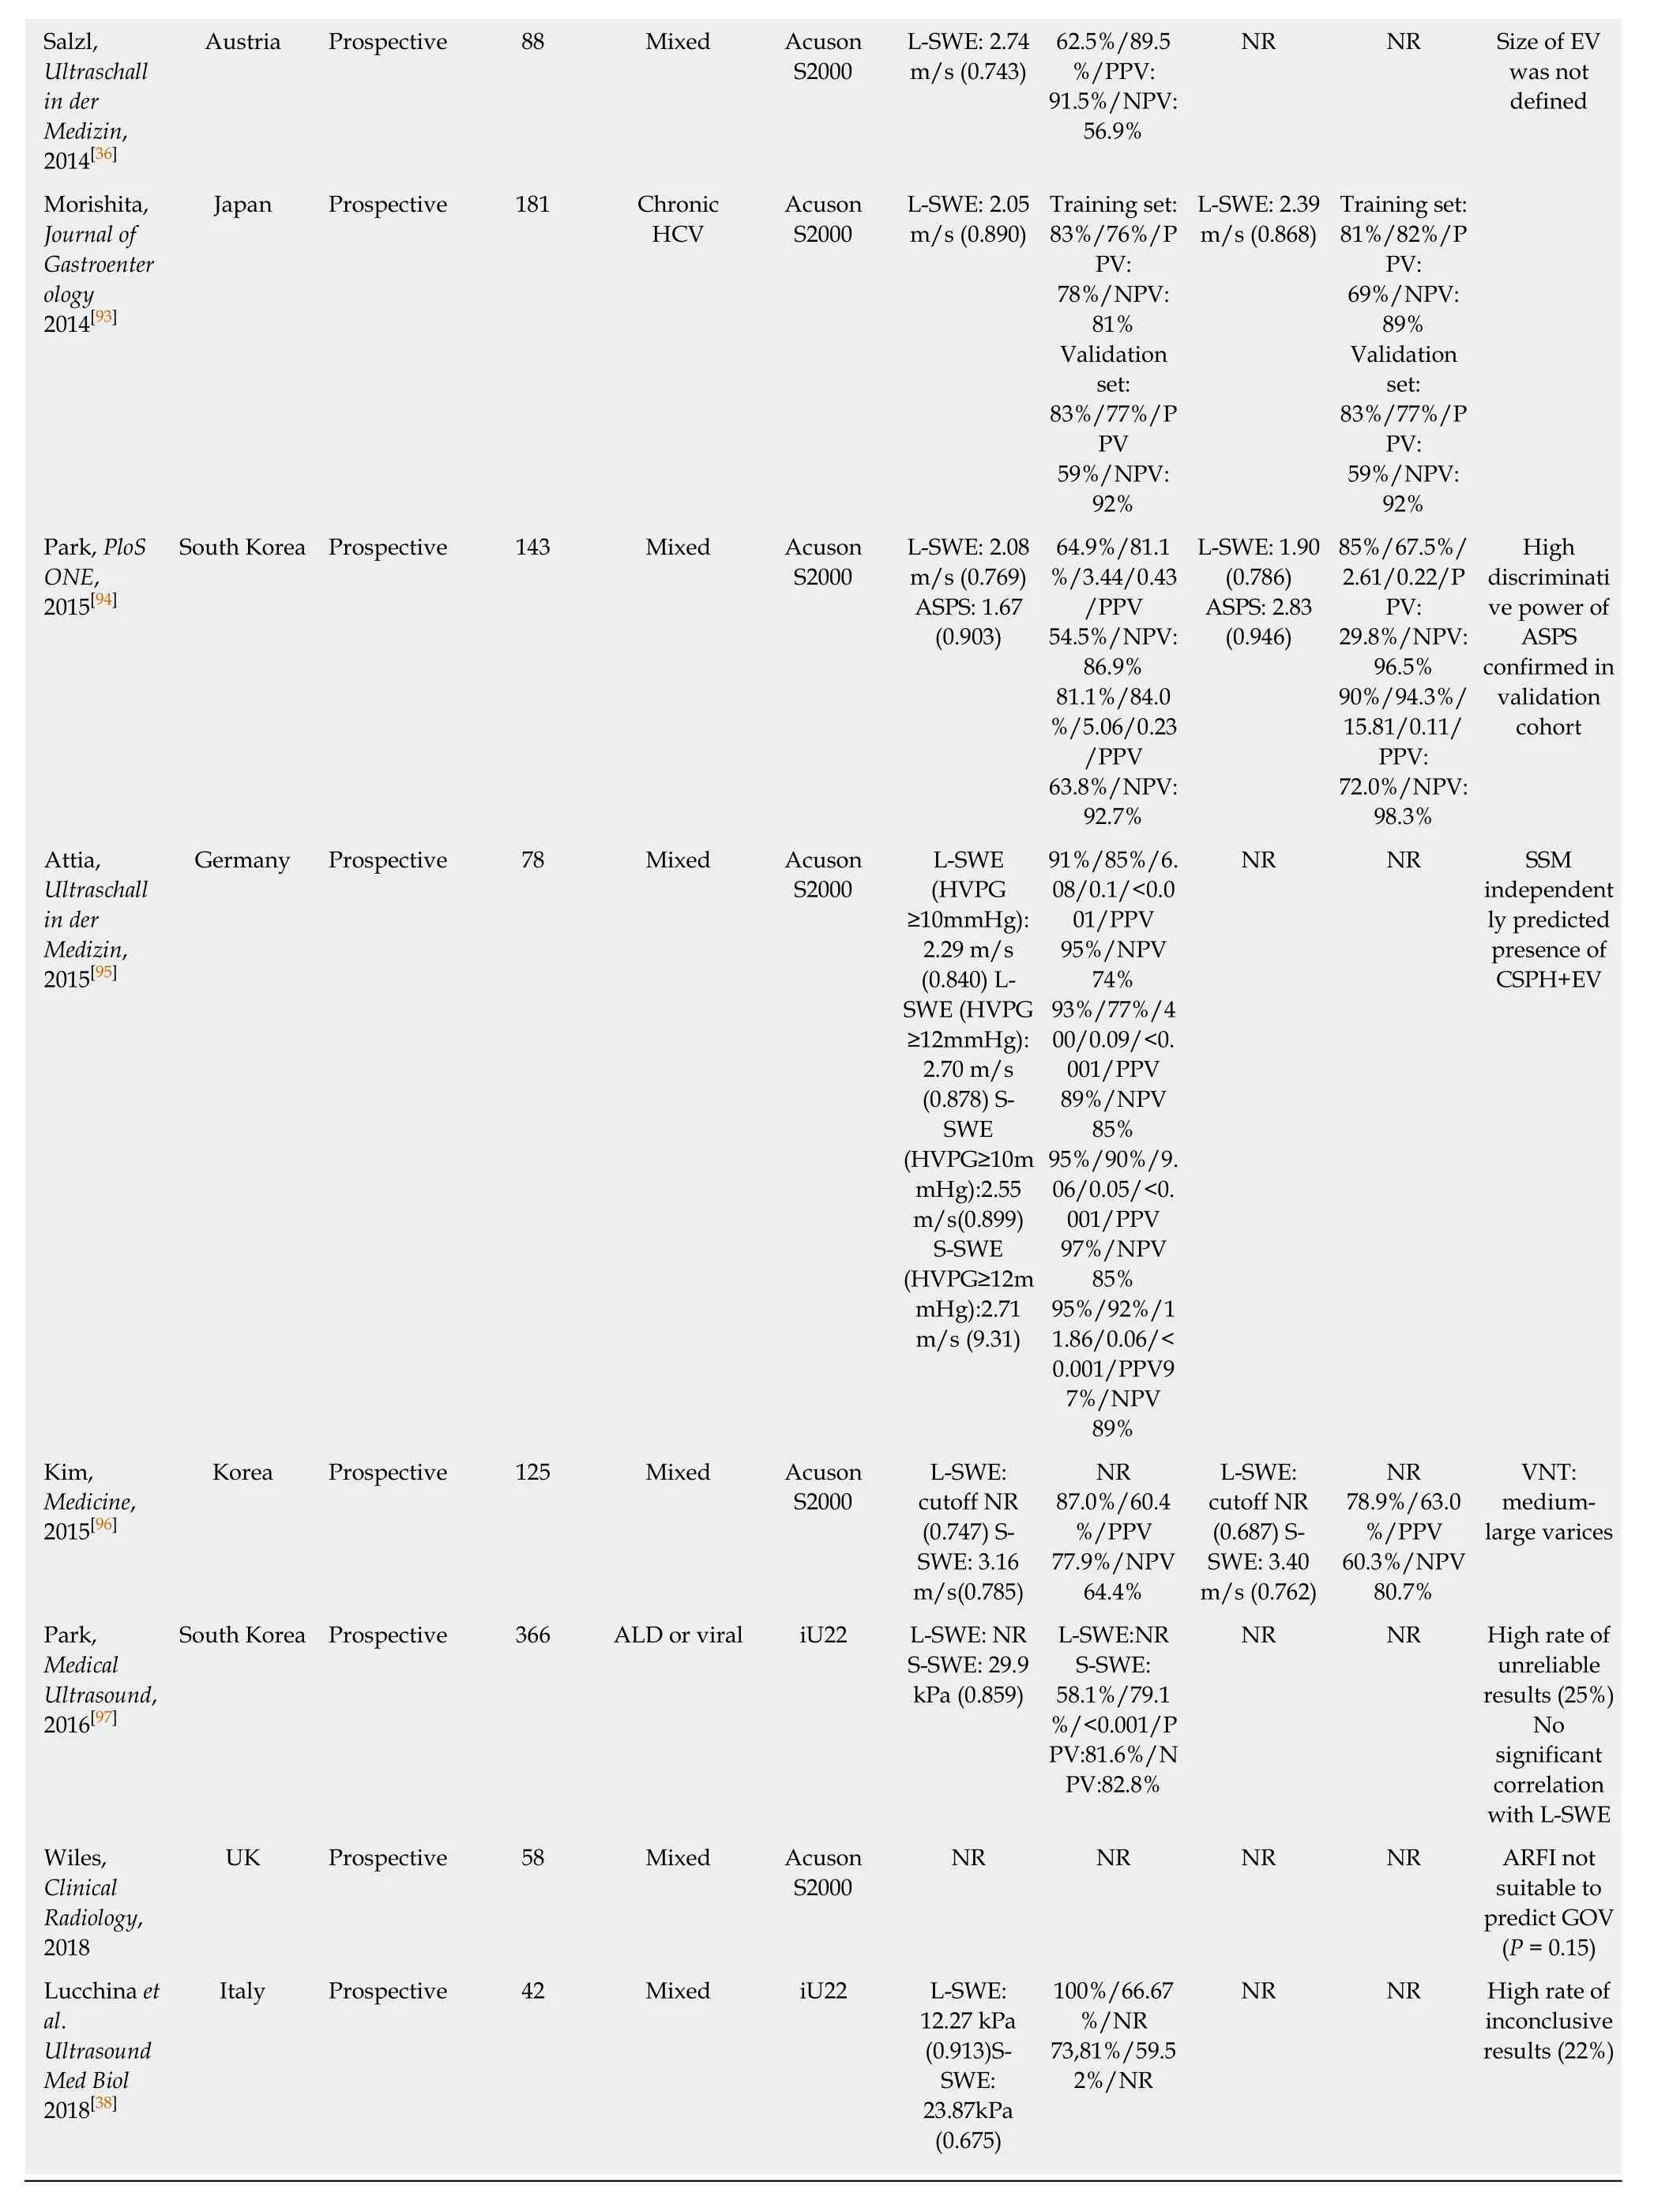
AUC: Area under the (receiver operating) curve; CSPH: Clinically significant portal hypertension; LSM: Liver stiffness measurement; L-SWE: Liver shear wave elastography esophageal varices; TE: Transient elastography; Plt: Platelet count; VNT: Varices needing treatment; Se: Sensitivity; SSM: Spleen stiffness measurement; Sp: Specificity; +LR: Positive likelihood ratio; -LR: Negative likelihood ratio; NR: Not reported; S-SWE: Spleen share wave elastography; ASPS: ARFI-spleen diameter to platelet ratio; ARFI: Acoustic radiation force impulse; PRED: Prediction of significant EV score.
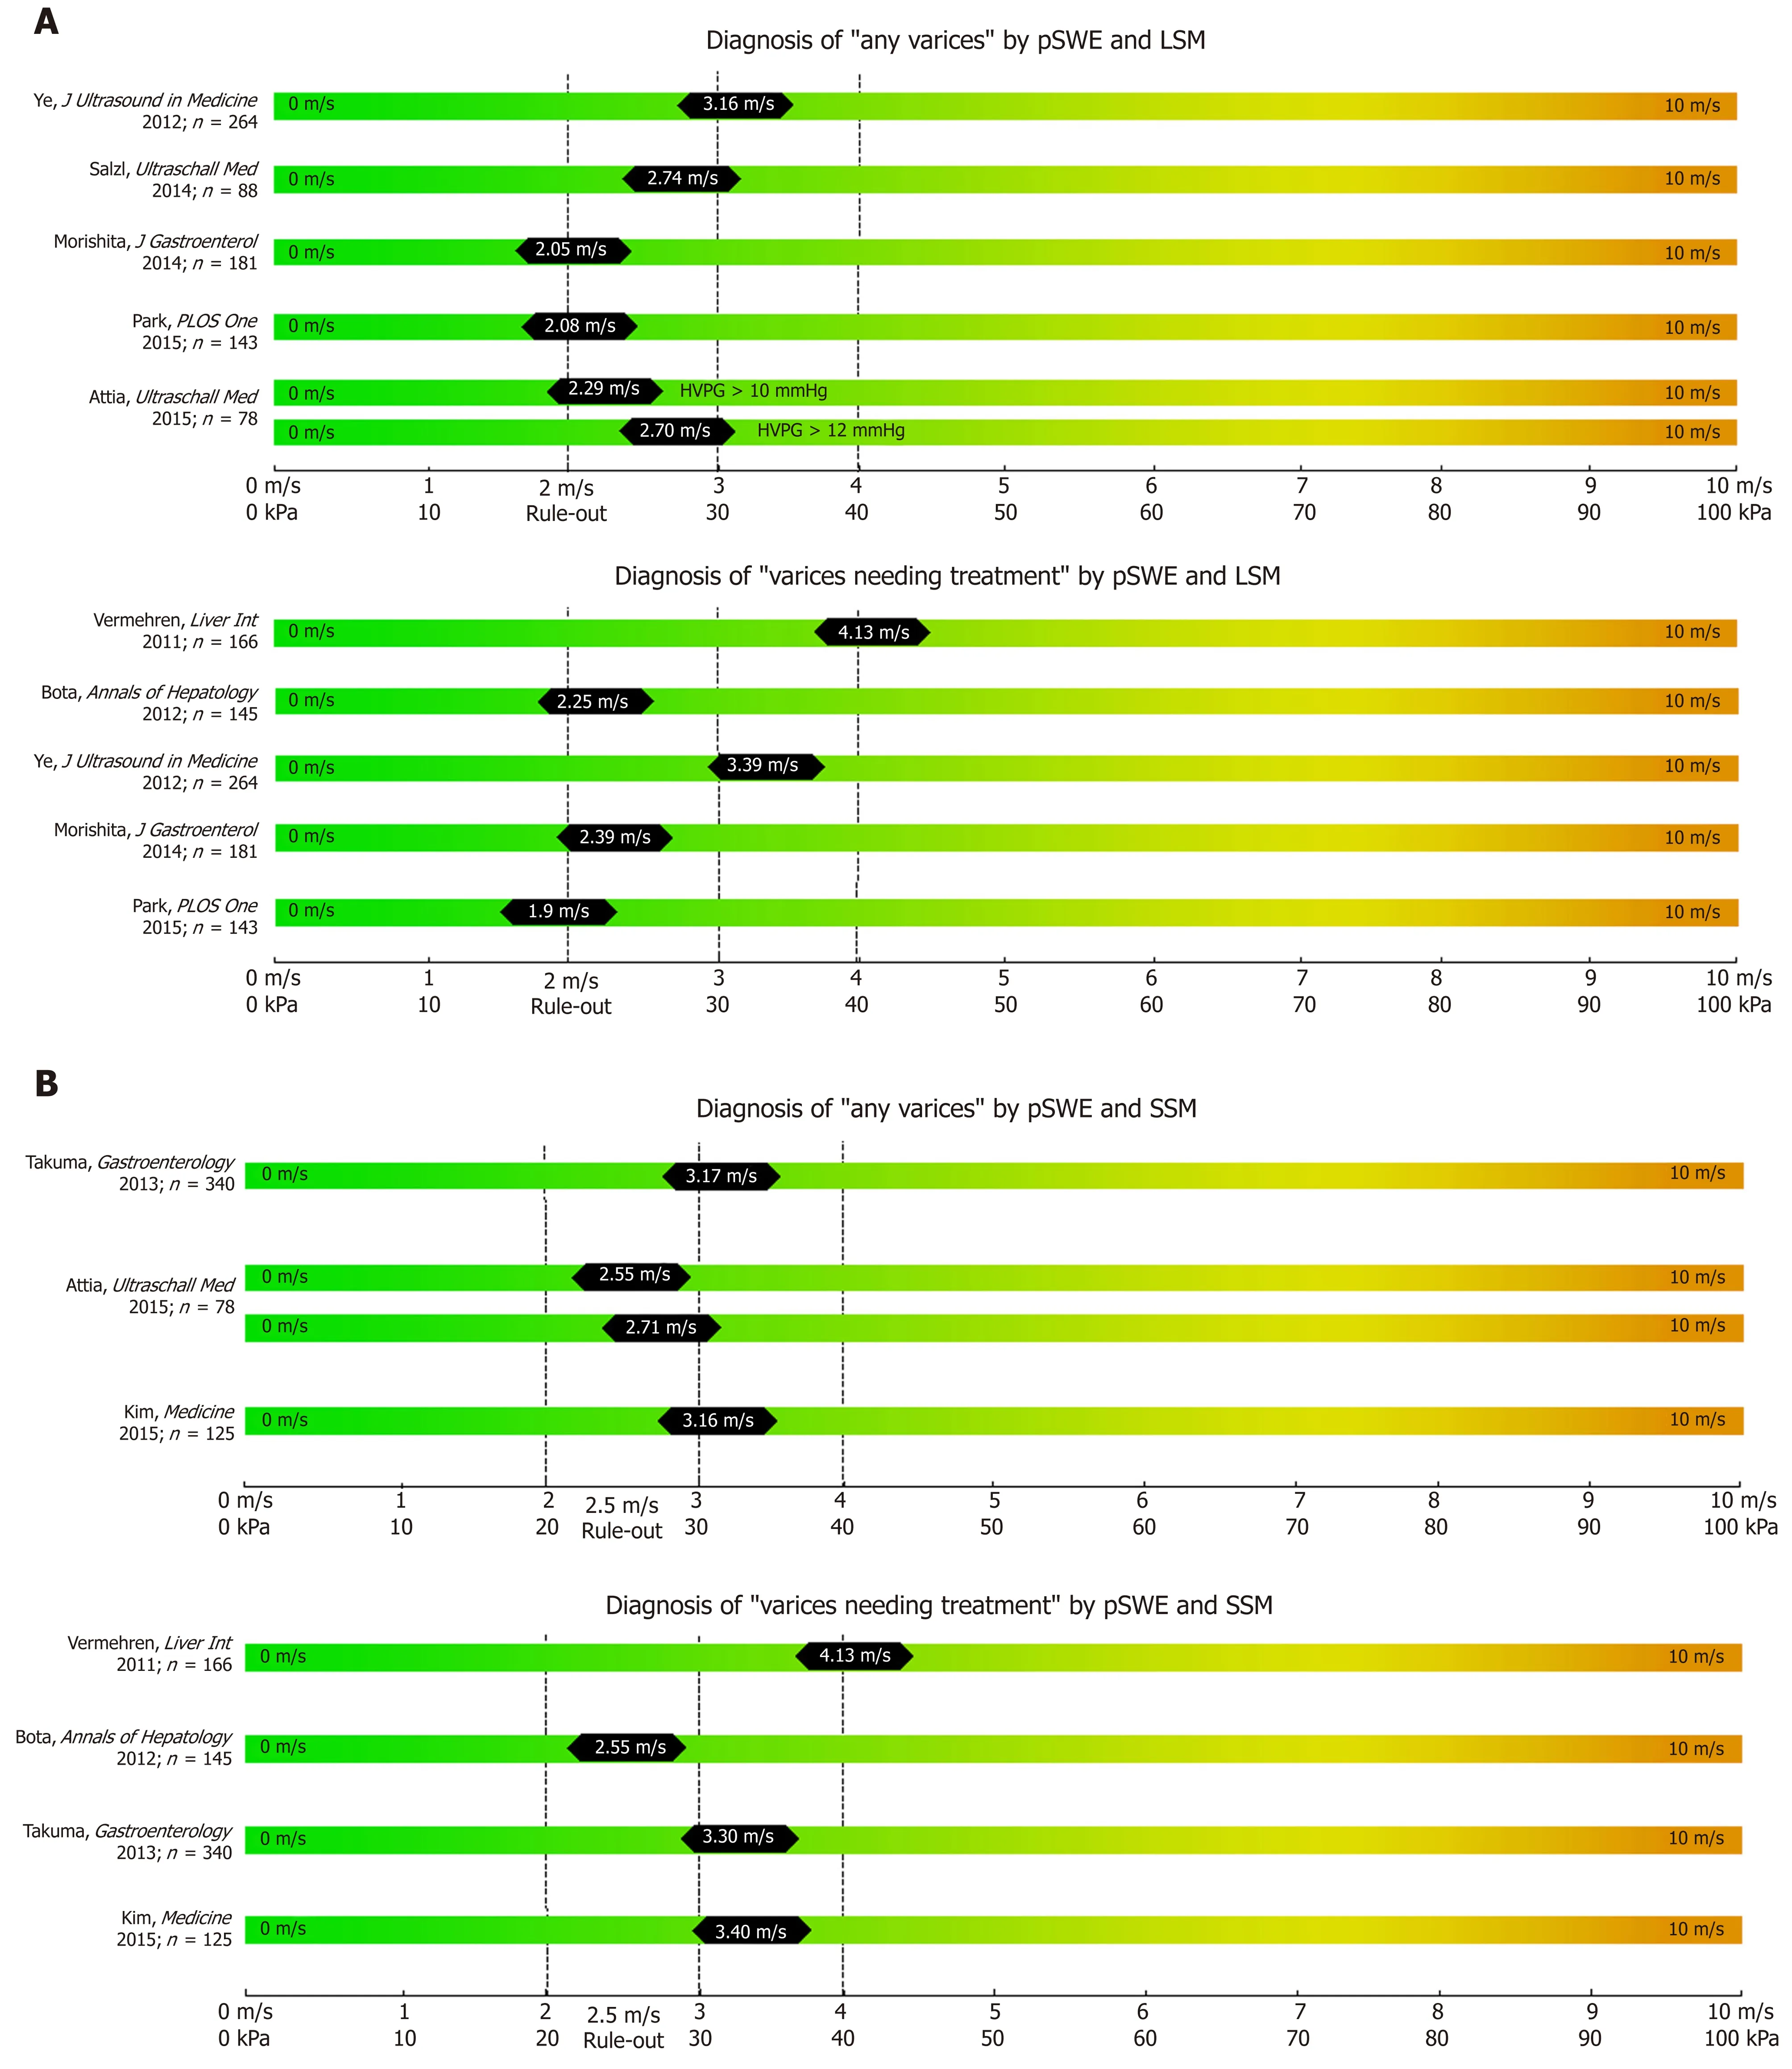
Figure 2 Summary of studies that reported point shear wave elastography derived cut-offs on the non-invasive diagnosis of any varices and varices needing treatment (A) using liver stiffness measurement and spleen stiffness measurement respectively (B).
Importantly, while TE-based elastography is a simple technique that can be performed by trained personal (e.g. nurses), while ultrasound-based pSWE (and 2DSWE) is critically dependent on the experience of the ultrasound operator[43]. In addition, the accuracy of pSWE-based assessment of LSM and SSM can be improved by following quality criteria[44].
In synopsis, pSWE has been widely evaluated for the prediction of EV, mostly through SSM. Nevertheless this technique might not be available everywhere, AUC of SSM vary and too few studies have been published about pSWE-LSM to predict presence of EV.
2D shear wave elastography
In contrast to pSWE , 2D-SWE uses two-dimensional measurement of shear wavespeed and multiple focal zones are measured[6]. Furthermore, real-time measurement -as displayed “on-screen” - is possible[10,35]. This enables the operator to analyze a larger amount of liver tissue in real-time and improves the applicability of elastography[10].Nevertheless, 2D-SWE has not yet been introduced into clinical routine and are limited to specialized centers and should be only performed by experienced operators[35]. Importantly, there are not established/accepted quality criteria for 2D-
SWE measurements for LSM and/or SSM[35].
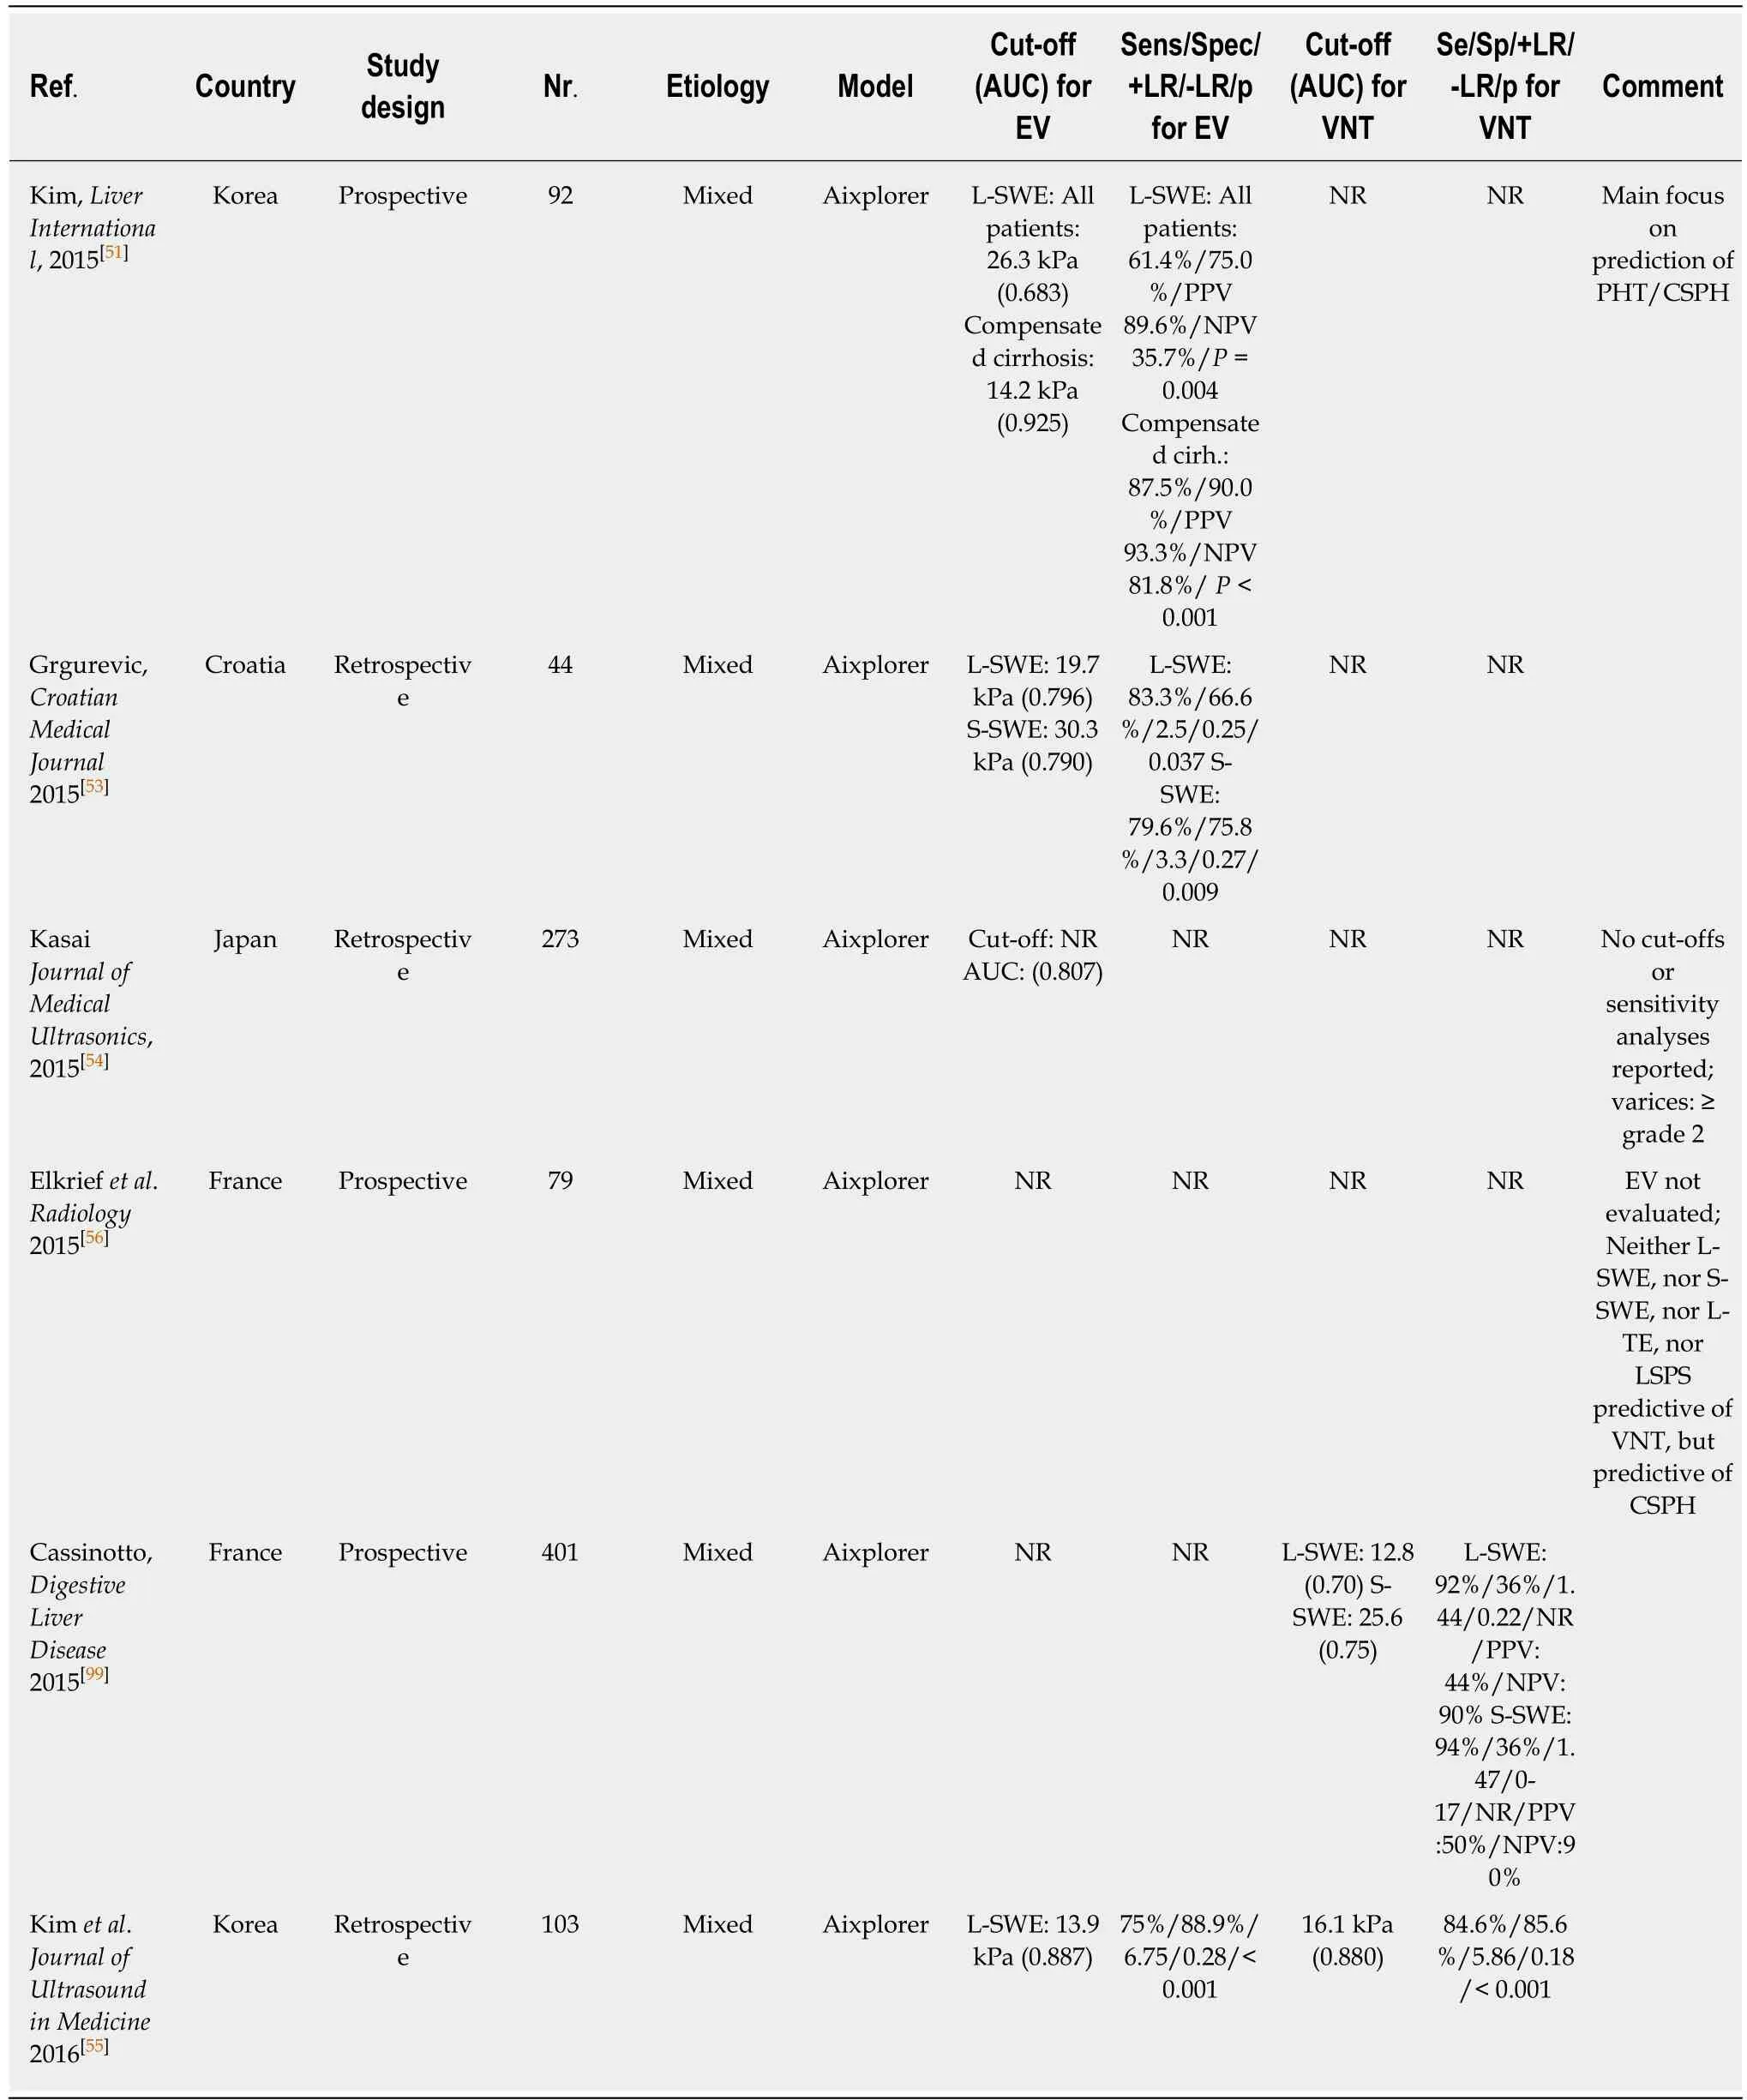
Table 3 Two-dimensional shear wave elastography for the prediction of varices
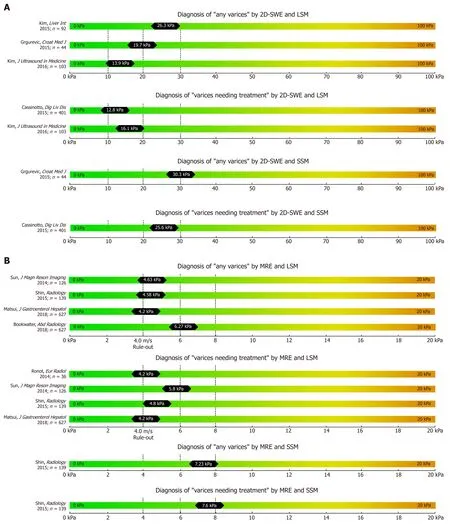
Figure 3 Summary of studies that reported two-dimensional shear wave elastography (A) and magnetic resonance elastography (B) derived cut-offs on the non-invasive diagnosis of any varices and varices needing treatment using liver stiffness measurement and spleen stiffness measurement respectively.
2D-SWE-based LSM has been validated as a valid tool for non-invasive assessment of fibrosis in several studies[45-48]. The reliability of 2D-SWE-based LSM measurements was significantly higher as compared to the widely established TE-based LSM[49]: The AUC for 2D-SWE-based LSM for prediction of F ≥ 2 (cut-off 8.03 kPa) and F4 (cut-off 13.1 kPa) were 0.832 and 0.915, respectively. Indeed, most recently, two meta-analysis on 2D-SWE including 1134 patient[48]and 746 patients[50]have been published that both reported superior accuracy to detect significant fibrosis or cirrhosis using 2DSWE as compared to TE.
Kim et al[51]evaluated 2D-SWE for the prediction of CSPH and reported an AUC of0.819 at a 2D-SWE LSM cut-off of 15.2 kPa in 115 cirrhotic patients undergoing
measurement of portal pressure by hepatic venous pressure gradient (HVPG).Importantly, a recent meta-analysis by Suh[50]showed an excellent diagnostic performance of 2D-SWE for predicting the presence of CSPH with sensitivity and specificity around 85%[50].
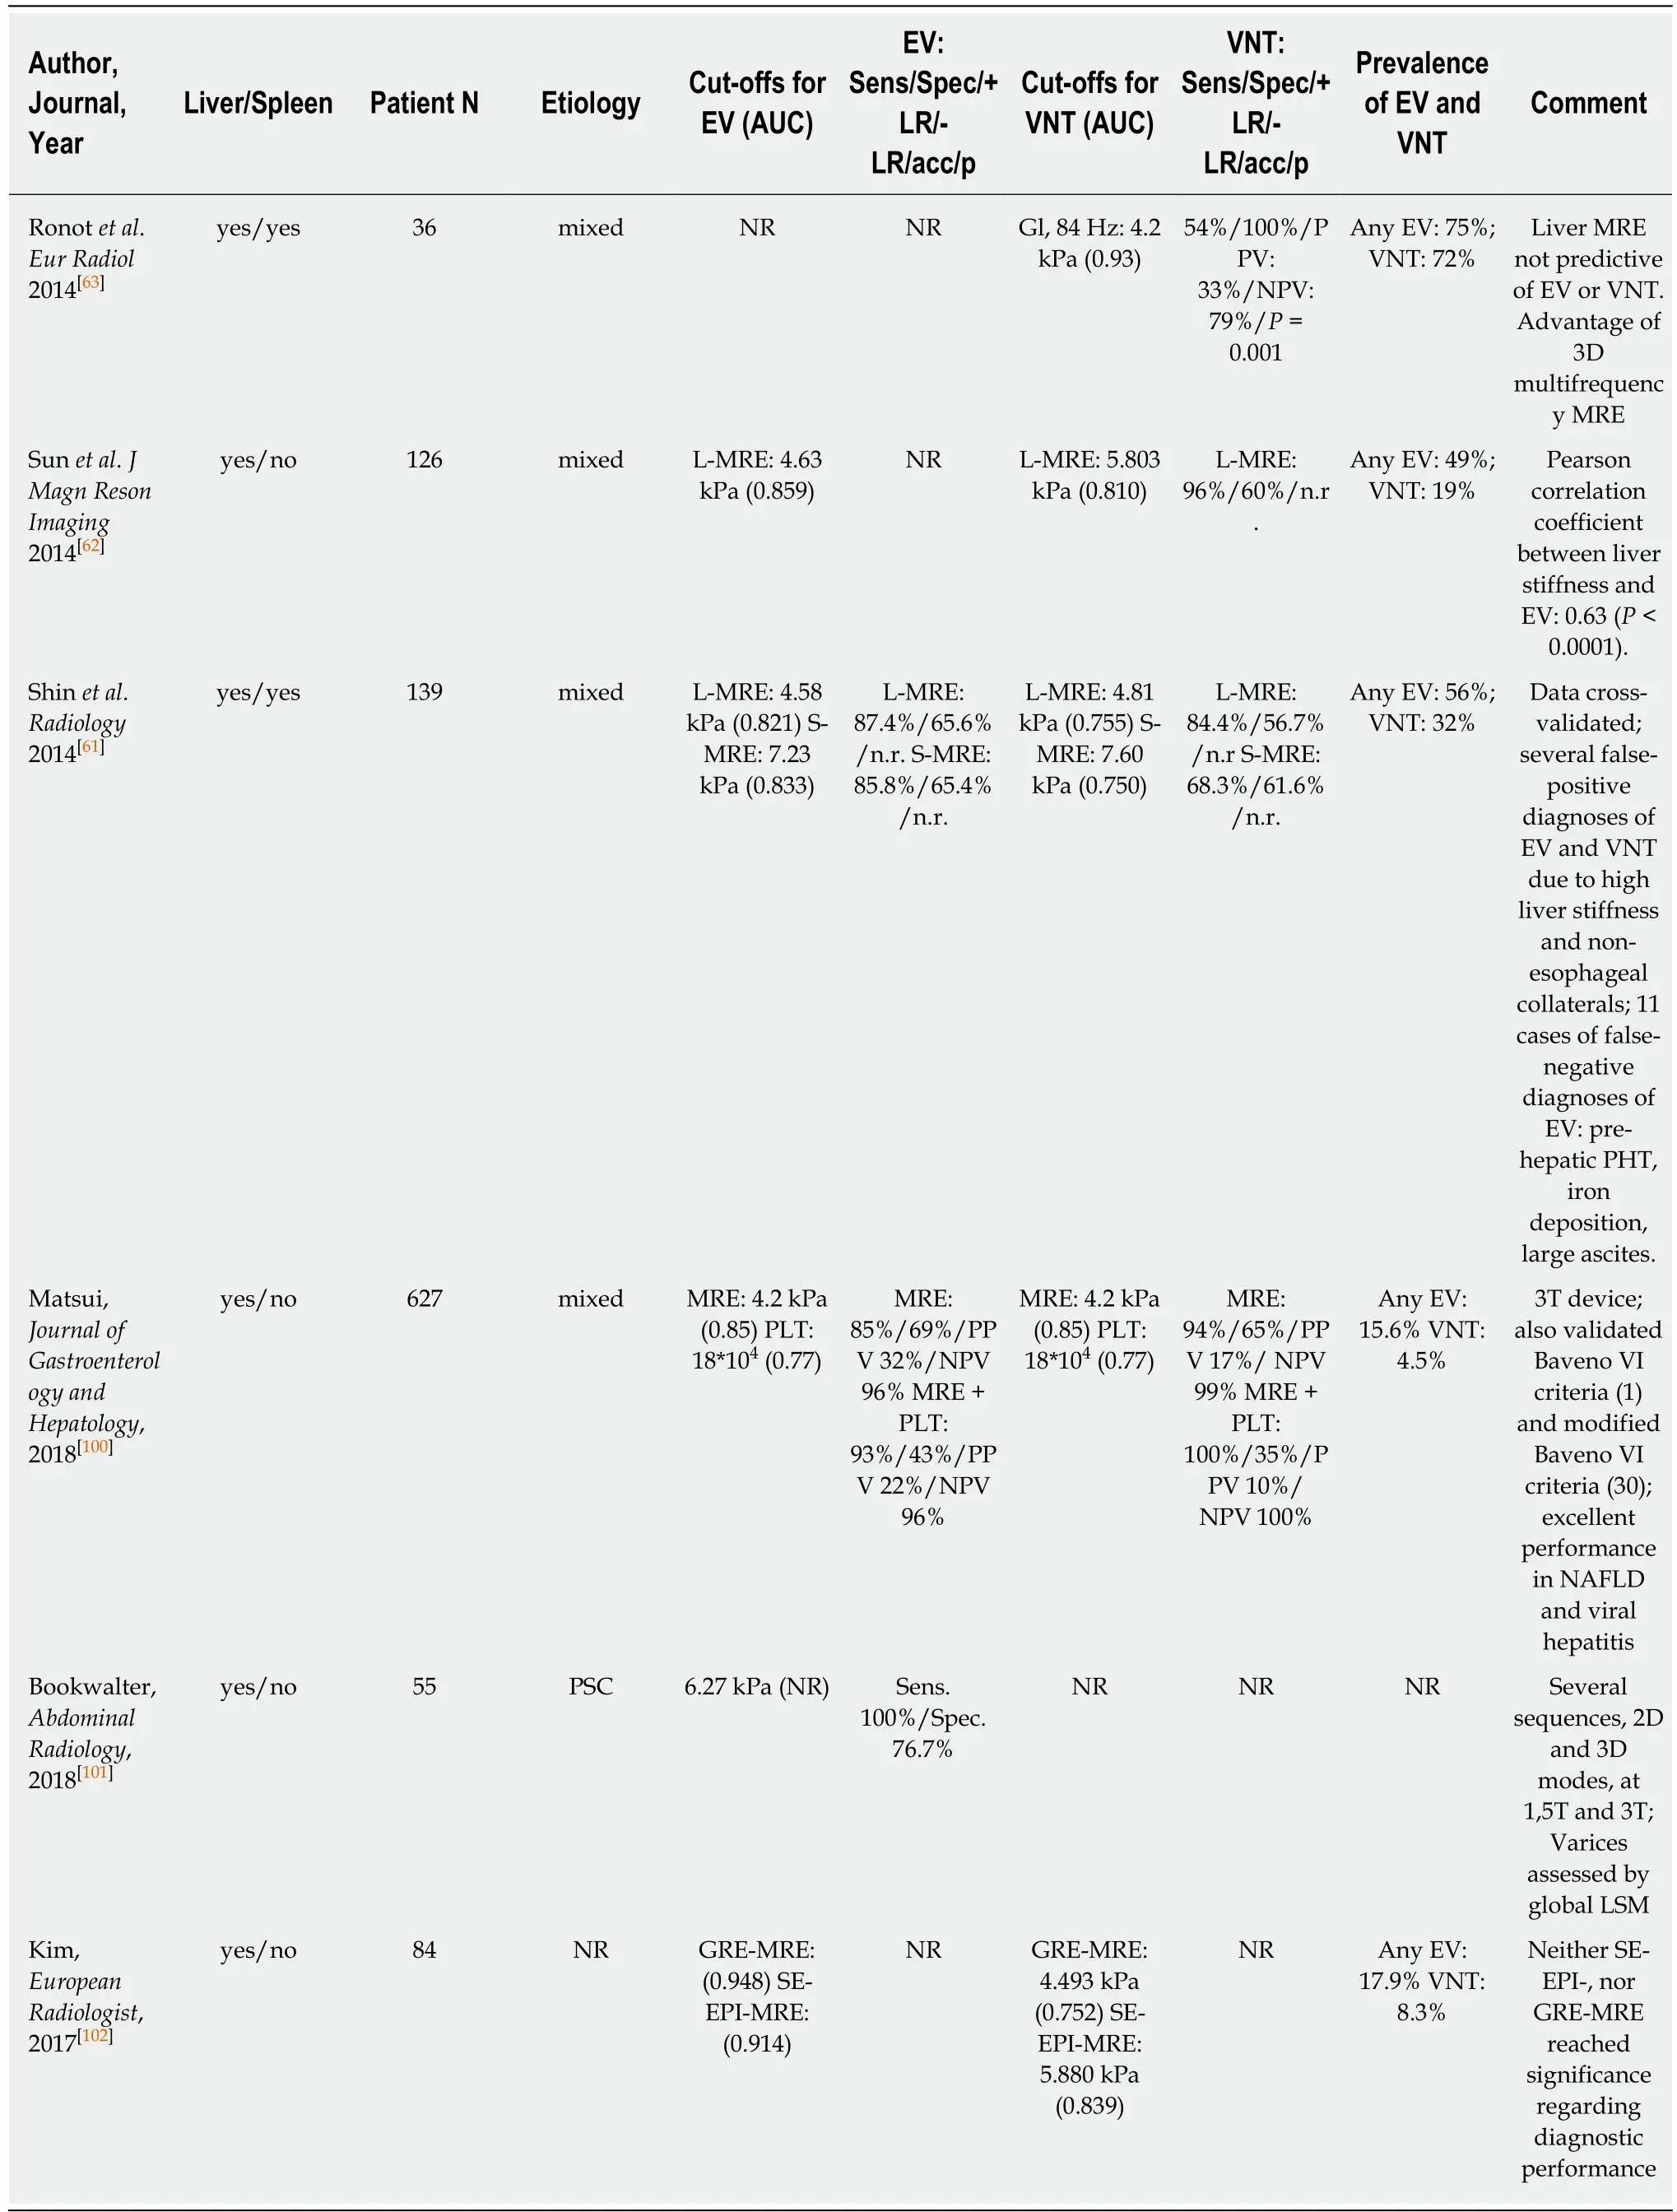
Table 4 Magnetic resonance elastography for prediction of varices
Studies reporting on the performance of 2D-SWE based non-invasive screening for EV are scarce. In a large prospective study investigating 2D-SWE-based liver (L-SWE)and spleen (S-SWE) for the diagnosis of CSPH yielded an AUC of 0.861 for L-SWE(24.6 kPa) and of 0.837 for S-SWE (26.3 kPa), respectively[52].
A Croatian study reported a cut-off of 19.7 for L-SWE (AUC 0.796) and 30.3 kPa for S-SWE (AUC 0.790) for the prediction of any EV in a cohort of 44 patients with cACLD[53]. Kasai et al[54]found significantly higher L-SWE values in 16 patients with EV than in 257 patients without EV, with similar AUC of 0.807. In a retrospective cohort of 103 cACLD patients 2D-SWE of L-SWE yielded an AUC of 0.887 (cut-off 13.9 kPa) for any EV and 0.880 (cut-off 16.1 kPa) for VNT[55]. Interestingly, a prospective study published in 2015 including 79 patients found no difference between LSM and SSM values (measured by 2D-SWE and by TE respectively) between patients with VNT and patients without VNT[56]. The resulting AUCs of 2D-SWE for detection of VNT were consequently unacceptably low with an AUC of 0.600 for L-SWE and an AUC of 0.580 for S-SWE, respectively[56].
In conclusion, while there is strong evidence for the value of 2D-SWE-based LSM for fibrosis assessment, studies on the value of 2D-SWE based LSM and SSM for the screening of EVs are limited. Larger studies using 2D-SWE-based liver and spleen stiffness measurement for the assessment of patients with cACLD are needed to establish its value for the prediction of any EV and of VNTs in daily clinical practice.
Magnetic resonance elastography
Several studies have been already been published on the correlation of MRE with liver fibrosis and found high diagnostic accuracies (> 90%) for the diagnosis of advanced fibrosis and cirrhosis[10,57,58]. Most recently, few studies on the value of MRE for the prediction of EV have been published with data on both liver MRE (L-MRE)and spleen MRE (S-MRE). Major advantages of MRE are its capability to evaluate the whole liver three-dimensionally (3D-SWE) and its excellent diagnostic accuracy for staging fibrosis[10]. Furthermore, failure rate is low and was reported to be mostly due to physical “non-fitting” into the MR device, claustrophobia or low hepatic signal related to iron overload[10,59]. Importantly, MRE shows excellent inter-observer and intra-observer agreement[60]. The main limitations of MRE include its high costs,limited availability and the need for specialized infrastructure and equipment. Shin et al[61]reported MRE data on 139 cirrhotic patients: Any EV were predicted by an LMRE cut-off at 4.58 kPa (AUC 0.821) and by an S-MRE cut-off at 7.23 kPa (AUC 0.833).Furthermore, VNT were predicted by an L-MRE cut-off at 4.81 kPa (AUC 0.755) and a S-MRE cut-off at 7.6 kPa (AUC: 0.750).
In a South-Korean cohort of 126 patients[62], L-MRE cut offs were 4.63 kPa (AUC 0.859) for any EV, and 5.8 kPa (AUC 0.81) for VNT, respectively. Finally, Ronot et al[63]reported data on a small cohort of 36 patients and found 4.2 kPa (AUC 0.93) as an optimal cut-off for ruling out VNT (PPV 33%, NPV 79%).
Despite these promising results of MRE-based LSM and SSM for predicting any EV or VNT, more prospective studies are needed before implementing MRE for the noninvasive screening of EV/VNT in clinical practice. Furthermore, the feasibility of MRE is limited due to its inherent high costs, long examination times and considerable need for radiological expertise. Considering the limited data on MRE-based screening for EV/VNTs, as of now TE, pSWE and 2D-SWE are likely the first choice for screening of EV/VNTs in clinical practice - given their wider availability and lower costs.
CONCLUSION
In this review we summarized the current knowledge on elastography-based methods for the non-invasive prediction of any EVs and VNTs in adult patients with advanced chronic liver disease.
TE is an easy to use device with good applicability and well-trained nursing staff can usually perform LSM after training. Nevertheless the area of TE-based LSM is small and values can be significantly altered or even impossible to obtain in patients with obesity or ascites. Importantly, the combined TE-based LSM < 20 kPa plus PLT >150 G/L has become a widely accepted non-invasive algorithm for ruling out VNTs[1,5]
Following TE-based LSM, pSWE and 2D-SWE have been developed as novel ultrasound-based elastography methods. Importantly, next to LSM also SSM - mostly by pSWE and 2D-SWE have been additionally introduced as a valuable screening tool for EV/VNTs. Both pSWE and 2D-SWE methods have the benefit of “seeing what you measure”, given the integration of the technique in standard ultrasound machines.However, the operator performing pSWE and 2D-SWE needs to be well-trained in ultrasound sonography and quality criteria for valid LSM and SSM have to be rigorously followed. Nevertheless there are some potential limiting factors that may hamper interpretation of results irrespective of operators experience and elastography method. It is known that in states of chronic inflammation such as viral hepatitis[64,65],autoimmune hepatitis[66]and alcoholic steatohepatitis[67]and in cases of acute liver damage[68]liver stiffness can be false positively increased. Furthermore increased LSM has also been described due to mechanical cholestasis[69]. Lastly hepatic congestion due congestive heart failure[70,71]and Budd-Chiari syndrome[72,73]thus generally speaking through increased venous pressure[74]is also known to increase elastography-based LSM values[75]. In a recent review by Lemmer et al[75]non-invasive methods to diagnose fibrosis in patients with congestive hepatopathy were discussed and conclusions were quite disillusioning since only very limited data exists. In a study that evaluated LSM in 32 patients with valvular heart disease that underwent valve operation, LSM was found to be consistently higher than in the control group,even though none of the participants were found with evidence of underlying chronic liver disease[76]. Furthermore LSM at baseline was significantly positively correlated with NT-proBNP, and central venous pressure during the operation and negatively with left ventricular ejection fraction[76]. Ninety days after surgery LSM values significantly decreased compared to 7 d after surgery (8.4 kPa vs 6.0 kPa, P = 0.026).On the other hand a study evaluating MRE-LSM and -SSM in congestive hepatopathy found promising results and reported significant correlation of LSM (r = 0.74, P =0.02) and SSM (r = 0.97, P = 0.002) with fibrosis stage, although liver biopsy results were only available in 8 patients[77]. Therefore, given the potential pitfalls, we suggest that irrespective of the elastography method used, clinical signs of chronic liver disease, laboratory data and other co-morbidities should always be taken into account when performing LSM or SSM respectively.
Our extensive literature search revealed significant discrepancies between published LSM and SSM cut-offs using pSWE and 2D-SWE for EV/VNT screening.The absence of generally-accepted quality criteria for pSWE and 2D-SWE remains and validated cut-offs for ruling-in/out EVs/VNTs calls for further research on the clinical applicability of pSWE and 2D-SWE for the screening of EVs/VNTs. Moreover,presence of esophageal varices may be relied on cofounding factors, other than liver stiffness. Most recently, patients with large or even small portosystemic shunting were found to have an increased prevelance of esophageal varices[78], and although grade of portosystemic shunting was related to liver dysfunction, varices might be missed by transient elastography in those cases. Interestingly patients with preserved liver function (defined as MELD 6-9 or Child Pugh Stage A) and portosystemic shunting showed higher HVPG values and were found with significantly more portal hypertension related complications such as bleeding or ascites than in those without shunting[78]and this emphasizes even more that especially in those patients, where LSM might be low, esophageal varices might be missed. Furthermore, in the era of successful and highly efficient treatment of hepatitis C, nowadays quite a lot of cirrhotic patients present without the initial trigger for their underlying liver disease and it has been shown that directly acting antivirals significantly lower portal pressure[79]. Concerning this matter, no study has up to date evaluated applicability of elastography-based methods to predict esophageal varices in this cohort, and therefore it is not known whether published cut-offs work in this large subgroup of patients.
More recently, MRE-based LSM has been introduced as a very accurate method to stage liver fibrosis and with concomitant MRE-based LSM and SSM yielding excellent performance for non-invasive diagnosis of EV/VNTs. Consequently, MRE seems to be a highly accurate screening method for EVs/VNTs, however, studies are scarce and further evidence is needed.
In conclusion a vast amount of studies on the diagnostic performance of elastography-based methods for the presence of EV/VNTs have been published,mostly reporting data on TE. Both pSWE and 2D-SWE-based LSM and SSM represent promising tools for EV/VNT screening but further clinical studies and evaluation of specific cut-offs are required. MRE-based LSM and SSM-based screening of EV/VNT holds promise but is limited by its high costs. At the moment we strongly recommend to use the combined TE-LSM < 20 kPa and PLT > 150 G/L algorithm to rule-out VNTs. Considering the promising data on SSM and the ability of SSM to capture presinusoidal/pre-hepatic components of CSPH, we strongly encourage further research on SSM for screening of CSPH and EV/VNTs. Finally, we have summarized the currently available data and published cut-offs for EV/VNT prediction by TE, pSWE,2D-SWE and MRE on scale-cards for clinical practice.
杂志排行
World Journal of Gastroenterology的其它文章
- Do patients with gastroesophageal reflux disease and somatoform tendencies benefit from antireflux surgery?
- Differential hepatic features presenting in Wilson disease-associated cirrhosis and hepatitis B-associated cirrhosis
- Predicting gastroesophageal varices through spleen magnetic resonance elastography in pediatric liver fibrosis
- Incidence and treatment of mediastinal leakage after esophagectomy: Insights from the multicenter study on mediastinal leaks
- Effects of positive acceleration (+Gz stress) on liver enzymes,energy metabolism, and liver histology in rats
- NKX6.3 protects against gastric mucosal atrophy by downregulating β-amyloid production
