Selective Hydrogenation of Butyne-1,4-diol to Butane-1,4-diol over Ni/Al2O3-SiO2 Catalysts
2019-01-18FangJieZhuangChangjianMengJipengChengLangLuJiangyin
Fang Jie; Zhuang Changjian; Meng Jipeng; Cheng Lang; Lu Jiangyin
(Key Laboratory of Oil & Gas Fine Chemicals, Ministry of Education, College of Chemistry and Chemical Engineering, Xinjiang University, Urumqi 830046)
Abstract: Ni/Al2O3-SiO2 catalysts were synthesized via one-step method employing SiO2 as an additive for the selective hydrogenation of butyne-1,4-diol (B3D) to butane-1,4-diol (B1D). The prepared catalysts were evaluated by a series of characterization techniques including BET, XRD, SEM, EDX-mapping, TEM, H2-TPR, XPS, NH3-TPD and Py-FTIR. Compared to Ni/Al2O3 catalyst, the SiO2-doped samples exhibited better B3D conversion. SiO2 could help to form a strong interaction between NiO with the support, which inhibited Ni agglomeration at high temperature, improved the Ni dispersion, and enhanced the hydrogenation activity. B1D selectivity was mainly influenced by the quantity of Lewis acid sites in addition to the Ni dispersion. The catalyst with a silica loading of 6.4% demonstrated an excellent selectivity of 75.18% (by 13% higher than the contrastive Ni/Al2O3 catalyst), which was attributed to the larger amount of Lewis acid sites and the moderate interaction between NiO with the support, which could facilitate the nickel dispersion on a preferable surface area of 176.3 m2/g of support.
Key words: Ni/Al2O3-SiO2 catalysts; butyne-1,4-diol; butane-1,4-diol; hydrogenation
1 Introduction
Butane-1,4-diol (B1D) is an important intermediate with respect to its application in the manufacture of high valueadded fine chemicals, such as 3-buten-1-ol,N-methyl pyrolidone, poly (butylene succinate), polybutylene and polyurethane polymers[1-3]. In general, the manufacture of B1D is based on the Reppe process, which involves the catalytic reaction of formaldehyde with acetylene followed by a subsequent stage of hydrogenation of the resultant butyne-1,4-diol (B3D)[4]. The detailed reaction pathway of the hydrogenation of B3D is exhibited in Scheme 1[5-6]. Additionally, the predominant processes for the hydrogenation of B3D suffer from high temperature and high pressure. The side products and residues can severely affect the efficiency of the process. As such, more effective catalytic materials with higher B1D selectivity under mild conditions are requested for the hydrogenation of B3D.
Traditionally, the reaction of B3D hydrogenation has been conducted on noble metal catalysts and Ni-based catalysts[7-8]. The supported nickel catalysts have received more extensive attention due to their easy availability and reasonable cost compared to noble metals[9-10]. The study of SiO2-Al2O3composite oxide materials had been one of the important researches in material science f ields, which were widely applied in the chemical industry[11-12], electronic equipment[13], optical communication[14], etc. As for being employed as a support for the supported metal catalysts, the SiO2-Al2O3exhibits large specific surface area for improving the dispersity of active metallic sites and the controllable pore size distribution for the shape-selective reaction. Besides, the SiO2-Al2O3support could act as versatile catalyst under the synergism with surface Brönsted or Lewis acid sites to improve the catalytic performance and the product selectivity, which had been extensively reported in hydroisomerization[15], nitrosation[16], and olef in reactions[17]. Also, the dopant SiO2exhibited superior hydrothermal stability in nickel catalysts obtained from the studies[18-21]. Li, et al.[18]revealed that the catalyst 60%Ni/AlSiO4with an Al2O3/SiO2mass ratio of 4 in the substrate exhibited favorable hydrothermal stability owing to its stable structure and highly dispersed supported nickel particles. Kang, et al.[19]further revealed that the catalyst with 3% of Si content showed an excellent hydrothermal stability. Besides, the effect of surface acidity[20]and the calcination temperatures[21]on SiO2-Al2O3support for Ni/γ-Al2O3catalysts was also researched. By now, there is no research work dealing with the study of the influence of Ni/Al2O3-SiO2catalyst on the selectivity of B1D in the liquid phase B3D hydrogenation reaction.

Scheme 1 Reaction pathway for the hydrogenation of B3D
This study would explore the correlation between the Ni/Al2O3-SiO2characterization and the catalytic behavior in the hydrogenation of B3D. The physicochemical properties of the catalysts were evaluated using a series of techniques. The liquid-phase products were analyzed to provide useful information on the industrial development and application of catalysts in the hydrogenation of B3D.
2 Experimental
2.1 Materials
Nickel nitrate hexahydrate (≥98.0%) and γ-Al2O3powder were purchased from the Fuchen Chemical Reagent Factory, Tianjin, and the Sinopharm Chemical Reagent Co., Ltd., Shanghai, respectively. The tetraethyl orthosilicate (with a SiO2content of ≥28.0%) was obtained from the Yongsheng Fine Chemical Co., Ltd., Tianjin. Before using, γ-Al2O3powder was dried at 120 °C for 3 h to remove the adsorbed water. The crude B3D aqueous solution (containing 35.0% of B3D, 60.0% of water, and 5.0% of other impurities) was provided by the Blue Ridge Tunhe Chemical Industry Joint Stock Co., Ltd., Xinjiang. All chemicals were used without further purification.
2.2 Catalyst preparation
Ni/Al2O3-SiO2catalysts were prepared via the one-step procedure. Tetraethyl orthosilicate solution at various concentrations was prepared by dissolving in ethanol, followed by mixing and stirring with Ni2+aqueous solution in order to obtain a theoretical Ni loading of 17%. Subsequently, the commercial γ-Al2O3powder with adjusted content was immersed in the mixed solution. The hydrated precursors, obtained after impregnation, were dried at 80 °C and calcined in air at 450 °C for 3 h. The resultant samples were designated as NASx(x=0, 3.4, 6.4, 9.4, and 12.4), withxdenoting the silica loading.
2.3 Catalyst characterization
The surfacearea(SBET) and pore volume(Vp) of the reduced NASx catalysts wereobtained by N2adsorptiondesorption isotherms recorded by an ASAP2020 absorber (Micromeritics Builder Tech., Ltd.,America). TheSBETvalues were calculatedusing the Brunauer-Emmett-Tellerequation.
Crystalline phases of the catalysts were acquired by the X-ray powder diffraction (XRD) usingaM18XHF22-SRA X-ray diffraction instrument(MacScienc, Japan)operated with Cu-Kα radiation. The mean size of nickelcrystallites was determined from the broadening of theNi (200), according to the Scherrer-Warren equation.
A scanning electron microscope (SEM) (Hitachi S-4300) was used to scan the surface of NASx samples. Energy dispersive X-ray spectroscopy (EDX) was performed using an EDX3600BX fluorescence analyzer (Sktray Instrument Co., Ltd., Jiangsu, China). The elemental mapping was conducted under STEM mode with the EDX detector serving as the recorder.
The transmission electron microscopy (TEM) technique was processed using a Tecnai G220 S-twin transmission electron microscope (FEI, America) equipped with a thermionic LaB6 electron source and operated at a primary electron energy of 100 kV.
The temperature-programmed reduction (H2-TPR) and temperature-programmed desorption of ammonia (NH3-TPD) measurements were performed on a XQ TP-5080 automatic dynamic adsorption instrument (Tianjin Xianquan Instrument Co., Ltd., China). The corresponding fitting curves of H2-TPR were implemented by the Peakf it software.
The X-ray photoelectron spectroscopy (XPS) technique was performed using an ESCALAB 250Xi photoelectron spectrometer (Thermo Fisher Scientific, America) equipped with an Al Kα monochromatic X-ray radiation (hν=1 486.6 eV). To determine the peak areas and positions, the deconvolution of the Ni2p spectra into the Gaussian component peaks was performed using the software XPS Peak.
The IR spectra of adsorbed pyridine were collected on a MAGNA-ir 560 FTIR spectrometer (Nicolet Co., US). The amount of Brönsted acid sites and Lewis acid sites can be calculated using IMEC (B) = 1.67 cm/μmol, and IMEC (L) = 2.22 cm/μmol.
2.4 Test for catalytic performance
Catalytic performance was carried out in a stainless steel reactor using catalysts with a particle size of 40-60 mesh under conditions covering a temperature of 120 °C, a pressure of 4 MPa, and a rotary speed of 500 r/min. Before testing, catalysts were reduced in flowing hydrogen at 450 °C for 3 h. The resultants were analyzed by a gas chromatograph (GC-2014C Shimadzu, China) equipped with a SH-Rtx-Wax capillary column (30 m in length×0.25 mm in I.D.×0.25 μm in f ilm thickness) and a flame ionization detector, and the quantitative method was calibrated against 1,3-propanediol used as an internal standard. The response factors were determined for B3D, B2D, B1D, HBD, and other hydrogenated products (n-butyraldehyde andn-butanol).
3 Results and Discussion
3.1 Catalyst characterization
The textural properties of the NASx catalysts are shown in Figure 1 and Table 1. In Figure 1 (a), all samples exhibited the IV-type isotherms with an H3 hysteresis loop according to the IUPAC classification[22], which were characteristics of mesopores[23]. The corresponding pore size distribution of the NASx catalysts is given in Figure 1 (b). It can be seen from Figure 1 (b) that the pore sizes of all the samples were mainly located in the range of 5—20 nm. With the increase in silica loading, the main broad peak in the NAS0 sample became less broad in the silicadoped samples, which implied the smaller pores in the silica-added catalysts.
The textural properties of NASx catalysts are summarized in Table 1. The BET surface areas of the catalysts increased with an increasing SiO2content. The specific surface areas were increased significantly from 144 cm2/g to 182.6 cm2/g when the silica content increased. In comparison with the pristine NAS0, all the silicacontaining samples showed higher specific surface area, indicating that the incorporation of SiO2contributed to the increase in specific surface area, which was in agreement with the literature[24]. The smaller size pores could be responsible for the increase in specific surface area and the reduction in average pore size.
Figure 2 presents the XRD diffraction patterns of the NASx catalyst samples after reduction. It can be seen from Figure 2 that the XRD patterns of reduced catalysts exhibited qualitatively similar spectrum. The typical diffraction peaks at around 44.5o, 51.9o, and 76.4ocould be assigned to Ni[25], while the peaks for NiO appeared at 2θ=37.2°, 43.2°, and 62.8°[26]. The broad peaks at 2θ=37.1o, and 66.5owere observed in all the NASx catalysts, indicating the existence of γ-Al2O3phase[27]. However, there was no obvious SiO2peak at 2θ=21.5°[28]to be detected, which might be caused by a more uniform dispersion or a higher disordered degree of SiO2species. Compared with the NAS0 sample, the diffraction peak intensity of metallic nickel was subsequently weakened with an increasing SiO2loading. This manifested the diminution of the crystallinity of Ni phase after reduction, which would foster the dispersion of Ni on the support. The crystallites size of the metallic Ni was calculated from the broadening of the Ni (200) according to the Scherrer-Warren equation[27], as shown in Table 1. The silica-loading samples showed a decrease in the size of crystalline metallic Ni with an increasing SiO2content.

Figure 1 N2 adsorption-desorption isotherms of NASx catalysts (a); and pore size distribution of NASx catalysts (b)

Table 1 Textural properties and acidity of NASx catalysts
Among the samples examined, the NAS0 catalyst exhibited a largest nickel size of 5.4 nm, whereas, the nickel size f inally decreased to below 4 nm in a sample with a silica loading of ≥6.4%. These results indicated that the Ni species were less likely to be agglomerated as the SiO2loading increased. In other words, the prepared silica-containing samples exhibited a better dispersion than NAS0, which might further enhance the catalytic activity during the B3D hydrogenation reaction.

Figure 2 XRD patterns of the NASx catalysts after reduction
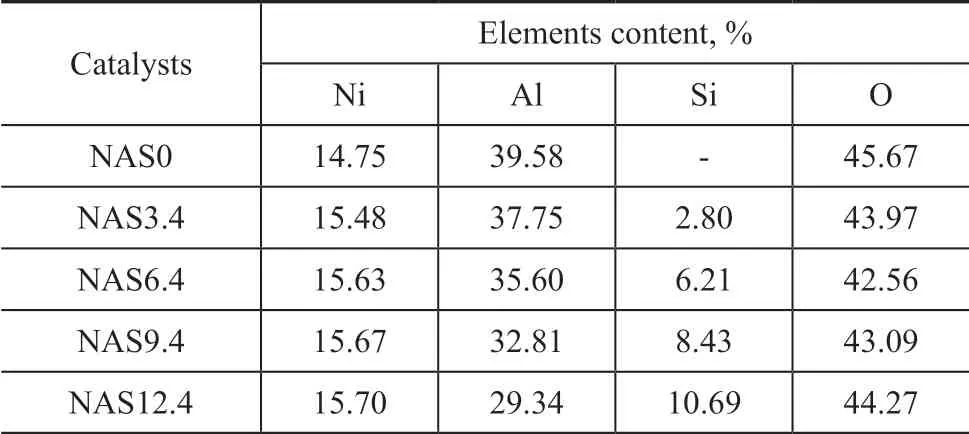
The low-resolution SEM images of the as-synthesized NAS0 and NAS6.4 catalysts are shown in Figure 3. The NAS0 catalyst exhibited large particles spreading around the small particles. However, no obvious large particles but the f ibrous morphology were found in the NAS6.4 catalyst, which could be assigned to the amorphous SiO2. Figure 4 presents the EDX spectra of the NAS6.4 catalyst and the corresponding electron mapping image analysis of the distribution of Ni, Al, and Si atoms in the sample. In Figure 4 (a), the EDX spectra confirmed the presence of different atoms in the NAS6.4 catalyst, while the presence of the Si element was not identified by the XRD analysis. Furthermore, the Si, Ni, and Al atoms with various colors exhibited a homogeneous distribution on the surface of NAS6.4 catalyst as shown in Figure 4 (c―e), denoting the uniform distribution of the mentioned atoms on NAS6.4 catalyst prepared by the onestep method. The chemical compositions of catalysts were individually estimated as shown in Table 2. In comparison with the theoretical values, the deviation existing in elemental compositions was permissible.

Figure 3 SEM images of NAS0 catalyst and NAS6.4 catalyst
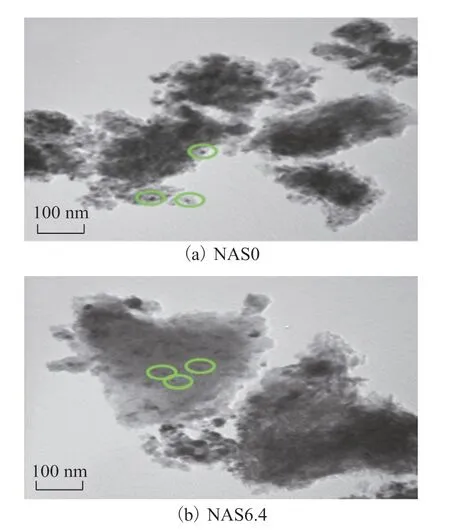
Figure 5 displays the TEM images for the reduced NAS0 and NAS6.4 catalysts. Judging from the NAS0 catalyst image shown in Figure 5 (a), the core Ni nanoparticles (highlighted with green circles) with an approximate size of 10 nm were obviously observed with the aggregation. In comparison, the Ni nanoparticles in the NAS6.4 sample exhibited smaller size, which indicated that the SiO2was responsible for the prevention of metallic nickel aggregation.

Figure 4 EDX spectra (a), SEM image (b), and corresponding mapping of Si, Ni, Al elements in NAS6.4 catalyst (c—e)

Table 2 Chemical compositions of catalysts determined by SEM-EDX analysis
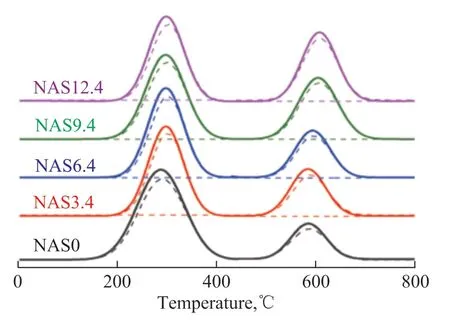
Figure 6 presents the H2-TPR profiles of the NASx catalysts. All the NASx catalysts exhibited two broad peaks at the temperature of 288 °C and 605 °C, representing the presence of many NiO particles with no or weak interaction with the support[29-30]and Ni2+species strongly interacting with the Al2O3–SiO2surface[27,31], respectively. The nature of various Ni species would affect the reducibility[10,26]. As the silica loading raised, the relative concentrations of Ni2+species that could strongly interact with the support gently increased as depicted in Table 1, which could serve as evidence that the SiO2strengthened the interaction between nickel and the substrate. To some extent, the Ni2+interacting strongly with the support would be beneficial to dispersing the metallic Ni on the support after reduction, which was consistent with the literature report[32]. In the NAS12.4 sample, the excessive NiO strongly interacting with the support could influence the reduction behavior of NiO, which would result in the diminution in the number of active Ni0species.

Figure 5 TEM images for the NAS0 and NAS6.4 catalysts after reduction

Figure 6 H2-TPR profiles of NASx catalysts after calcination
The XPS Ni 2p core-levels lines for the NAS6.4 catalyst and the contrastive NAS0 catalyst after reduction are displayed in Figure 7 (a-b), respectively. It can be seen that the XPS spectra of Ni 2p core-levels for the reduced NAS0 and NAS6.4 catalysts were deconvoluted into four peaks located at around 852.2 eV, 854.0 eV, 856.3 eV, and 862.1 eV, denoting the various oxidation states of Ni, which corresponded to Ni0and Ni2+for none /weak interaction with the support, Ni2+from strong interaction with the support, and the shake-up satellite peak, respectively[33]. According to the analysis of specific peak areas, the relative ratios of surface concentration for various nickel species on the NAS0 and NAS6.4 catalysts are reported in Table 3. The NAS0 catalyst presented a Ni0concentration of 24.3%, which might induce the aggregation of Ni0and was in conformity with the XRD, SEM and TEM results. Besides, the NAS6.4 sample showed a value of 24.7% for Ni2+strongly interacting with the support which was higher than that in NAS0 catalyst. It could be concluded that SiO2addition promoted the interaction between NiO and the support, which was in agreement with the H2-TPR results.

Figure 7 XPS spectra of Ni 2p for NAS0 and NAS6.4 catalysts after reduction
The NH3-TPD results of the NASx catalysts are shown in Figure 8. Based on the desorption temperature, the acidity of acid sites can be classified into weak (150–250 °C), medium (250–400 °C), and strong (400–800 °C) acid sites[34]. The total amount of acid sites increased dramatically with the increase of SiO2loading. Specifically, the amount of medium acid sites continuously increased with an increasing silica content. However, for samples with SiO2loading which was equal to or higher than 6.4%, the number of weak and strong acid sites remained almost constant. As regards the NAS6.4 sample, the peak ascribed to the medium-strong acid sites shifted to a higher desorption temperature which induced an increase in acid strength of these sites[35]. The total acidity of the samples was enhanced with an increasing SiO2content and a similar trend had been reported in the literature[36]. Additionally, the surface acidity could regulate the Ni2+-support interaction, the strong Ni2+-support interaction was ascribed to selective adsorption of Ni2+on the strongest acid sites[30]. However, the over-strengthened interaction could lead to the dropping reducible ability in the NAS12.4 samples.

Table 3 Peak positions and relative composition of nickel species derived from the Ni2p XPS spectra for the NAS0 and NAS6.4 catalysts

Figure 8 NH3-TPD profiles of the NASx catalysts after reduction
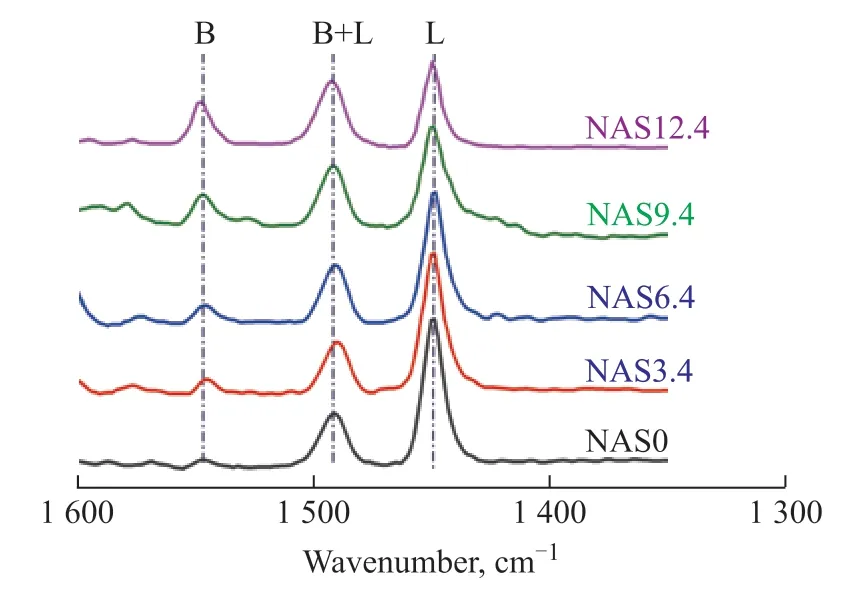
In order to identify the type of acid sites and their relative proportion in NASx catalysts, the Py-FTIR analysis was carried out, with the results presented in Figure 9. The corresponding B/L values are listed in Table 1. It can be seen that the NAS0 sample exhibited a prominent band attributed to the amount of Lewis acid sites (1449 cm-1) and few Brönsted acid sites (1547 cm-1), indicating that the Lewis acidity was dominant in the NAS0 sample. The band at 1490 cm-1representing both types of acid sites was observed in all catalysts[37]. In the silica-doped samples, the amount of Brönstedacid sites increased with the increase in SiO2loading, whereas the amount of Lewis acid sites decreased. This fact manifested that the introduction of SiO2could promote the formation of Brönstedacid sites[19]. Upon considering that the Lewis acid sites were mainly originated from the coordinately exposed unsaturated surface Al3+sites, with an raising SiO2content, a part of surface Al3+sites were covered by silica, leading to the diminution of Lewis acid sites.

Figure 9 Py-FTIR spectra of NASx catalysts with various SiO2 contents
3.2 Catalytic performance
Hydrogenation of crude B3D under mild conditions was utilized as a model reaction to assess the catalytic activity of the NASx catalysts. In Figure 10, the conversion of B1D together with the products selectivity was plotted. The NAS6.4 and NAS9.4 samples showed higher conversion of B3D, as compared with other catalysts, which were affected by the nature of various Ni species on the support. Also, the fitting dispersion of Ni on the support cannot be neglected. The higher specific surface area was responsible for improving the active Ni0species dispersion on the basis of accommodating a favorable number of Ni metal sites. However, the NAS12.4 sample with the largest specific surface area exhibited a lower conversion owing to the overmuch concentration of Ni2+interacting strongly with the support, as shown in the H2-TPR results. Under the synergistic effects of both the number of reduced active Ni sites for hydrogenation and the dispersion on larger support surface, the conversion of the crude B3D reached an optimum value of 93.55% on the NAS6.4 catalyst. The catalysts with a silica loading of ≤6.4% exhibited a higher B1D selectivity of 75.18%. This outcome in combination with the Py-FTIR results might be attributed to the abundant Lewis acid sites in NAS0, NAS3.4 and NAS6.4 catalyst samples, which could interact with “C=O” bonds in HBD bringing, leading to the formation of “C-O-Lewis acid sites” transition state to foster “C=O” bonds to be adsorbed and activated, and thereby to be further hydrogenated to B1D, which was in agreement with the literature reports[38-39]. Moreover, according to the trend concerning the selectivity of B1D in the catalyst sample with a silica loading of ≤ 6.4%, it is obvious that the selectivity of B1D not only exclusively depended on the Lewis acid sites, but was also hinged on the interaction between Ni2+and the support. The existence of stronger interaction in the NAS6.4 catalyst could facilitate the well dispersion of Ni species on the support.

Figure 10 Catalytic performance of NASx catalysts in hydrogenation of crude B3D
4 Conclusions
The catalytic performance of NASx catalysts in the hydrogenation of B3D was studied. The main changes induced by SiO2addition were the acidity and the change in the interaction of Ni2+with the support. The strong interaction was derived from the existence of strong acidic sites on the substrate. Besides, a proper amount of Lewis acid sites was beneficial to the selectivity of B1D. The suitable interaction with Ni2+could be conducive to the formation of smaller Ni particles to improve its dispersion on the support after reduction. However, the over-strengthened interaction would decrease the reduction behavior. The NAS6.4 catalyst demonstrated excellent performance in the reaction owing to the synergic effects of favorable acidity, suitable interaction of Ni2+with the support and the larger surface area, resulting in a B3D conversion rate of 93.55% and a B1D selectivity of 75.18%.
Acknowledgment:Financial support from the National Natural Science Foundation of China (21163019) is gratefully acknowledged.
杂志排行
中国炼油与石油化工的其它文章
- Environmentally-Friendly Catalytic Oxidation of Cyclohexanone with 30% H2O2 Solution: A Comparison Study between Hollow Titanium Silicate and Dealuminated HBEA Zeolites
- Mass Loss Behavior and Volatile Composition during Pyrolysis of a Bituminous Coal
- Catalytic Hydrogenation Performance of Methyl Isobutyl Ketone over Ni/γ-Al2O3 Catalysts
- China Will Increase Ethylene Production Capacity Totaling Around 15 Mt/a by 2025
- Boosted Biodegradability and Tribological Properties of Mineral Base Oil by Methyl Diethanolamine Fatty Acid Esters
- A Study on the Coking Sites of γ-Alumina Surface Using 1-Methylnaphthalene as the Model Reactant
