The ecological risks of hydrogen peroxide as a cyanocide: its effect on the community structure of bacterioplankton*
2018-12-22LINLizhou林立洲SHANKun闪锟XIONGQian熊倩ZHOUQichao周起超LILin李林GANNanqin甘南琴SONGLirong宋立荣
LIN Lizhou (林立洲) , SHAN Kun (闪锟) XIONG Qian (熊倩) ,ZHOU Qichao (周起超) LI Lin (李林) GAN Nanqin (甘南琴) SONG Lirong (宋立荣)
1 State Key Laboratory of Freshwater Ecology and Biotechnology, Institute of Hydrobiology, Chinese Academy of Sciences,Wuhan 430072, China
2 University of Chinese Academy of Sciences, Beijing 100049, China
Abstract Microcystis blooms are an environmental and ecological concern that has received a serious attention. Hydrogen peroxide (H 2 O 2) is an environment-friendly cyanocide that is commonly used to control Microcystis blooms. While the ecological safety of H 2 O 2 has been previously studied, its influence on bacterioplankton has not been investigated to date. In this study, we used mesocosm experiments to determine the influence of H 2 O 2 on the dynamic changes of the community structure of bacterioplankton. By using deep-sequencing and metagenomics strategy we determined the community structures of phytoplankton and bacterioplankton assemblages that were dominated by Microcystis at a highly eutrophic Dianchi Lake,China. The results showed that Microcystis was more sensitive to H 2 O 2 than other eukaryotic algae. More interestingly, application of H 2 O 2 changed the community structure of bacterioplankton, evidenced by the emergence of Firmicutes as the dominant species in place of Bacteroidetes and Proteobacteria. The H 2 O 2 treatment resulted in the community of bacterioplankton that was primarily dominated by Exiguobacterium and Planomicrobium. Our results show that the abundance changed and the bacterioplankton diversity did not recover even after the concentration of H 2 O 2 reached to the background level. Thus, the response of bacterioplankton must be considered when assessing the ecological risks of using H 2 O 2 to control Microcystis blooms, because bacterioplankton is the key player that forms the basis of food web of aquatic environment.
Keyword: hydrogen peroxide; Microcystis bloom; ecological risks; bacterioplankton
1 INTRODUCTION
Because of heavy eutrophication and global warming, cyanobacteria blooms have been rapidly rising recently throughout the world (Paerl and Huisman, 2009; Wagner and Adrian, 2009).Microcystisblooms have been reported in more than 108 countries and have resulted in negative economic and societal impacts including drinking water crises(Qin et al., 2007; Harke et al., 2016). Harmful cyanobacterial bloom has been a scientific interest and a societal concern, because cyanobacteria such asMicrocystiscan produce toxins or odorous substances,including microcystins, β-N-methylamino-L-alanine(BMAA), paralytic shellfish poison (PSP), anatoxins,and 2-Methylisoborneol (MIB) (Bishop et al., 1959;Cox and Sacks, 2002; Sant’Anna et al., 2011; Wang et al., 2015b; Zhang et al., 2016).
Because of serious environmental concerns, a wide array of strategies have been tested to control or mitigate cyanobacteria blooms (Hamilton et al., 2016;Triest et al., 2016; Matthijs et al., 2016; Visser et al.,2016). Hydrogen peroxide (H2O2) were often used to control cyanobacterial blooms (Drábková et al.,2007), because it is particularly effective against cyanobacteria and is considered environmentally friendly. Compared to eukaryotic algae, cyanobacteria are highly susceptible to reactive oxygen species(ROS)-generating chemicals such as H2O2.Cyanobateria do not have the complete biochemical pathway of Mehler reaction that produces superoxide anion (Mehler, 1951; Helman et al., 2003, 2005).Furthermore, different species of cyanobacteria have different tolerances to ROS. AlthoughMicrocystisis more resistant to H2O2than other cyanobacetria because of its ability to form colonies and richness of extracellular polymeric substances (Lürling et al.,2014; Gao et al., 2015),Microcystisbloom can be still controlled by H2O2.
The ecological risks associated with applying H2O2and its effects on macrofauna, fishes, macroinvertebrates, and zooplankton have been studied(Matthijs et al., 2012; Reichwaldt et al., 2012; Burson et al., 2014). However, there is no published report on the effects of H2O2on bacterioplankton and merits an investigation, because bacterioplankton plays major role in the natural food web of aquatic ecosystems. In aquatic ecosystems, the background concentrations of H2O2can reach 1 μmol/L (Häkkinen et al., 2004).Hydrogen peroxide at environmentally relevant concentrations could influence the microbial activity and composition of bacterial communities (Glaeser et al., 2014). Bacterioplanktons play an important role in nitrogen, carbon, phosphorus, and sulfur cycling in aquatic ecosystems (Simon et al., 2002; Zeng et al.,2007), and directly influence the dynamic of cyanobacteria (Canfield and Des Marais, 1993; Stuart et al., 2016). Some bacteria capable of algicidal effect are associated with the decline ofMicrocystisbloom(Manage et al., 2001; Zhang et al., 2012; Su et al.,2016). On the other hand, the decomposition ofMicrocystisbloom at natural environment influences the structure of bacterial communities (Shao et al.,2013). Additionally, the algicidal nanosilver particles can synergize the effect of antibiotics against gammanegative fish pathogenic bacteria (Satapathy et al.,2017). Therefore, we speculated that the application of H2O2on cyanobacteria bloom can influence population dynamics and the community structures of bacteriplanktons.
Dianchi Lake is one of the most eutrophic lakes in China and accumulates a massive amount ofMicrocystisbiomass throughout the year (Wu et al.,2014, 2016). In this study, we carried out mesocosm experiments at Dianchi Lake (latitude: 24°51′N,longitude: 102°42′E, altitude: 1 887 m a.s.l.) to evaluate how the application of H2O2, aMicrocystisbloom control measure, affects the overall population dynamics, composition and structures of bactrioplanktons. Our objectives were to determine(1) the dose that are lethal to algae and cyanobacteria,(2) whether H2O2would affect bacterioplankton at the dose that can controlMicrocystisblooms, and (3) the ecological risks that the use of H2O2causes to the community of bacterioplanktons in aquatic ecosystems.
2 MATERIAL AND METHOD
2.1 Mesocosm experiment
Dianchi Lake, the sixth largest freshwater lake in China, has been suffering from harmful algal blooms over recent decades. The concentration of Chlais generally higher in the northern part of Dianchi Lake than any other areas in the Lake and has been reported to exceed 100 μg/L even in December (Wu et al.,2014, 2016). We first transferred the lake water from the water surface into ten plastic barrels and placed the barrels on an experimental platform on the lake.Each barrel contained 150 L the lake water. We then added H2O2to these barrels at concentrations of 2, 4,8, and 12 mg/L. The original temperature, Chlaconcentration, dissolved oxygen, and pH in the bulk samples were 10.2℃, 84 μg/L, 9.9 mg/L, and 8.8,respectively. We performed the experiment during the period of 23 December 2013 and 3 January 2014. At the end of the experiment, the H2O2concentrations in all of the treatment groups were below the detection limit. We analyzed the H2O2concentrations as described by Drábková et al. (2007) and conducted the experiment in duplicates.
2.2 Bacterioplankton and phytoplankton abundance
The phytoplankton assemblages were microscopically identified as described by Wu et al. (2016).Water samples (1 L) were fixed with 10 mL of acidic Lugol iodine solution. The samples were concentrated to 30 mL and examined via microscopy (Olympus CS31, Japan). To calculate the bacterial cell density,8 mL of the water samples were collected into 10 mL axenic tubes and fixed with 0.3 mL of 25%glutaraldehyde solution. Samples were kept in the dark at 4℃. After staining with DAPI (4’,6-diamidino-2-phenylindole), samples were filtered onto a 0.22-μm nuclepore membrane (Whatman, 110656, UK).The bacterial abundance was then determined manually using epifluorescence microscopy (Olympus BX51, Japan) (Porter and Feig, 1980).

Fig.1 Reduction of H 2 O 2 concentrations during experimental period
2.3 The community structures of bacterioplanktons and phytoplanktons community
2.3.1 Sample collection
In order to prepare samples for analysis of the community structures of the bacterioplankton and phytoplankton by deep sequencing, water samples were filtered through a 0.22-μm pore-size polycarbonate membrane (XinYa factory, Shanghai).The membranes with planktons were kept at -20℃until DNA extraction.
2.3.2 DNA extraction and Illumina sequencing
Genomic DNAs were extracted with a DNA kit(MP Fast DNA SPIN Kit for soil, 116560-200, USA).Illumina sequencing was performed at RIBOBIO Co.,Ltd. (Guangzhou, China) by Illumina MiSeq using primers that targeted the V3 and V4 regions of the 16S rDNA (Klindworth et al., 2013) (forward: 5′TCGTCGGCAGCGTCAGATGTGTATAAGAGACAG; reverse: 5′ GTCTCGTGGGCTCGGAGATGTGTATAAGAGACAG). Paired-end reads were stitched together into Unique Tags with FLASH (Magoč and Salzberg, 2011) and Mothur (V 1.27.0) (Schloss et al.,2009). Unique Tags were assigned into OTUs with a cutoff of 97%. We discarded OTUs that were identified only once. The representative sequences that were selected from each of the OTUs were aligned with the Greengene (http://greengenes.lbl.gov/) database GG 13.5 to obtain the taxonomic framework.
Illumina sequencing yielded a total of 2 331 945 tags. An overall average of 72 873 sequences (between 3 971 and 110 259 sequences) were obtained for each sample. A total of 15 709 OTUs were aligned, 99.1%,99.1%, 98.3%, 74.4%, and 52.5% of which were classified at the phylum, class, order, family, and genus levels, respectively. The 16S rDNA amplicons were separated into three parts: 1) cyanobacteria phylum were used to analyze theCyanophytacommunity; 2) chloroplasts were used to analyze the eukaryote phytoplankton community, and 3) the noncyanobacteria 16S rDNA amplicons were used to analyze the community structures of bacterioplankton.The OTUs of prokaryote and eukaryote phytoplanktons, and the non-cyanobacteria were resampled to achieve the minimum sample sizes of 104,75, and 1 828, respectively. Given that the total cyanobacteria tags were below 32 after the 11-day treatment at doses of 8 and 12 mg/L, respectively, we did not analyze the 16S rDNA amplicons of cyanobacteria in those experimental groups.
2.4 Statistical analysis
Distance-based ANOVA (dbANOVA), calculation of Shannon-Wiener index and rarefaction curve were performed with vegan Package in R 3.1.2 (http://www.r-project.org/). ANOVA was performed in SPSS 17.0.
3 RESULT
3.1 Effect of hydrogen peroxide on phytoplankton
The H2O2concentrations decreased during the experiment. On the third day, the H2O2concentrations in the 2, 4, 8, and 12 mg/L groups decreased to 0.2,1.3, 3.9, and 6.0 mg/L, respectively. The concentration of the control group remained below 0.05 mg/L during the experiment. On day 9 and 11, the H2O2concentrations in all treatments were reduced to the level that was similar to that of the control group (Fig.1).
The abundance ofMicrocystisdecreased when H2O2was applied at doses of 4 mg/L and above, but the cell density ofMicrocystisdid not decrease after 11 days when the used H2O2dose was 2 mg/L(ANOVA,P>0.05). At higher concentrations of H2O2(>4 mg/L), the more rapid decrease in the abundance ofMicrocystiswas observed. The cell density ofMicrocystiswas 1.6×10⁷cells/L at the beginning(Fig.2a). After 1 day, the abundance ofMicrocystisin 12 mg/L group was only 25% of that of the control group. After 3 days,Microcystisof 8 and 12 mg/L groups were less than 20% of that of the control group. After 11 days, the cell densities ofMicrocystisin the treatment groups with H2O2doses of 4, 8, and 12 mg/L were less than half of the density of the control group.
As well as examining the effects onMicrocystis, we also evaluated the algicidal effects of H2O2on other algae, namelyChlorophyta, diatoms,Cyanophyta,DinoflagellatesandCryptophyta(Table 1, Figs.2, 3),and found that the effects were variable.CyanophytaandCryptophytawere more sensitive to H2O2thanChlorophyta, diatoms, andDinoflagellates. The structure of phytoplankton communities (Fig.4)changed during the experimental period. The proportions ofCyanophytaandCryptophytadecreased when H2O2was added at concentrations of 4, 8, and 12 mg/L,while the proportions of diatoms andChlorophytaincreased when treated with H2O2at concentrations of 8 or 12 mg/L.
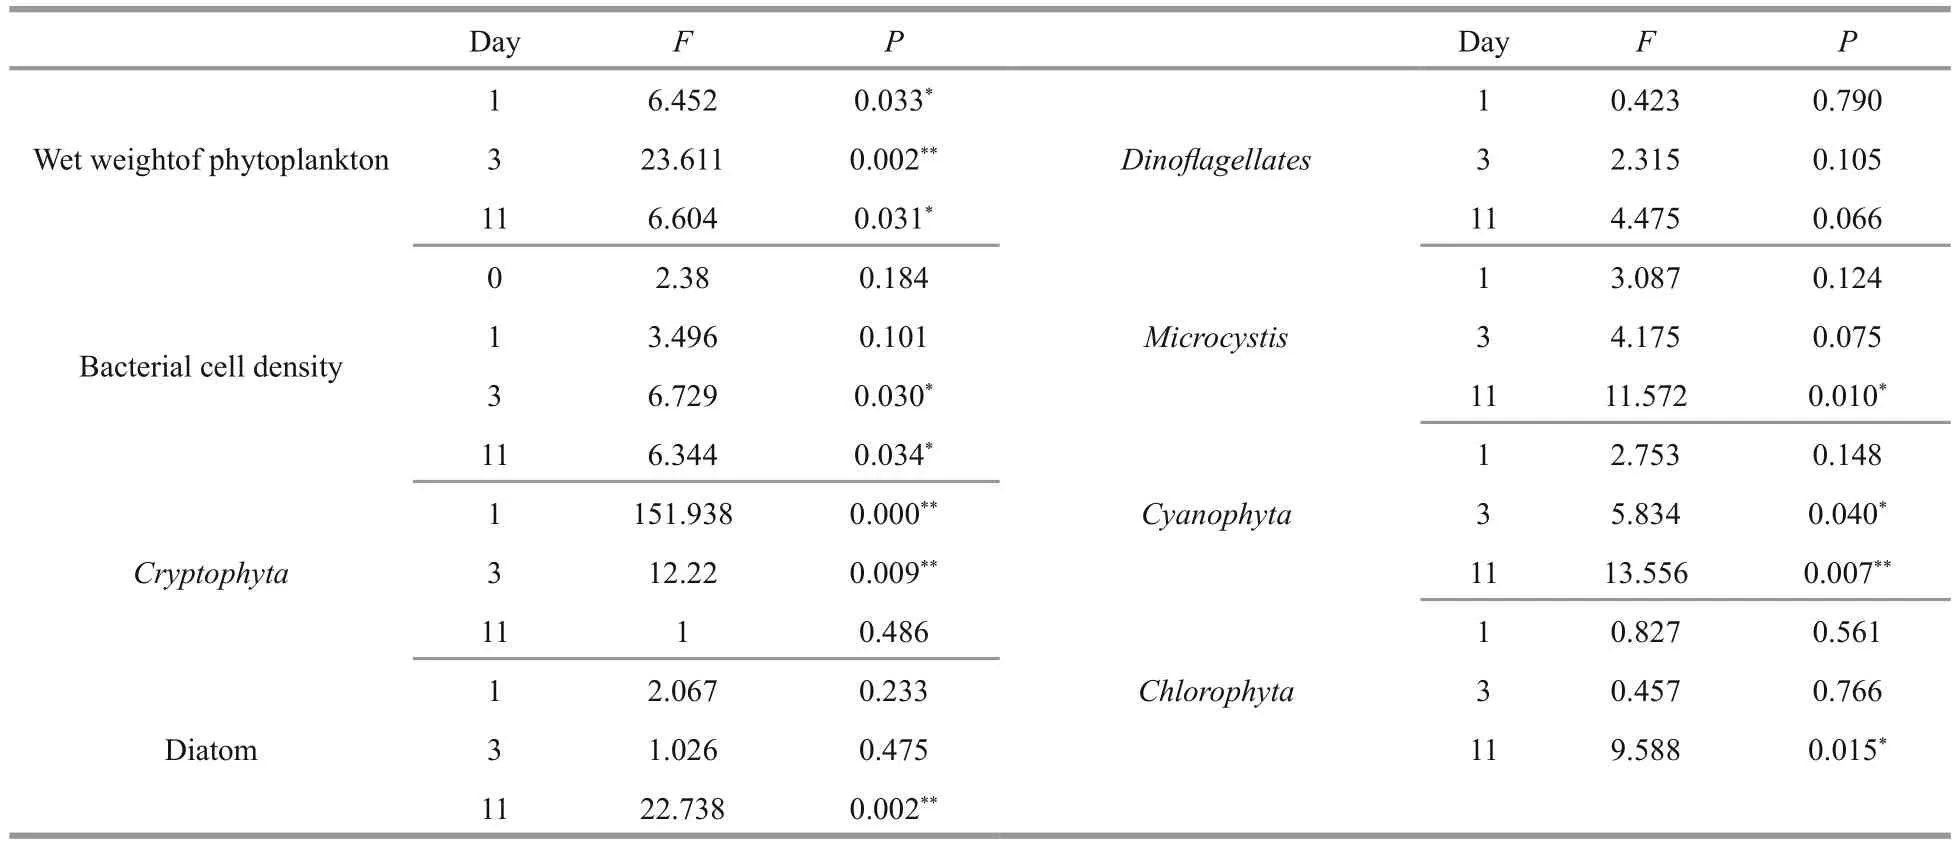
Table 1 ANOVA results showing the influence of hydrogen peroxide on phytoplankton and bacterioplankton
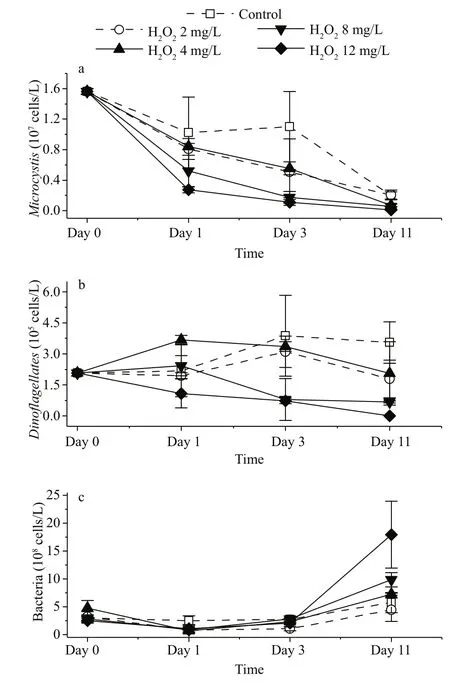
Fig.2 Change of cell density of Microcystis (a), Dinoflagellates(b) and bacteria (c) after the application of H 2 O 2
We also examined the phytoplankton community composition by analyzing the 16S rDNA amplicons.The rarefaction curves were shown in Fig.5. The results of Illumina sequencing were consistent with those from the microscopic examinations (Fig.6). At the beginning of the experiment, the eukaryote phytoplankton community was dominated byStramenopilesandCryptophyta. There were lessCryptophyta, and the proportion ofChlorophytaincreased after H2O2was added. The prokaryotic phytoplankton community was dominated byMicrocystisat the start of the experiment. TheMicrocystisproportion increased three days after the H2O2treatment and was higher than that of the control group. However, after 11 days theMicrocystisproportion was declined in the H2O2-treated groups and lower than that in the control groups.
MicrocystisandCryptophytawere more sensitive to H2O2thanChlorophyta, diatoms, andDinoflagellates. Applications of H2O2appeared to selectively control the abundance ofMicrocystis.
3.2 Effect of hydrogen peroxide on bacterioplanktons

Fig.3 Changes of wet weight after the application of H 2 O 2
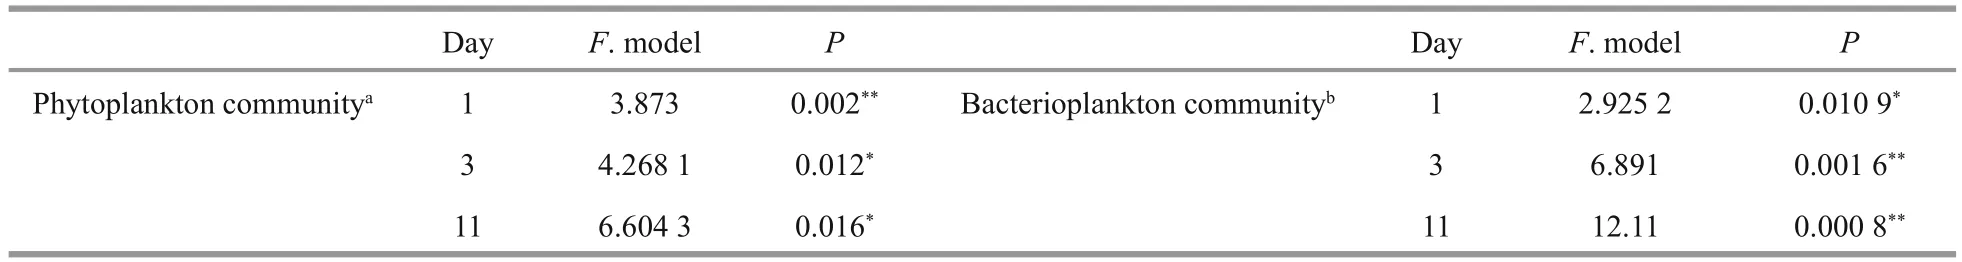
Table 2 Distance-based ANOVA analysis results of the influence of hydrogen peroxide on the composition of phytoplankton and bacterioplankton communities (Bray-Curtis distance)
The structures of the bacterioplankton communities changed and became significantly different after additions of H2O2(Table 2,P<0.05, Fig.7). The effects of H2O2on bacterioplankton varied depending on the H2O2doses. At the beginning of the experiment, the bacterioplankton community was dominated byActinobacteria,Flavobacteria,Alphaproteobacteria,Betaproteobacteria, andGammaproteobacteria(Fig.6).
Flavobacteriumwas the dominant genus at the beginning (Fig.6) of the experiment and maintained its population at the level of ~10% in the control group. The proportion ofFlavobacteriumdecreased in the experimental group that was treated with H2O2(2 mg/L), but recovered after 3 days when the concentration of H2O2decreased. On day 11, the proportion ofFlavobacteriumin the 2 mg/L group was higher than that in the control group and accounted for 25% of the bacterioplankton community.In contrast, the proportions ofFlavobacteriumin the 4, 8, and 12 mg/L H2O2groups decreased, and represented only 1.5%, 1%, and 1% of the bacterial communities after 11 days, respectively. While the concentration of H2O2was less than 0.05 mg/L on days 9 and 11, the proportion ofFlavobacteriumdid not recover when the doses of H2O2were 4 mg/L and above.
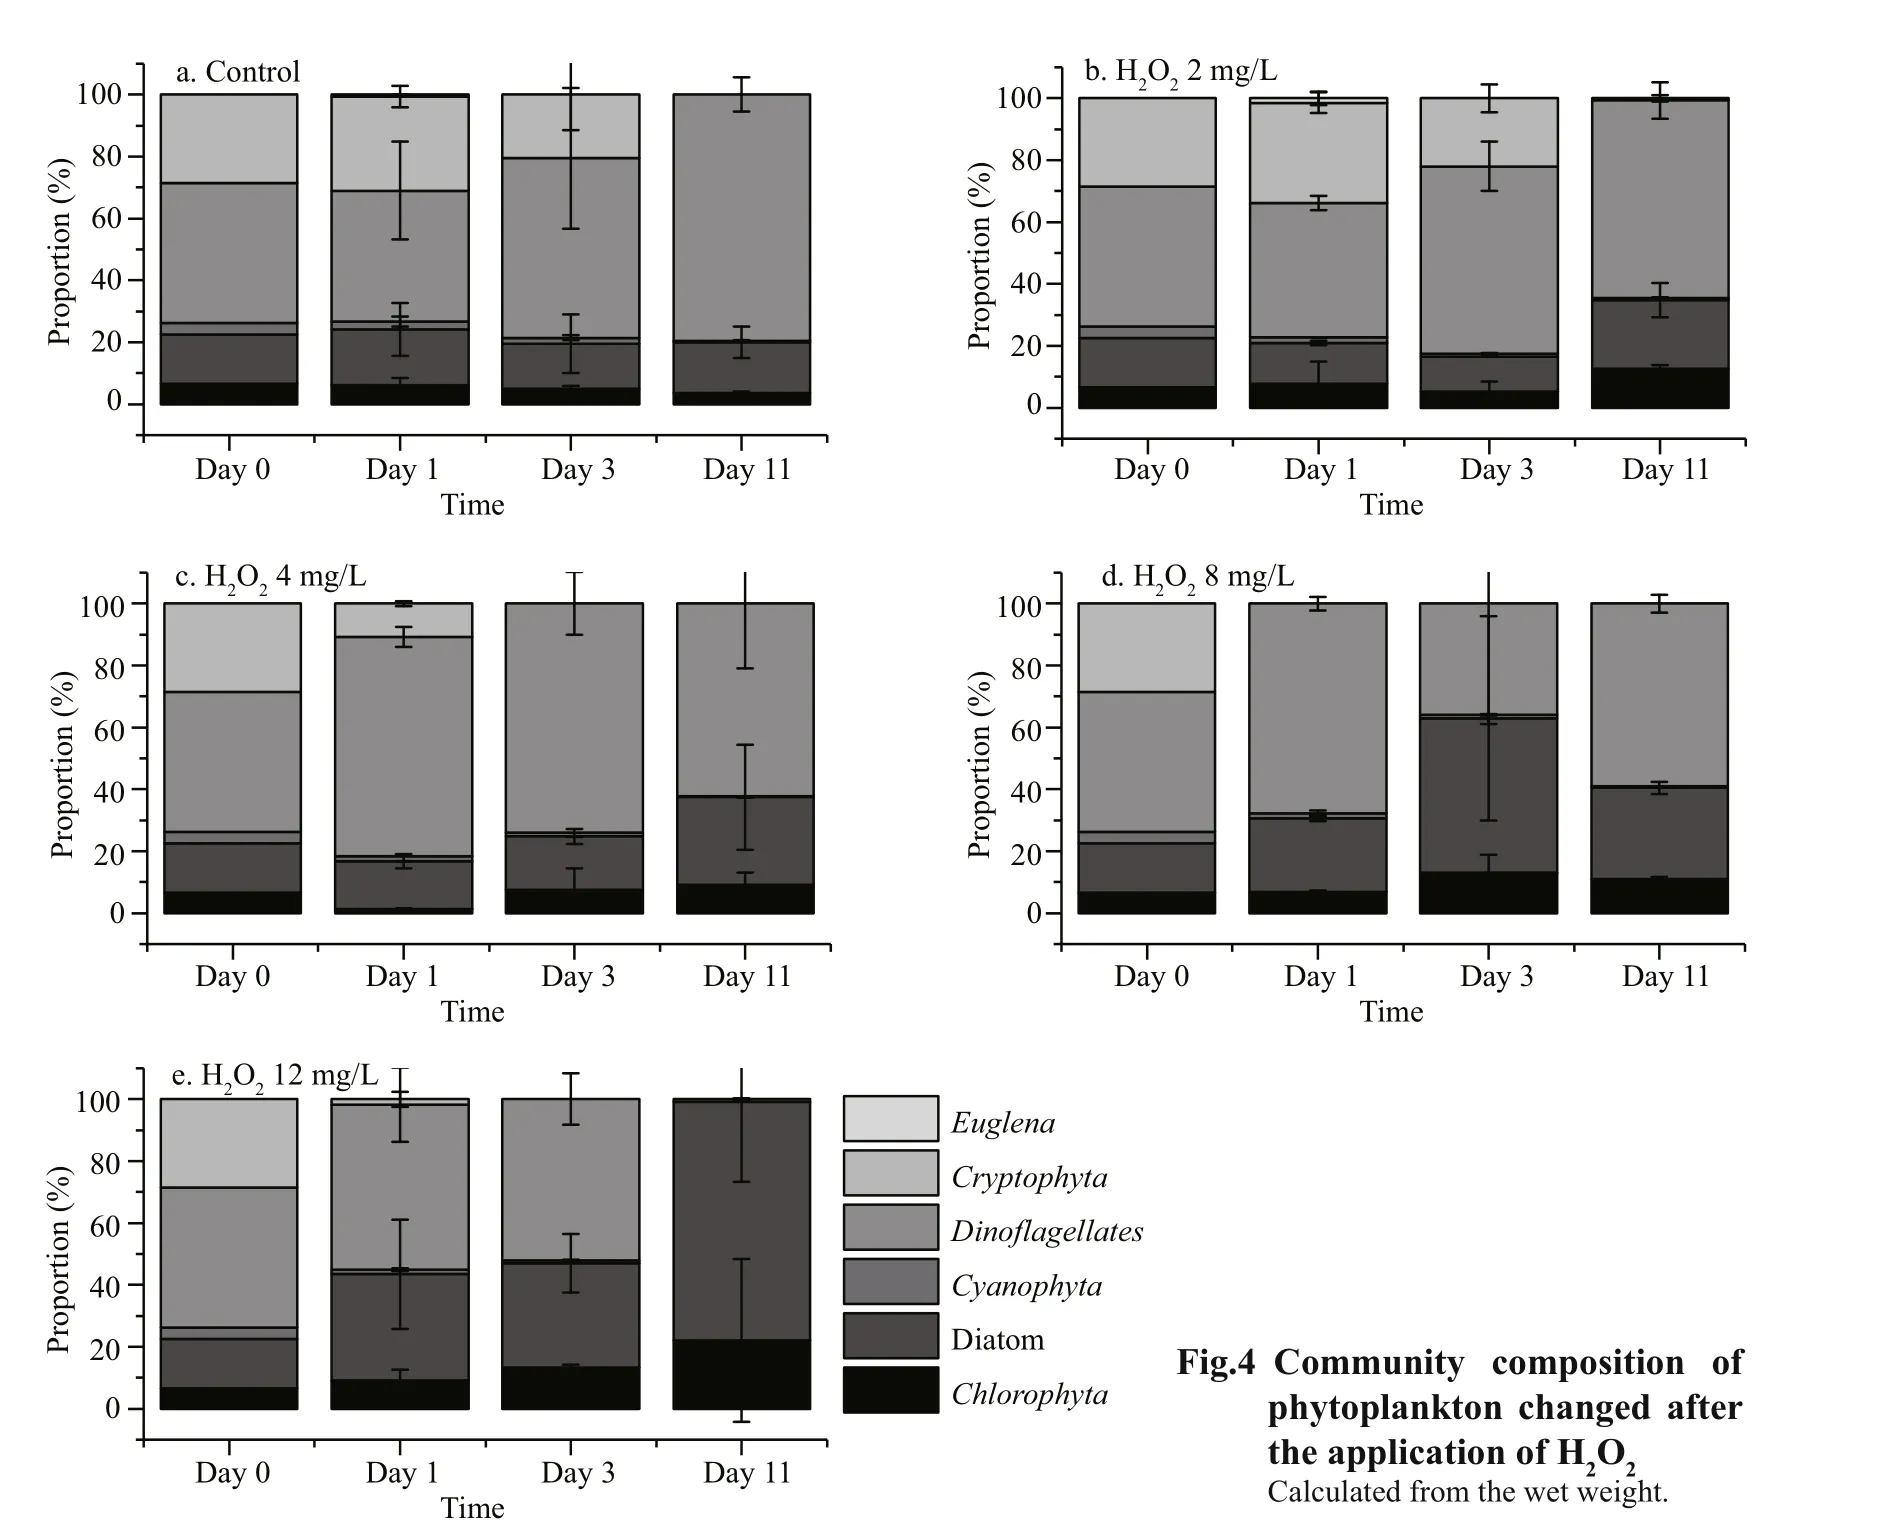
Fig.4 Community composition of phytoplankton changed after the application of
The proportions ofExiguobacterium,Planomicrobium, andSphingomonaswere higher in the H2O2treated groups compared to the control group. After the 11-day H2O2treatment,Exiguobacteriumoccupied 59% and 29% of the bacterioplankton communities in the experimental groups that were treated with 4 and 8 mg/L H2O2,respectively.Planomicrobiumin the control group represented less than 1% during the experiment, but was high in the H2O2-treated groups. As the concentration of the H2O2treatment increased, the proportion ofPlanomicrobiumalso increased, and accounted for 2.1%, 12.5%, 50%, and 62.6% of the bacterioplankton communities after 11 days in the 2,4, 8, and 12 mg/L H2O2groups, respectively. After 11 days,Sphingomonaswas higher in the 4, 8, and 12 mg/L groups than in the control, where it accounted for 1.6%, 2.3%, and 4.1% of the total,respectively.
The H2O2applications also influenced the abundance of bacterioplankton (Fig.2c). On day 1, the cell densities of bacteria in all of the H2O2treated groups were lower than that in the control group. On day 11, the cell densities of bacteria that were treated with 2, 4, and 8 g/L of H2O2and the control group were similar, while the cell density in the 12 mg/L group was twice of that in the control group.
3.3 The influence of H 2 O 2 on the alpha-diversity of phytoplankton and bacterioplankton
The Shannon-Wiener Index of phytoplankton at the phylum level decreased in all groups, and was lowest in the 12 mg/L group after the 11-day H2O2treatment (Fig.8). Meanwhile, the Shannon-Wiener Index of bacterioplankton at the genus level was stable for the control group, but was low in the groups treated with H2O2at concentrations of 4, 8, and 12 mg/L. These results indicate that the α-diversity of phytoplankton and bacterioplankton decreased after being treated by H2O2.

Fig.5 Rarefaction plots for Illumina sequencing results of samples
4 DISCUSSION
4.1 The selectivity of hydrogen peroxide on different phytoplankton
Producing no harmful secondary pollutants, H2O2is regarded as an environmental friendly cyanocide and has been used to control cyanobacteria blooms(Matthijs et al., 2012, 2016; Burson et al., 2014). The selectivity of H2O2has been reported previously; for example, cyanobacteria have been reported to be more sensitive to H2O2than diatoms andChlorophyta(Barroin and Feuillade, 1986; Drábková et al., 2007;Barrington and Ghadouani, 2008). This study showed that the decrease in the abundance of phytoplankton was often associated with the increase ofChlorophyta,diatoms andDinoflagellatesupon the application of H2O2, indicating that eukaryote phytoplankton were more tolerant to H2O2as previously shown (Barroin and Feuillade, 1986; Drábková et al., 2007; Barrington and Ghadouani, 2008).
The responses to H2O2by different bloom-forming cyanobacteria also varied. Two previous studies reported that 2 mg/L of H2O2could effectively controlPlanktothrixbloom in an entire lake, but 5 mg/L of H2O2were needed to successfully controlMicrocystisblooms (Matthijs et al., 2012, 2016). When H2O2was added to our mesocosm systems in whichPlanktothrixandMicrocystisco-existed,PlanktothrixandMicrocystisresponded differently (Figs.2a, 6). While H2O2doses of 4 mg/L and above resulted in reduced abundance ofMicrocystis, the proportion ofMicrocystisin cyanophyta increased as the proportion ofPlanktothrixdecreased, indicating thatMicrocystiswas more tolerant to H2O2thanPlanktothrix. The strong tolerance ofMicrocystismay be attributed to the formation ofMicrocystiscolonies in the field.Microcystiscolonies are capsuled with extracellular polymeric substances that may help guard them against the H2O2treatment (Gao et al., 2015). The strong tolerance ofMicrocystiscolonies was also correlated with the tolerance levels of colonial or unicellularMicrocystisto other algicides. For example,unicellularMicrocystiswas reported to be more sensitive to copper sulfate than colonialMicrocystis(Wu et al., 2007). Different strains of unicellularMicrocystisalso responded differently to copper sulfate (Wu et al., 2017). Researchers have suggested that H2O2could effectively inhibit the growth ofMicrocystisor mitigate cyanobacteria blooms at doses between 0.4 and 6 mg/L (Drábková et al., 2007;Lürling et al., 2014; Gao et al., 2015; Wang et al.,2015a). Therefore, understanding of the cyanobacteria composition and theMicrocystischaracteristics is necessary before the application of H2O2.
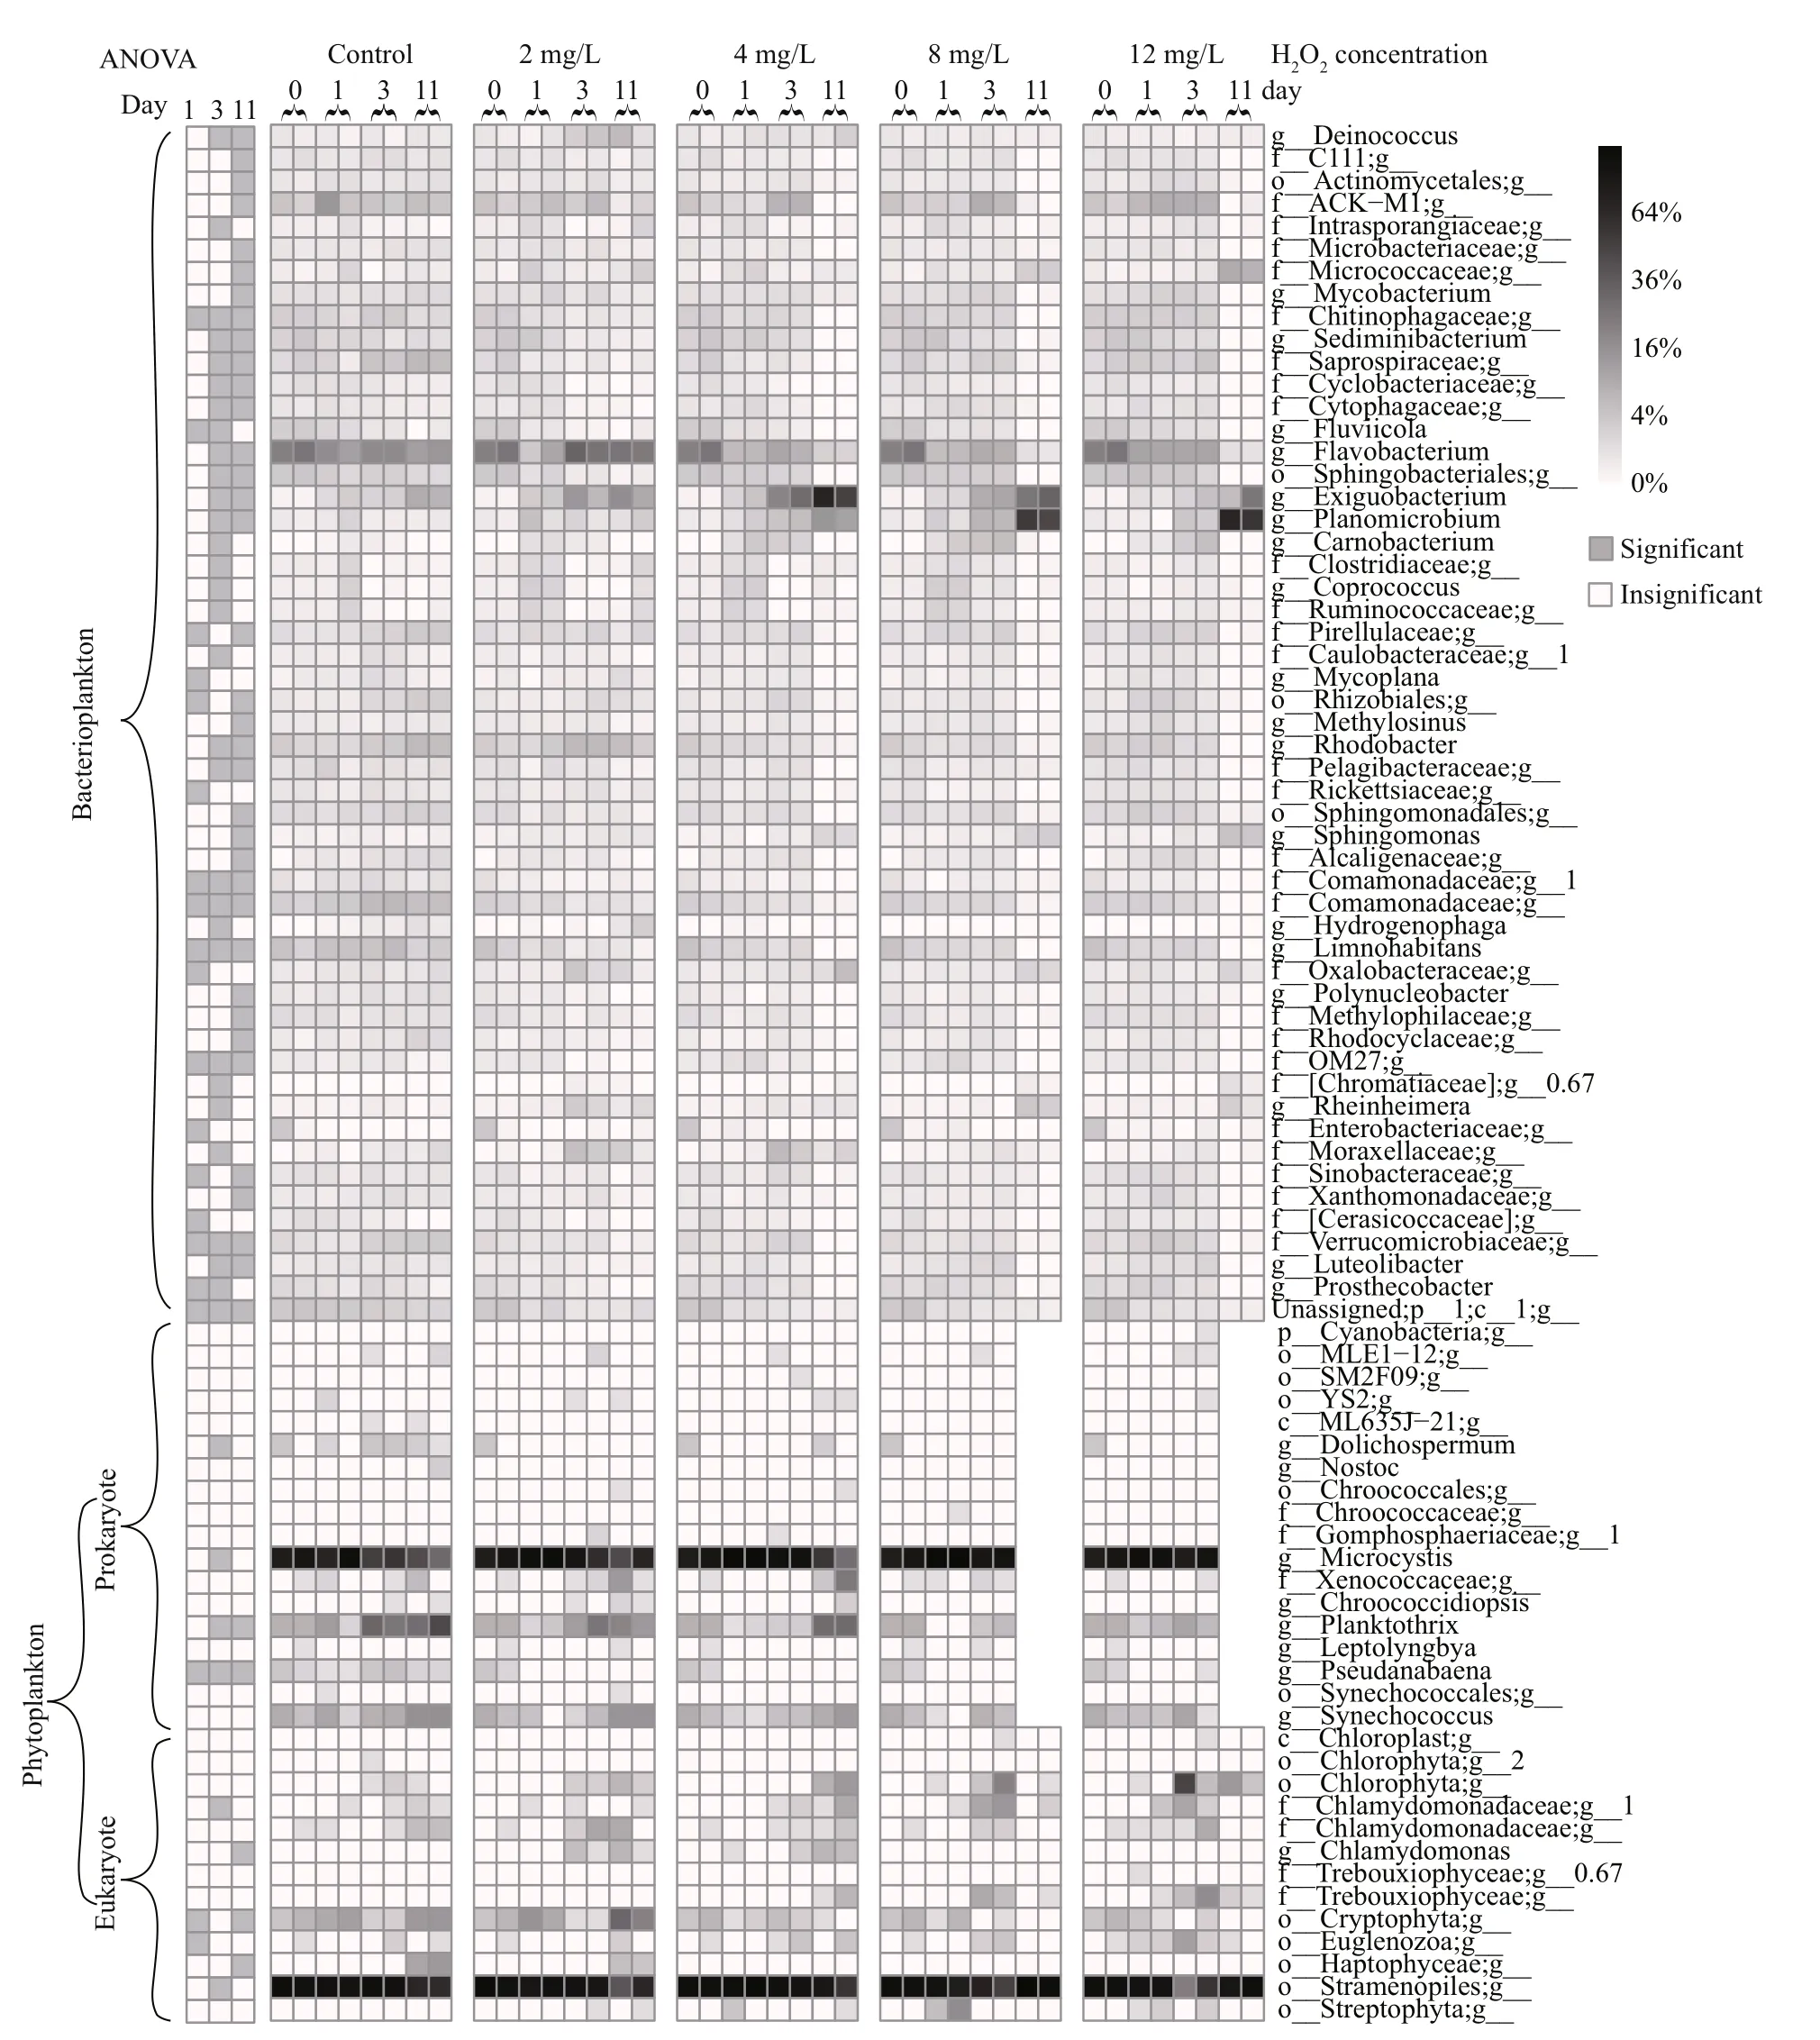
Fig.6 Community structure of bacterioplankton and phytoplankton based on the proportion of 16S rDNA amplicons
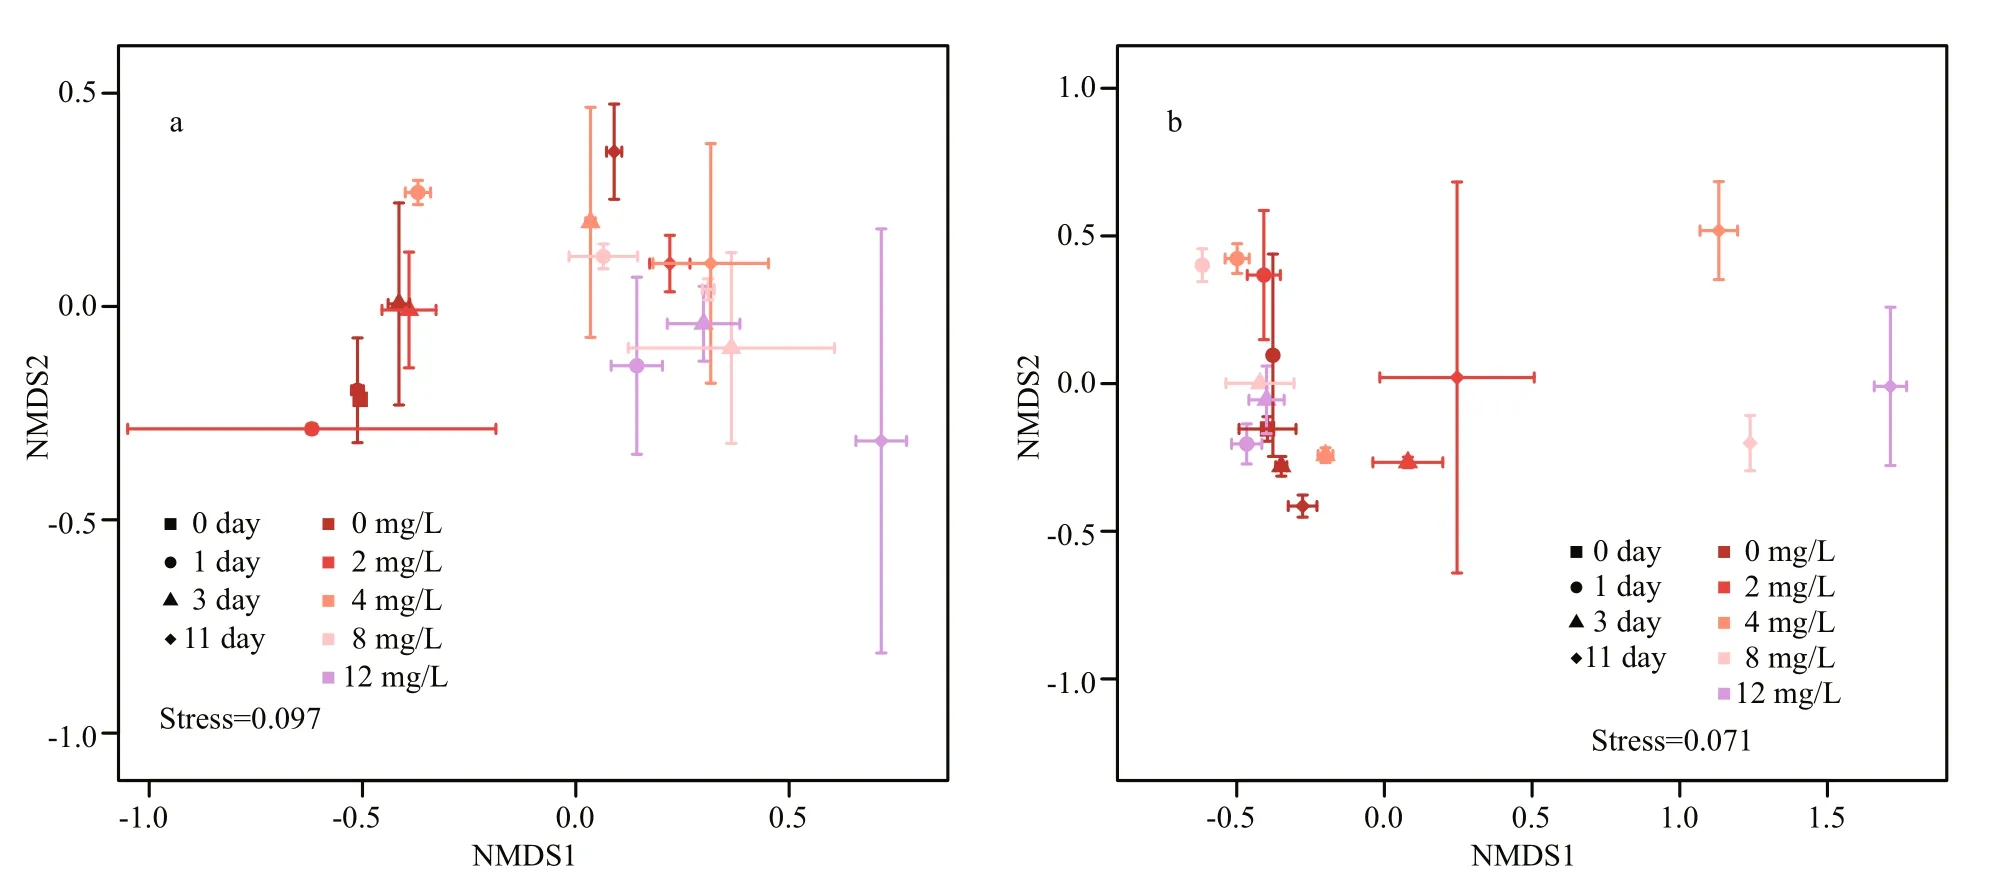
Fig.7 NMDS results of phytoplankton communities (a) and bacterioplankton communities (b) based on Bray-Curtis distance
4.2 The influence of hydrogen peroxide on bacterioplankton at the doses that effectively control Microcystis blooms
The effects of H2O2on untargeted organisms,including zooplankton, macroinvertebrates, aquatic plants, and fishes, have been studied (Matthijs et al.,2012; Reichwaldt et al., 2012; Burson et al., 2014).Applications of H2O2at the doses that are necessary to control cyanobacteria blooms are regarded safe for macroinvertebrates, aquatic plants, and fishes. While we know that some zooplankton are sensitive to H2O2at doses of 5 mg/L (Matthijs et al., 2012; Reichwaldt et al., 2012), the influence of H2O2on bacterioplankton at cyanocidal doses has not been studied. In this study,we found that the composition and abundance of bacterioplankton communities were significantly affected by H2O2treatments at the doses that are commonly used for cyanobloom control (Figs.2, 6),indicating that bacterioplankton was sensitive to H2O2.
The effect of H2O2on bacterioplankton appears to be dose dependent, and become more severe as the doses of H2O2increase. The cell density of bacterioplankton increased 2-fold after being treated for 11 days with H2O2at a concentration of 12 mg/L.The composition of bacterioplankton communities cannot recover at doses of 4 mg/L and above, which is the dose needed to controlMicrocystisblooms. Upon treatment, the proportion ofFlavobacteriumdecreased, whileExiguobacteriumandPlanomicrobiumemerged as the dominants and accounted for more than half of the bacterioplankton community. SomeExiguobacteriumspecies could produce highly active oxidoreductive enzymes and tolerant to H2O2(Takebe et al., 2007; Lee et al., 2009;Anbu et al., 2013). This might be one of the reasons whyExiguobacteriumcould survive after applications of H2O2. Additionally, phytoplankton might also influence the community structure and abundance of bacterioplankton (Casamatta and Wickstrom, 2000;Bagatini et al., 2014). In addition to the direct effect of H2O2to bacterioplankton populations, the influence of H2O2to phytoplankton might also contribute to the changes of the community structure of bacterioplankton that are subjected to H2O2.
Bacterioplankton is the major player of the freshwater ecosystem. For example, heterotrophic bacteria play an important role in the food chain betweenMicrocystisand zooplankton (de Kluijver et al., 2012). In Dianchi Lake, the high rates of nutrients cycling in the microbial loop of the food web contribute to the outbreak and persistence of cyanobacteria blooms (Shan et al., 2014). The introduction of hydrogen peroxide might disturb the community structure of bacterioplankton which in turn might change the structure and function of freshwater ecosystem. Therefore, the structure and dynamics of bacterioplankton community can be used as an indicator to assess the risks of hydrogen peroxide treatment in the lakes with cyanobloom.
5 CONCLUSION
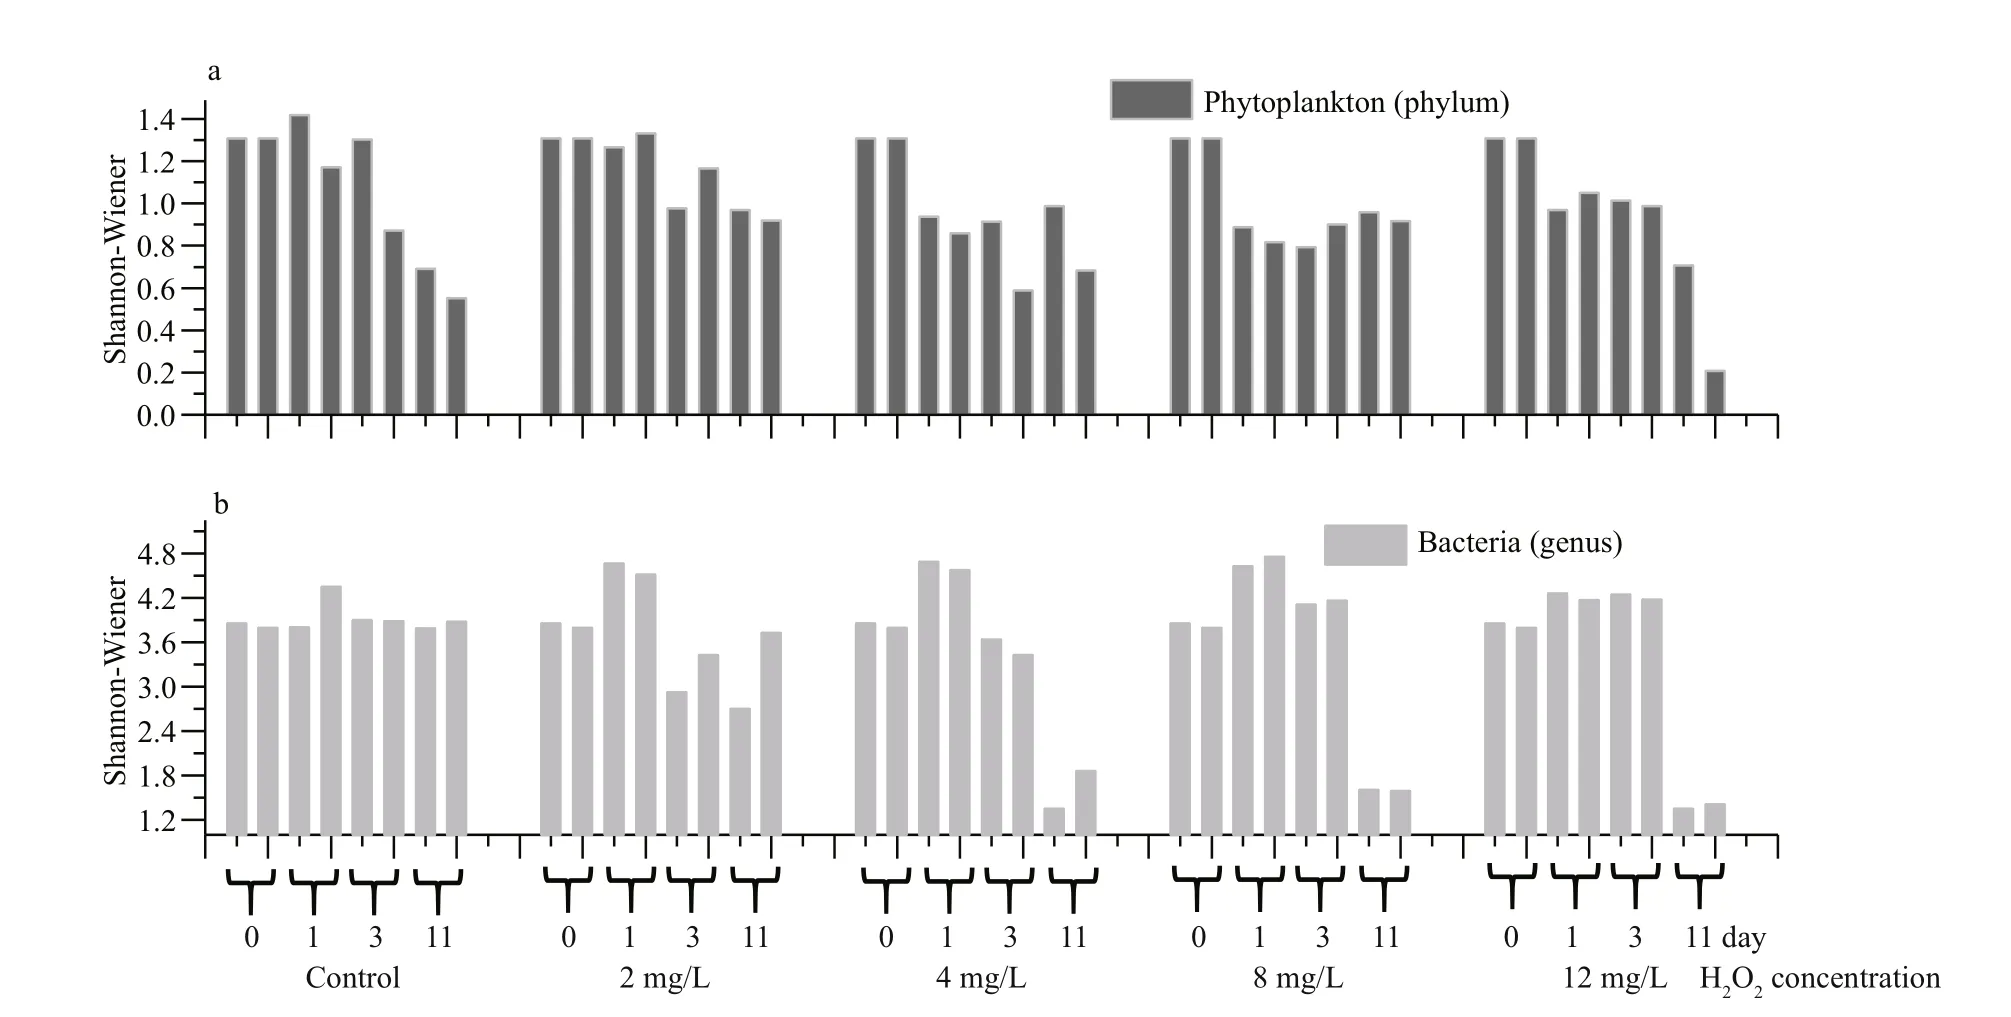
Fig.8 Changes of Shannon-Wiener index of bacterioplankton and phytoplankton during 11 days experiment
Our results showed that bacterioplanktons were more sensitive to H2O2than most eukaryote phytoplankton. Hydrogen peroxide at doses of 4 mg/L and above can change the abundance and community structure of bacterioplanktons.Firmicutes, instead ofBacteroidetesandProteobacteria, emerged as the dominant bacteria. High H2O2doses can have a negative impact on the lake ecosystem by eliminating sensitive bacteria, mainly gram negative, which are predominant in aquatic environments. High concentration of H2O2can cause “water disinfection”in which surviving gram-positive bacteria includingExiguobacteriumandPlanomicrobiummight become dominant species in H2O2treated body of water. This type of unintended changes in community structures of bacterioplankton could have a short and long term consequences to aquatic ecosystems. Thus, we suggest that bacterioplankton is a useful index for aquatic ecosystems when H2O2was used to control cyanobacteria blooms.
6 DATA AVAILABILITY STATEMENT
The datasets during and/or analyzed during the current study available from the corresponding author on reasonable request.
7 ACKNOWLEDGEMENT
We thank Prof. M. Park for his advices and editor’s suggestion of Liwen Bianji, Edanz Group China(www.liwenbianji.ac/ac) for English editing of the revised manuscript.
杂志排行

Journal of Oceanology and Limnology的其它文章
- Neuroanatomy and morphological diversity of brain cells from adult crayfish Cherax quadricarinatus*
- On the influence of season and salinity on the phenology of invertebrates in Australian saline lakes, with special reference to those of the Paroo in the semiarid inland
- Man-made plutonium radioisotopes in the salt lakes of the Crimean peninsula
- Cladophora mats in a Crimean hypersaline lake: structure,dynamics, and inhabiting animals
- Antimony speciation at the sediment-water interface of the Poyang Lake: response to seasonal variation*
- Seasonal variations of phosphorus species in the Tuohe River,China. Part I. Sediments*