The characteristic pattern of multiple colored layers in coastal stratified lakes in the process of separation from the White Sea*
2018-12-22ElenaKRASNOVADmitryMATORINTatianaBELEVICHLudmilaEFIMOVAAnastasiiaKHARCHEVANataliaKOKRYATSKAYAGalinaLOSYUKDariaTODORENKODmitryVORONOVSvetlanaPATSAEVA
Elena D. KRASNOVA , Dmitry N. MATORIN Tatiana A. BELEVICH Ludmila E. EFIMOVA , Anastasiia V. KHARCHEVA , Natalia M. KOKRYATSKAYA ,Galina N. LOSYUK , Daria A. TODORENKO Dmitry A. VORONOV ,Svetlana V. PATSAEVA
1 Biological Faculty of Lomonosov Moscow State University; Leninskye Gory, 1, bld. 12, Moscow 119234, Russia
2 Faculty of Geography, Lomonosov Moscow State University; GSP-1, Leninskye Gory, 1, Moscow 119991, Russia
3 Faculty of Physics, Lomonosov Moscow State University; Leninskye Gory, 1, Moscow 119991, Russia
4 N. Laverov Federal Center for Integrated Arctic Research, Russian Academy of Sciences; Severnoj Dviny Emb. 23, Arkhangelsk 163000, Russia
5 A. A. Kharkevich Institute for Information Transmission Problems, Russian Academy of Sciences; Bolshoy Karetny Per. 19,bld.1, Moscow 127051, Russia
6 A. N. Belozersky Institute of Physico-Chemical Biology, Lomonosov Moscow State University; Leninskye Gory, 1, Bld. 40,Moscow 119991, Russia
Abstract An unusual feature of the saline stratified lakes that were formed due to ongoing postglacial uplift on the White Sea coast is the presence of several differently colored thin layers in the zone with sharp gradients. Colored layers in five lakes at various stages of separation from the sea were investigated using optical microscopy, spectrophotometry, spectrofluorimetry, and photobiology. The upper greenish colored layer located in the aerobic strata of all lakes near the compensation depth of 1% light penetration contains green algae. In the chemocline, another layer, brightly green, red or pink, is dominated by mixotrophic flagellates. Despite the very low light intensities and the presence of H 2 S, active photosynthesis by these algae appears to be occurring, as indicated by high values of the maximum quantum yield of primary photochemistry, electron transport activity, photosynthetic activity of photosystem II, the fraction of active centers, and low values of heat dissipation. In the reduced zone of the chemocline, a dense green or brown suspension of anoxygenic phototrophs (green sulfur bacteria) is located.
Keyword: algal blooms; coastal lakes; chemocline; fluorescence kinetics; Arctic; White Sea
1 INTRODUCTION

Fig.1 Locations of the studied lakes
On the White Sea coast there are many small (1–10 ha) saline and brackish lagoons that are partly isolated from the sea. They were formed due to postglacial isostatic uplift that continues to the present, and the lakes are at various stages of separation from the sea (Krasnova et al., 2013). In the separation process, bays with low depressions are gradually transformed into coastal lakes. During the evolution from marine bay to freshwater lake, these lakes pass through a stage with strong stratification,where salty or brackish bottom water is topped by a surface stratum with lower salinity (Krasnova et al.,2015b). These lakes are classified as meromictic lakes of ectogenic origin (Hutchinson, 1937). Many well studied marine-derived meromictic lakes are located in Antarctica (Laybourn-Parry et al., 2000; Laybourn-Parry, 2002; Laybourn-Parry and Marshall, 2003;Vincent and Laybourn-Parry, 2008; Lauro et al.,2011), on the Canadian Arctic Archipelago (Ludlam,1996; Van Hove et al., 2006; Gies et al., 2014), and on the rising coast of Finland (Hakala, 2004). The remote meromictic lake Mogilnoe on Kildin Island in the Barents Sea is a well-studied Russian lake (Strelkov et al., 2014). The White Sea coast is another region with a large variety of coastal meromictic lakes at different stages of hydrological evolution. Rapid marine regression (0.4 m per 100 years on average)results in fast separation of the bays from the sea,which can be tracked during the lifetime of one researcher. The semi-isolated stage of lake development may take just a few centuries (Subetto et al., 2012). Until recently, these lakes on the White Sea coast had not been scientifically studied. Intensive studies started in 2010, with an initial focus on the geographical survey of the coast (Krasnova et al.,2013, 2015b). This survey found approximately two dozen lakes at different stages of separation from the sea, which provides a basis for future ecological succession reconstruction.
In rapidly changing ecosystems, microorganisms play leading biogeochemical roles. In separating lakes, different strata host different ecological and microbial communities (Buvalyy et al., 2015;Krasnova et al., 2015a). Among the most interesting phenomena in these White Sea lakes are colored water layers, including red, brown and green, with dense populations of phototrophic microorganisms(Krasnova et al., 2014, 2015a). Initial information about the biota of the colored layers led to the assumption that they are very similar to the deep chlorophyll maximum phenomenon (Camacho, 2006;Cullen, 2015) or to thin layers of harmful algae(Gentien et al., 2008). An unusual feature is that several differently colored layers can be found in the lake simultaneously in a single lake. In this paper we analyzed the composition of the community of photosynthetic microorganisms within the colored layers in five semi-isolated lakes, and the main environmental factors responsible for the concentration of various phototrophs in specific layers to elucidate why a particular layer is preferred as habitat or shelter for these phototrophs. To answer these questions we evaluated the physiological condition of the cells using modern biophysical methods to examine different parameters related to photosynthesis.
2 MATERIAL AND METHOD
2.1 Sampling and physicochemical measurements
Figure 1 shows the location of the studied lakes and Table 1 summarizes their properties. As is customary in studies of meromictic water bodies,measurements and sampling were taken above the maximum depth. Water samples from different horizons were collected using a Premium Submersible Pump “Whale” GP1352 (Ireland) with silicone tube and calibrated wire. Sampling was every 0.5 m from the surface to the bottom; in the chemocline, sampling frequency was increased to sample every 10 cm. The temperature and salinity were determined immediately by sampling with a WTW Cond 315i (Germany)conductometer, acidity (pH) and oxidation-reduction potential (ORP) using a WaterLiner WMM-73 (HM Digital, USA) with the corresponding electrodes; the oxygen content was measured in situ by a “MARK 302 E” oximeter (VZOR, Russia); illuminance was determined in situ with an AR813A digital luxmeter(Smart Sensor, China), modified to immerse its measuring unit under water.

Table 1 Characteristics of the studied lakes
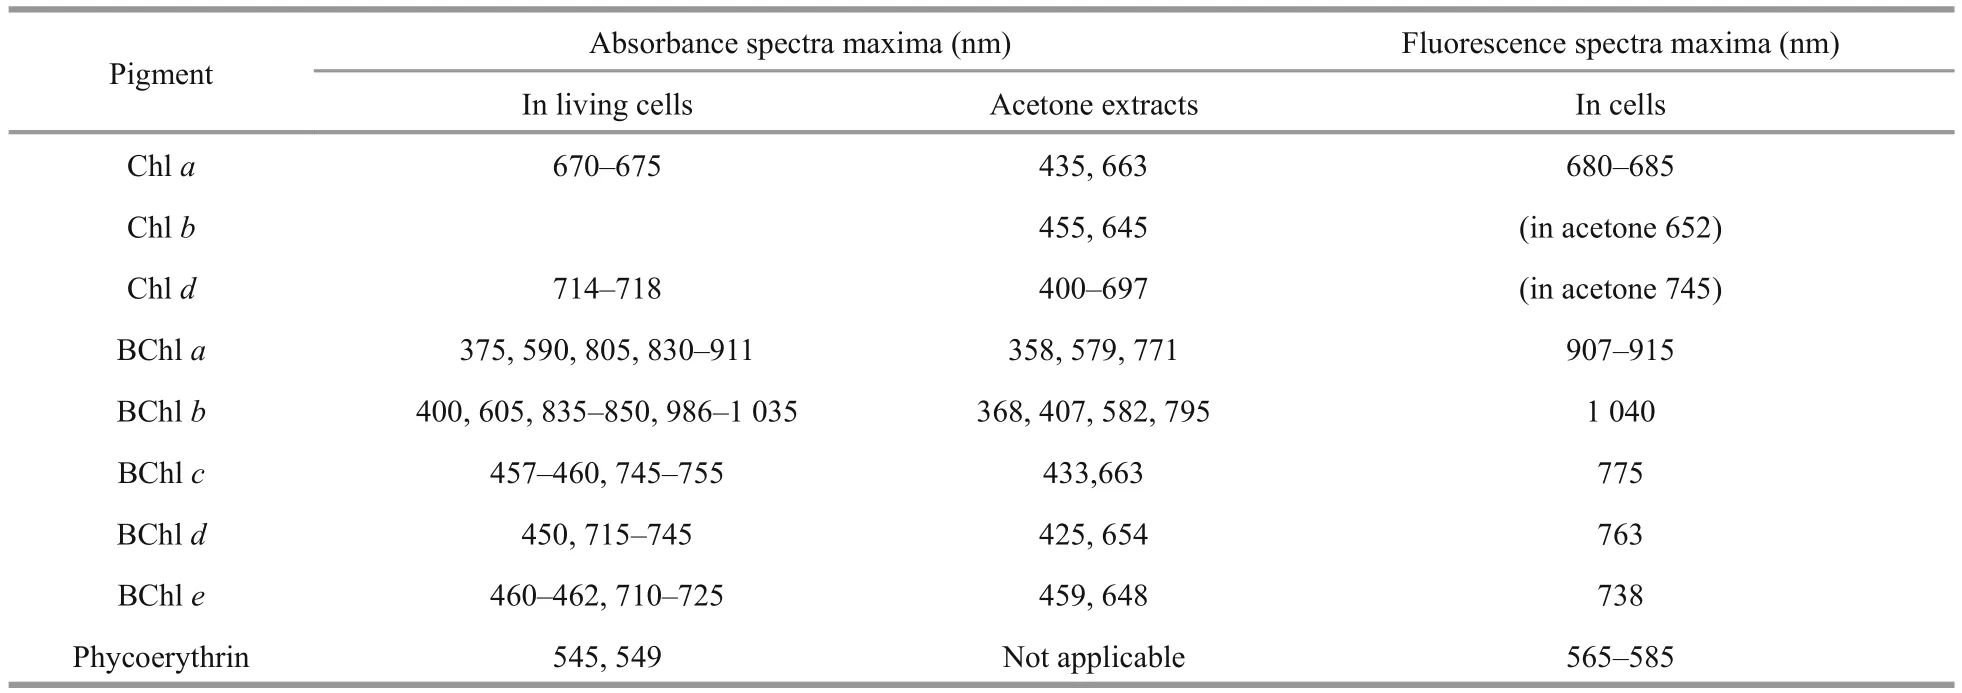
Table 2 Main absorbance and fluorescence spectral maxima of chlorophylls, bacteriochlorophylls and phycoerythin in living cells and in acetone extracts (Overmann and Garcia-Pichel, 2000; Van Der Weij et al., 2006)
In September 2013, 2014, and 2016, and in July 2014, the content of nutrients (P-PO4, Si, N-NH4) and hydrogen sulfide were determined (Sapozhnikov,2003). Although nutrients and hydrogen sulfide measurements were not synchronous with the other studies, they nevertheless characterize chemical zoning of the lakes, because stratification was consistent over the years in the studied lakes. The PO4concentration was determined by a colorimetric method that used molybdate and ascorbic acid, NH4nitrogen was determined by a reaction with phenol and hypochlorite, and Si was determined by a molybdenum blue reaction after the reduction of molybdosilicate by ascorbic acid under acidic conditions. The concentration of sulfide ions was determined by photometry with N,N-dimethyl-pphenylenediamine after pre-fixation by zinc acetate(Dubinin et al., 2012). All nutrient analyses were undertaken immediately after collection.
2.2 Spectroscopic studies
Absorption spectra were used to quickly distinguish between algae, green sulfur photosynthetic bacteria,purple sulfur bacteria, and cyanobacteria in the water layers (Table 2).
The types of pigments present in the dominant photosynthetic organisms in the layers with noticeable color were identified based on the absorption and fluorescence spectra of the water samples.Fluorescence spectra were recorded by a spectrometer Solar CM2203 with excitation at wavelengthλ=410 nm and measurement of the emission in the range of 600–820 nm. Absorption spectra were measured using a Hitachi-220 spectrophotometer equipped with 10 mm quartz cuvettes in the wavelength range of 350–910 nm. Three samples were used: 1) unfiltered water; 2) extracts prepared from the sample which was frozen to disrupt the cells,and then thawed and centrifuged to remove suspended matter; 3) acetone extracts. Spectral measurements were performed within one day after the sampling in the laboratory at room temperature.
2.3 Phytoplankton abundance and community composition
To estimate the abundance and taxonomic composition of the nano- and microphytoplankton in the colored water layers with high Chlafluorescence,50 mL of each water sample was fixed with a formalin solution (final concentration 1%). Fixed samples were assessed in a Nageotte chamber (0.05 mL volume)under a Micromed 3 (LOMO, Russia) optical microscope at 400× magnification. Three to five chambers were counted for each sample. The dimensions of cells were measured using an eyepiece micrometer. To calculate the biomass (B), the cell volume was determined by the geometric similarity method (Hillebrand et al., 1999) with subsequent conversion into carbon units in accordance with allometric relationships (Menden-Deuer and Lessard,2000). Algal species, which included Cryptophyceae and Dinophyta, were assigned as phototrophic or heterotrophic in accordance with published data(Il’yash et al., 2013).
2.4 Chlorophyll a fluorescence measurements
Chlafluorescence was measured by an Aquapen-C 100 (Photon System Instruments, Brno, Czech Republic) device. Before measurements, samples were dark-adapted for 10 min; after the adaptation,fast fluorescence kinetics were recorded for 2 s with a blue saturating light (455 nm, 1 000 μmol photons/(m2·s)). Chlafluorescence was detected by a PIN photodiode with a 667 to 750 nm bandpass filter and with maximum sensitivity in the Chlafluorescence range.
Measurements of Chlafluorescence were corrected for the presence of colored dissolved organic matter(CDOM). Correction for the fluorescence of CDOM was conducted by subtracting the fluorescence values of the water filtered through a 0.2-μm pore size filter.
The abundance of phytoplankton was evaluated by the fluorescenceF0. FluorescenceF0is proportional to the total antenna size of all the phytoplankton contained in a unit volume of water and, after calibration, correlated with the content of Chlain the cell, and can be used to evaluate the abundance of phytoplankton (Matorin et al., 2004).
The fast fluorescence kinetics (F0toFm) was recorded from 50 μs to 2 s. The fluorescence intensity at 50 μs (considered asF0), 100 μs, 300 μs, 2 ms (FJ),30 ms (FI) and maximum fluorescence (Fm=FP) were collected and used to obtain parameters, according to the JIP-test algorithm for plant and algae vitality monitoring (Strasser et al., 2004).
JIP-test parameters were referred to time zero(onset of fluorescence induction). The maximum yield of primary photochemistry of PSII was characterized byFv/Fm(=φPo) whereFvequalsFm–F0.The parameterFv/Fmwas used as a measure of maximum quantum yield of primary photochemistry according to the photosynthetic activity of phototrophs. The quantum yield of electron transport was estimated by the equationφEo=(1–F0/Fm)(1–VJ).ParameterVJis the relative variable fluorescence at the J-step and is defined asVJ=(FJ–F0)(Fm–F0); this expression is a measure of the fraction ofQB-nonreducing centers in PSII, and the efficiency of the electron transfer betweenQAandQB. The absorption of photons (ABS) per active center (RC) showing the relative antenna size (or fraction of active RC) was estimated by the ratio ABS/RC=MO(1/VJ)(1/φPo). The parameter Dl0/RC represents dissipated energy flux per RC (att=0) as Dl0/RC=(ABS/RC)–(MO(1/VJ)).The parameterMOrepresents the initial slope of fluorescence kinetics which derives from the equitationMO= 4(F300μs–F0)/Fv. The state of the phytoplankton communities and their vitality was characterized by the performance index (potential)for energy conservation from excitation to the reduction of intersystem electron acceptors as PIABS=(RC/ABS)((Fm–F0/F0)(1–VJ)/VJ) (Strasser et al., 2004). The results were statistically processed using Statistica v.6 software.
3 RESULT
3.1 Hydrological characteristics of the lakes and abiotic parameters in the colored layers

Fig.2 Vertical stratification in the studied lakes
All five of the studied lakes are stratified year round. Each lake consists of layers with different salinity, which depends on the balance between surface runoff and the time of flood tide. On one side of the scale are LZC and the KS that are influenced by high tides; on the opposite side are the lakes where most of the water comes from freshwater runoff . The catchment area influences not only the runoff volume but also the amount of humic substances, which, in its turn, determines the depth of the sunlight penetration and thus influences the distribution of photosynthetic organisms. In the paper we arrange the lakes in order by frequency of sea water incursions.
The lagoon on the Zeleny Cape (LZC) is a body of salt water 6.5 m deep. In summer, marine intrusion occurs on every high tide. An unusual feature of the lake is that the salinity is higher than in the nearby marine area, which is caused by the accumulation of brine that occurs when salt water freezes (Krasnova et al., 2015b). Another feature is the absence of freshwater inflow and water transparency.
In August 2014, the vertical stratification in LZC was typical for the end of summer. There were three colored layers: greenish, red, and grey (Fig.2a). The greenish and red layers filled the zone corresponding to the chemocline or redox zone. The greenish layer was at a depth of 4.5 m, and was characterized by microaerobic conditions withT=11.7°C,S=28.2,pH=7.6, Eh=+120 mV, without an H2S smell. The red layer was situated at a depth of 4.6–4.8 m, withT=10.8–11.3°C,S=28.2–28.3, pH=7.4–7.6, Eh=0–(+117); the conditions in this layer changed from microaerobic (3.4 mg/L) to anaerobic. The red color in this lake is caused by a cryptophyte algaeRhodomonassp. bloom (Krasnova et al., 2014). The grey layer was situated in anaerobic sulfide zone from 4.9 m to the bottom [T=8.4–9.7°C,S=28.3, pH=7.0–7.4, Eh=(-288)–(-128) mV].
According to the illuminance measurements, LZC is the most transparent among the studied lakes.About 1% of the sunlight reaches a depth of 4.5 m where the greenish layer is situated; this is exactly at the compensation point (at which the rate of photosynthesis matches the rate of respiration), which is roughly estimated as the depth of 1% of sunlight penetration. The estimated photosynthetic photon flux density (PPFD) in this layer was about 100–200 μmol/(m2·s). The subjacent red cryptophytic layer receives 0.4% of incoming radiation; in terms of photosynthesis this is below the compensation point with a PPFD of 40–60 μmol/(m2·s). The lower border of the photic zone is at 5.1 m; therefore, the upper part of the grey layer exists in photic conditions, and its lower part is in the dark.
Lake Kislo-Sladkoe (KS) is a 4.5-m deep salty lagoon with sea water intrusions several days per month at the time of spring syzygial tides. Surface water salinity to a depth of 1 m is lower than in the deeper water mass because of the fresh runoff from the catchment. In KS we discovered three colored layers: 1) a light green layer at a depth of 1.5 m; 2) a red layer in the chemocline at 2.2 m; 3) a greenishgray layer at the 2.4–2.5 m area (Fig.2b). The light green layer was characterized byT=21.6°C,S=22.1, a maximum pH=8.3 indicating active CO2assimilation,and Eh=+206. The high content of oxygen, up to 11 mg/L or 121% saturation, was a consequence of the oxygenic photosynthesis. The red layer (T=18.2°C,S=23.7) was associated with the chemocline, where Eh values change from positive to negative and microaerobic conditions (less than 1 mg/L) change to anaerobic. Similar to the LZC, the red color is formed by the cryptophyte flagellateRhodomonassp.
According to illuminance measurements, 50%–70% of the sunlight in KS is dissipated in the first 1 m near the surface. On a sunny day 13% of the surface light reaches the light green water layer at 1.5 m. The layer with theRhodomonassp. bloom was situated at the compensation point with 1% of the solar energy.The estimated PPFD in this layer is about 20–40 μmol/(m2·s). The cryptophytic layer absorbed¾ of the remaining light, so the greenish-gray layer underneath exists in the dark. The environment in the greenish-gray layer isT=16.2;S=23.8; pH=7.3; Eh=-212 mV.
Lake Elovoe (EL) is a meromictic 5.5 m deep lake that is connected with the sea via seepage through a rocky dam. The surface stratum is fresh; salt water is located below 2 m depth. There were two colored layers in the lake (Fig.2c): green at 2.4–2.7 m in an aerobic zone (T=15.5–16.2°C,S=23.0–23.1, pH=7.7–8.1, Eh=109–117 mV, 109–117 mg/L O2) and a turbid brown layer in the chemocline at 2.9–3 m [T=13.6–13.8°C,S=23.3, pH=7.1, Eh=(-261)–(-269) mV]. The brown color is due to brown-colored green sulfur bacteria (Kharcheva et al., 2015; Krasnova et al.,2015a).
According to the illuminance measurements in EL,80% of solar energy is dissipated in the 0.5 m surface layer. The compensation point is situated at a depth of 2.7 m, so the green layer at 2.4–2.7 m is in a well illuminated zone. The turbid brown layer gets a small amount of light; in cloudy weather less than 1 μmol/(m2·s) is available there.
Lake Nizhnee Ershovskoe (NE) is a 2.8-m deep lake with the largest catchment area among the studied lakes. NE consists of two strata: the upper fresh and the bottom brackish. There were two colored layers with phototrophs in this lake water (Fig.2d): a slightly pink layer was found at a depth of 2.4 m in the chemocline zone (T=13.3°C,S=402 μS, pH=7.5,Eh=+119 mV, 3 mg/L O2) and a turbid green layer in an anaerobic zone at a depth of 2.5–2.6 m [T=13.2–13.3°C,S=1.8–3.3, pH=6.8–7.0, Eh=(-292)–(-330) mV]. The green color is caused by dense suspension of green sulfur bacteria (Kharcheva et al.,2015; Krasnova et al., 2015a). The compensation point in this lake was at a depth of 2.1 m. Both pink algal and green bacterial layers were below it in shadowed conditions, with the illuminance is close to zero in cloudy weather.
Lake Trekhtzvetnoe (TR) is a 7.5-m deep meromictic lake with fresh 1.5 m deep mixolomnion and salt monimolimnion separated by a thin chemocline with sharp gradients. In the bottom water the temperature and salinity are constant during the year (Krasnova et al., 2013, 2015b). At the interface between fresh and salt water at the depth of 1.6–1.7 m,a slightly green water layer was found, and at 1.9–2.0 m a turbid green layer appeared (Fig.2e). The upper slightly green layer corresponded to a brackish zone, highly saturated with oxygen (T=14.2–14.7°C,S=3.3–6.1, pH=9.3–9.5, Eh=101–102 mV, 19–21 mg/L O2). The turbid green layer matched the chemocline [T=13.9–14.4°C,S=10.9–12.6, pH=7.1–7.2, Eh=(+93)–(-169) mV]. Below the redox boundary green sulfur bacteria form a dense suspension throughout the year (Kharcheva et al., 2015).
According to the illuminance measurements, in TR 80% of the light dissipates near the top 0.5 m. The 1%light threshold is at a depth of 1.6 m. Therefore, both colored layers are below the compensation point. Just 0.04% of the light penetrates to the chemocline (less than 1 μmol/(m2·s)); this remaining light is completely absorbed by the turbid green layer.
All five lakes consist of aerobic (mixolimnion) and anaerobic (monimolimnion) strata, with a chemocline in between. H2S in solution in the form of sulfides and hydrosulfides was recorded from the chemocline zone to the bottom, where it reached a maximum (Table 3). In some cases, small concentrations of H2S were even detected in the aerobic stratum. Coexistence of oxygen and H2S is possible, such as in the case of microstratification inside of organic microaggregations. Microorganisms that form a dense suspension around the oxic-anoxic interface have to be resistant to sulfide, or benefit from H2S like sulfur bacteria.

Table 3 Vertical distribution of nutrients (P-PO 4, Si and N-NH 4) and H 2 S in the studied lakes
Among the studied lakes, the highest concentration of H2S was in TR. Its meromictic structure is favorable for sulfide accumulation in the monimolimnion produced by bacterial sulfate reduction due to a sufficiency of organic matter and sulfate. The concentration of the sulfide ions increased from the chemocline towards the bottom, where it reached maximum values up to 670 mg/L. These concentrations are significantly higher than in anaerobic waters of the Black Sea (9.6 mg/L; Neklyudov et al., 2006) and the Norwegian fjord Framavaren (204 mg/L; Behnke et al., 2006).
The level of inorganic phosphorus in the surface aerobic strata was minimal (less than 60 μg P/L) in all investigated lakes regardless of the salinity. The amount of phosphate greatly increased in the chemocline (Table 3). In EL, the maximum phosphate concentration was recorded in the chemocline,whereas in the other lakes the accumulation of phosphates was near the bottom. The monimolimnion of meromictic TR was the most enriched with mineral phosphorus.
The NH4concentration was very low near the surface (0–5.8 μg N/L) and in the bottom water (0–10.3 μg N/L), except for the surface of LZK (19.5 μg N/L) and EL (200 μg N/L). An important chemical feature of the investigated lakes was the peak of N-NH4content in the oxic-anoxic interface due to active destruction of organic matter.
The concentration of dissolved Si was minimal near the surface. The maximum amount of Si was usually detected in the chemocline, while the overall trend was a gradual increase from the chemocline towards the bottom.
Nutrient concentrations in the aerobic strata of the studied lakes are close to their mean annual concentration in surface waters of the fresh lakes in Karelia (Shaporenko et al., 2005; Moiseenko and Gashkina, 2010; Kokryatskaya et al., 2012). The accumulation of the nutrients below the chemocline is determined by mineralization of sunken organic matter and a lack of consuming organisms. A local ammonium maximum in the chemocline can arise as a result of a microbial bloom.
3.2 Spectroscopic studies
In the surface water layer of LZC fluorescence under excitation with 410 nm light was practically absent. High fluorescent peaks were found in the samples from the green aerobic (4.5 m), red cryptophytic (4.8 m), and anaerobic grey bottom strata (Suppl. Fig.1, Table 4). In the samples from 4.5 m and 4.8 m depth, the maximum emission range was located at 684–688 nm, indicating the presence of microalgae that contained Chla; its concentration was higher in the cryptophytic layer. There were two fluorescent peaks in the grey bottom stratum. One was located at 674–677 nm, which is indicative of spectra of samples with green sulfur bacteria (He et al., 2014). A second band was located in the infrared range on 748–750 nm, corresponding to bacteriochlorophyll (BChl) of green sulfur bacteria.
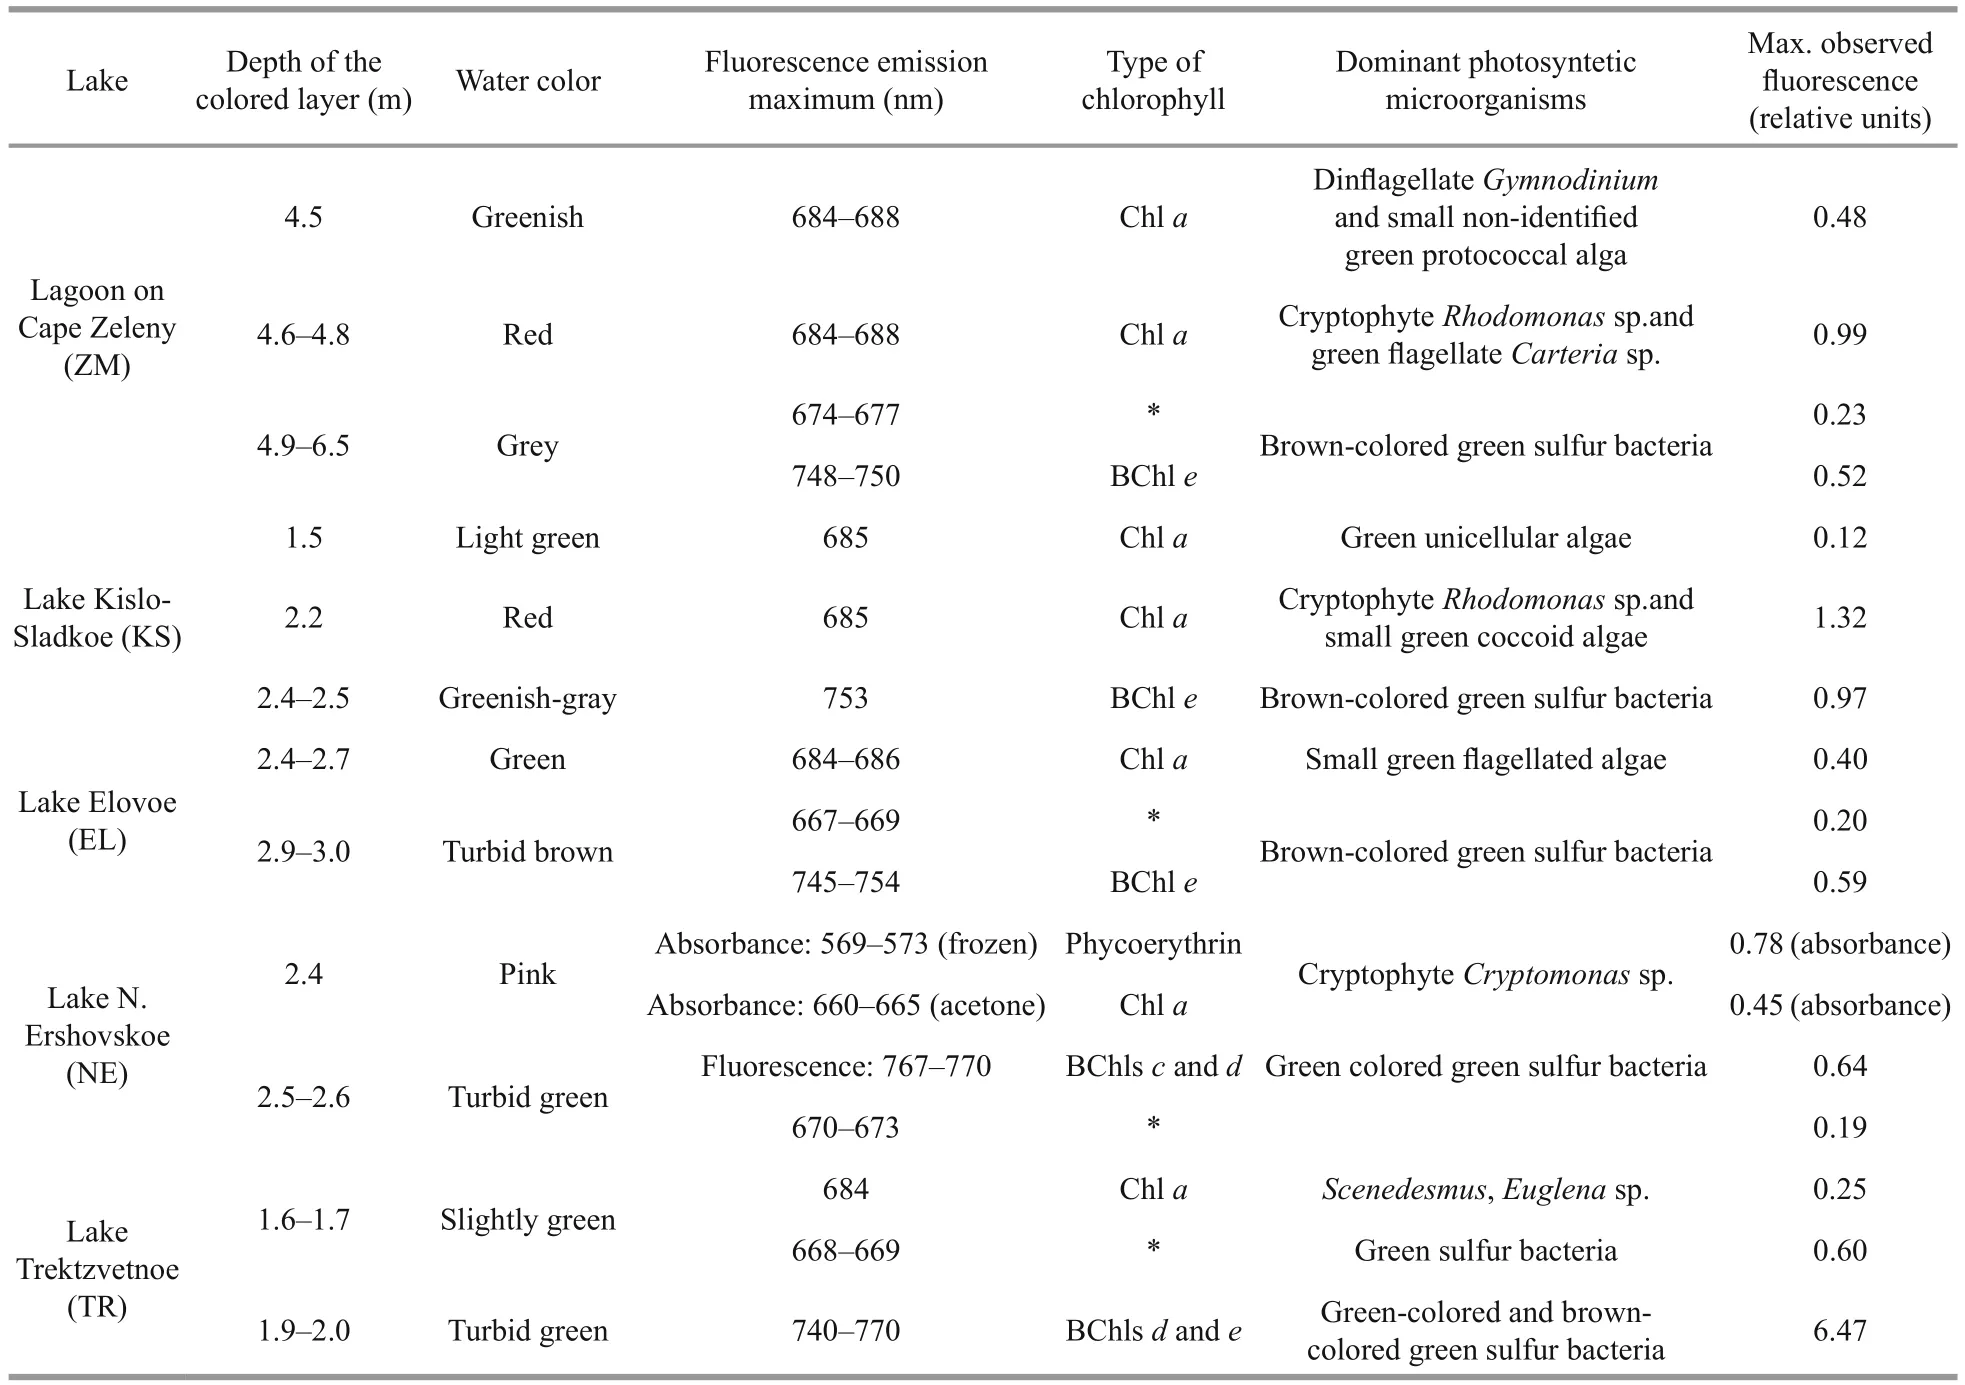
Table 4 Phototrophic microorganisms dominating different colored layers in the lakes, as determined by spectroscopic data and light microscopy
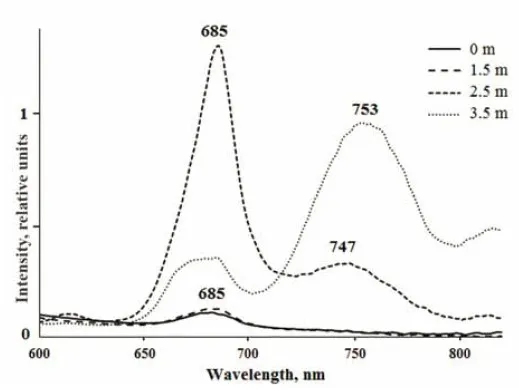
In KS, the surface layer and green layer at a depth of 1.5 m were characterized by low fluorescence in the red region, with a maximum at 685 nm which is characteristic of Chla(Table 4, Suppl. Fig.2). Bands at the same emission wavelength were detected in the red cryptophytic layer (2.2 m) and in the bottom anaerobic water (3.5 m). The most intense fluorescence was detected in the cryptophytic layer, where an additional emission peak at 747 nm was also found.The emission band with a maximum wavelength of 753 nm was also present in the bottom greenish-gray water, which is characteristic of the bacteriochlorophylls of green sulfur bacteria.
In EL, near the surface where most of the light is absorbed, no fluorescence of photosynthetic pigments was registered (Table 4, Suppl. Fig.3). In the green layer (2.4–2.7 m), the maximum fluorescence was at 684–686 nm, corresponding to Chla. At a depth of 2.8 m, a second fluorescence peak at 749–753 nm corresponded to BChl of green sulfur bacteria. In the turbid brown layer at 3 m depth, this second peak was three times higher, indicating a high number of these microorganisms. In this layer, an additional fluorescence band at 667–669 nm appeared, due to green sulfur bacteria (Kharcheva et al., 2015).
In NE, at a depth of 2.4 m where the water had a pink color, the composition of photosynthetic pigments was measured with spectrophotometric methods. To destroy the cells and release pigments to the sample of water, cells were subjected to sequential freeze-thawing, followed by centrifugation. A distinct pink color appeared in the supernatant, with absorption peaks at 569–573, 666–687, and 718–724 nm(Table 4, Suppl. Fig.4a). The first peak was the highest; it corresponds to phycoerythrin, which gives the color to the pinkish layer above the chemocline in NE. A Chlaabsorbance band was registered in the acetone extract (Suppl. Fig.4b). The underlying turbid green water layer is characterized by two fluorescence peaks at 767–770 nm and 670–673 nm, which is typical for green sulfur bacteria.

Table 5 Phytoplankton abundance ( N sum, ×10 6 cells/L) and biomass ( В sum, mg C/L), and the dominant species and their contribution to the total biomass (%) in the colored layers with high Chl a fluorescence
The various layers in TR differ significantly in their fluorescence spectra (Table 4, Suppl. Fig.5). In the surface layer (0 m), which absorbed more than 80%of the light, a small fluorescent peak at a wavelength of 687 nm, characteristic of Chla, was detected. In the greenish aerobic layer (1.6 m) a fluorescence peak at 668–669 nm was recorded; this peak is often indicative of photosynthetic sulfur bacteria. The exact source of this peak is yet unknown; it may be due to the destruction of anoxic phototrophic cells, or perhaps the fluorescence is derived from bacteriochlorophyll degradation products after the death of anaerobic sulfuric bacteria following contact with oxygen. Another possible interpretation of the fluorescence peak at 668–669 nm is a presence of chlorophyllides, which characterize some Euglenales species under certain conditions (Pancaldi et al.,2002). The same peak also appeared in the lower anaerobic zone (5 m), where much more intense bands of live green sulfur bacteria cells were seen. In the turbid green layer with green sulfur bacteria, a high fluorescence band in the area corresponding to the emission of molecules of BChlsc,dandeat 740–770 nm was detected.
None of the lakes there were indications of a mass development of purple sulfur bacteria, which,according to the pigment characteristics, would have to be located above the layer of green microorganisms(Suppl. Fig.6a, b). Neither water samples from the red layer nor the acetone extracts had absorption bands in far-red and infrared region characteristic of these microorganisms. In previous studies in 2012–2013,we found purple bacteria in the chemocline zone of KS, but even then they were a minor group (Lunina et al., 2016).
3.3 Phytoplankton abundance and composition
The abundance and composition of the phytoplankton community varied significantly in the colored water layers (Table 5).
Phytoplankton sampling in the LZC was performed in two layers—the greenish aerobic layer at a depth of 4.5 m and the red layer in the chemocline at a depth of 4.8 m. In both layers, the species diversity of the phytoplankton community was very poor, being represented by a few algal species. In the upper greenish layer, dinoflagellates of the genusGymnodiniumand a small non-identified protococcal alga dominated. Their contributions to the total abundance were 41% and 30%, respectively. The heterotrophic dinoflagellateOxyrrhismarinawas the major contributor to the total biomass—over 75%.This alga is fairly flexible in selecting food objects—from bacteria (<1 μm) and small algae (Flynn et al.,1996; Hansen et al., 1996; Jeong et al., 2008) to large dinoflagellates such asGyrodiniumspirale(Hansen,1992). They frequently accompany the blooming ofRhodomonasand actively feed onRhodomonas. In the samples from the chemocline,O.marinausually had a number of red inclusions with a bright orange fluorescence, characteristic of cryptophyte algae. At the depth of 4.8 m, the abundance ofGymnodiniumsp. decreased, andO.marinaoccurred only individually. In terms of abundance and biomass, two algal species dominated:Rhodomonassp., classCryptophyceae, whose mass blooming is characteristic in this basin (Krasnova et al., 2014), andCarteriasp.,classChlorophyceae. The members of the genusCarteriafrequently live in habitats with high trophic characteristics (John et al., 2002), which agrees with their existence in the chemocline of LZC. Their joint contribution to the total abundance and biomass of phytoplankton was 80% for both parameters.Additionally, the marine cyanobacteriumRaphidiopsissp. was found in the chemocline. No living cells of phototrophic eukaryotes were found in the grey bottom water layer.
In KS, the aerobic greenish water layer at the depth of 1.5 m was inhabited by small unidentified unicellular flagellate and coccoid algae. Phytoplankton of the red water layer in the chemocline was represented by the cryptophyte algaeRhodomonassp., as in previous years (Krasnova et al., 2014, 2015a), and by small green coccoid algae. The greenish-gray anaerobic water layer contained no living phytoplankton.
In EL, at a depth of 2.7 m, where a small fluorescence peak of Chlawas recorded,phytoplankton was represented exclusively by small flagellated alga (2–3 μm) belonging to theChlorophyta. Initially we identified these as cf.Micromonassp.; further identification is only possible by molecular methods. According to visual observations, the maximum density of the algae was recorded in the studied layer; its density sharply decreased with depth and it completely disappeared at 2.9 m. The layers below 2.9 m were brown due to a green sulfur bacterium of the familyChlorobiaceaeand infusorians.
In NE, the pink layer above the border between fresh and saline water at a depth of 2.4 m was dominated by a cryptophyte alga of the genusCryptomonas. Its contribution to the total abundance and biomass was 90% and 98%, respectively. In addition, phytoplankton were represented by freshwater green algae (Monoraphidiumcontortum,Monoraphidiumminutum, andScenedesmus quadricauda), and also marine and freshwater diatoms:Ankistrodesmussp.,Coelastrumastrodeum,Monoraphidiumarcuatum,M.contortum,M.minutum,Scenedesmusfalcatus,S.quadricauda,Scenedesmussp., andTetraëdrontriangulare.Visually, the thickness of the cryptophytic layer did not exceed 0.1 m. At a depth of 2.5–2.6 m the color sharply changed to turbid green, H2S smell appeared,and the phytoplankton disappeared.
In TR, in the slightly green layer situated in the upper part of the chemocline at a depth of 1.6–1.7 m,where conditions were still aerobic/microaerobic, the phytoplankton community was mainly represented by freshwater forms. The abundance and biomass of phytoplankton were the lowest among all studied lakes (Table 5). As for the number of species, green algae dominated (12 species). In addition, there were diatoms (3 species),Chrysophyceae(1 species;Dinobryonbelgica) andEuglenozoa(1 species;Euglenasp.). The species composition of green algae was represented byAnkistrodesmussp.,Coelastrum astrodeum,M.contortum,M.minutum,Monoraphidium arcuatum,S.quadricauda,Scenedesmusfalcatus,Scenedesmussp., andTetraëdrontriangulare. The species composition of the diatoms was represented by the marine speciesThalassionemanitzschioidesand the genusNitzschiasp.
Algae of the genusScenedesmuswere most abundant; its contribution to the total abundance was 40%. In terms of biomass,Euglenasp. dominated, as its contribution to the total biomass exceeded 50%. At a depth of 1.9 m the aerobic environment was replaced by an anaerobic environment and the turbid green layer contained a high amount of hydrogen sulfide.There was no phytoplankton in this layer.
3.4 Chlorophyll a fluorescence measurements
All five lakes were characterized by an uneven vertical distribution of fluorescence parametersF0andFv/Fmat different depths (Fig.3). The vertical distribution ofF0in all stratified lakes showed a high correlation with the amplitude of the Chlafluorescence maximum (686–695 nm) in the measured fluorescence spectra.F0was low in the surface layers and increased with depth. The concentration of Chlain the upper colorless layer of the lake LZC and KS was 1–2 μg/L.Such values of Chlacorrespond to the values in open waters of the Kandalaksha Gulf (White Sea) during the same season (Il’yash et al., 2013). In the lakes where green or greenish layers exist within the aerobic zone, the parametersF0andFv/Fmslightly increased(1.5–5 times). In all five lakes,F0andFv/Fmreached a maximum in the chemocline zone. Accordingly, the amount of Chlawas higher in the chemocline than in the upper layers, and reached a maximum value 2.5 mg/L.

Fig.3 Abundance (F0) and photosynthetic activity (Fv/Fm) of phytoplankton at different depths of the stratified lakes
In the surface layers, theFv/Fmratio did not exceed 0.1–0.3. The low values ofFv/Fmmay have been due to non-optimal growth conditions associated with a deficiency in mineral nutrients (see hydrochemical data, Table 3) and partial photoinhibition of PSII during this period in the surface waters (Il’yash et al.,2013). In the chemocline of LZK, KS (red layers with cryptophytesRhodomonassp.) and NE (pink layer with the cryptophyteCryptomonas),Fv/Fmvalues increased significantly, reaching a maximum level of 0.70–0.77. Such values are among the highestFv/Fmvalues observed in microalgae cultures (Falkowski and Raven, 2007). In the lakes where the chemocline was colored green byEuglenasp. and other unicellular algae (EL and TR),Fv/Fmwas about 0.5–0.56. In the sulfide zone beneath the chemoclineFv/Fmdeclined sharply, so the grey and greenish-gray layers in the anaerobic zone of ZM and KS and the turbid brown and turbid green of EL, NE and TZ have no active phytoplankton.
Chlafluorescence is used as an indicator of the physiological state of photosynthetic organisms(Matorin et al., 2013). The Chlafluorescence rise,measured in phytoplankton in stratified lakes, showed the typical OJIP transients, which reflect different redox processes of the photosynthetic electron transport chain. To obtain further biophysical information on the phytoplankton in the different water layers, we analyzed the OJIP transients according to the JIP-test (Strasser et al., 2004) (Table 6).
The quantum yield of electron transport (φEo) of the phytoplankton from the chemocline was higher than of the surface phytoplankton. A decreased theφEovalue of the surface phytoplankton indicates the slowing down of electron flow in PSII further QA–. Examination of the specific flux per RC showed an increase in ABS/RC value in the surface phytoplankton due to inactivation of RCs. Dissipated energy flux per RC (Dl0/RC) (att=0) was lower in phytoplankton from the chemocline zone, while Dl0/RC was enhanced in surface phytoplankton because of increasing the rate of energy dissipation into heat.Cryptophytes, which form red and pink layers in the chemocline zone of three lakes (LZK, KS and NE),were characterized by a higher maximum quantum yield of primary photochemistry (φPo=Fv/Fm), higher activity of electron transport (φEo) and photosynthetic performance of absorbed energy (PIABS) (1.2–4.2)than the cells of green algae andEuglenawhich form greenish layers in the chemocline of the other two lakes (EL and TR). The specific fluxes per RC(ABS/RC, Dl0/RC) were higher in the layers with green algae in the chemocline zone of the EL and TR due to the inactivation of some RCs (increase in ABS/RC) and high energy dissipation (increase in Dl0/RC). At the same time, Cryptophytes had a higher fraction of active RCs (decrease in ABS/RC) and lower energy dissipation (decrease in Dl0/RC).
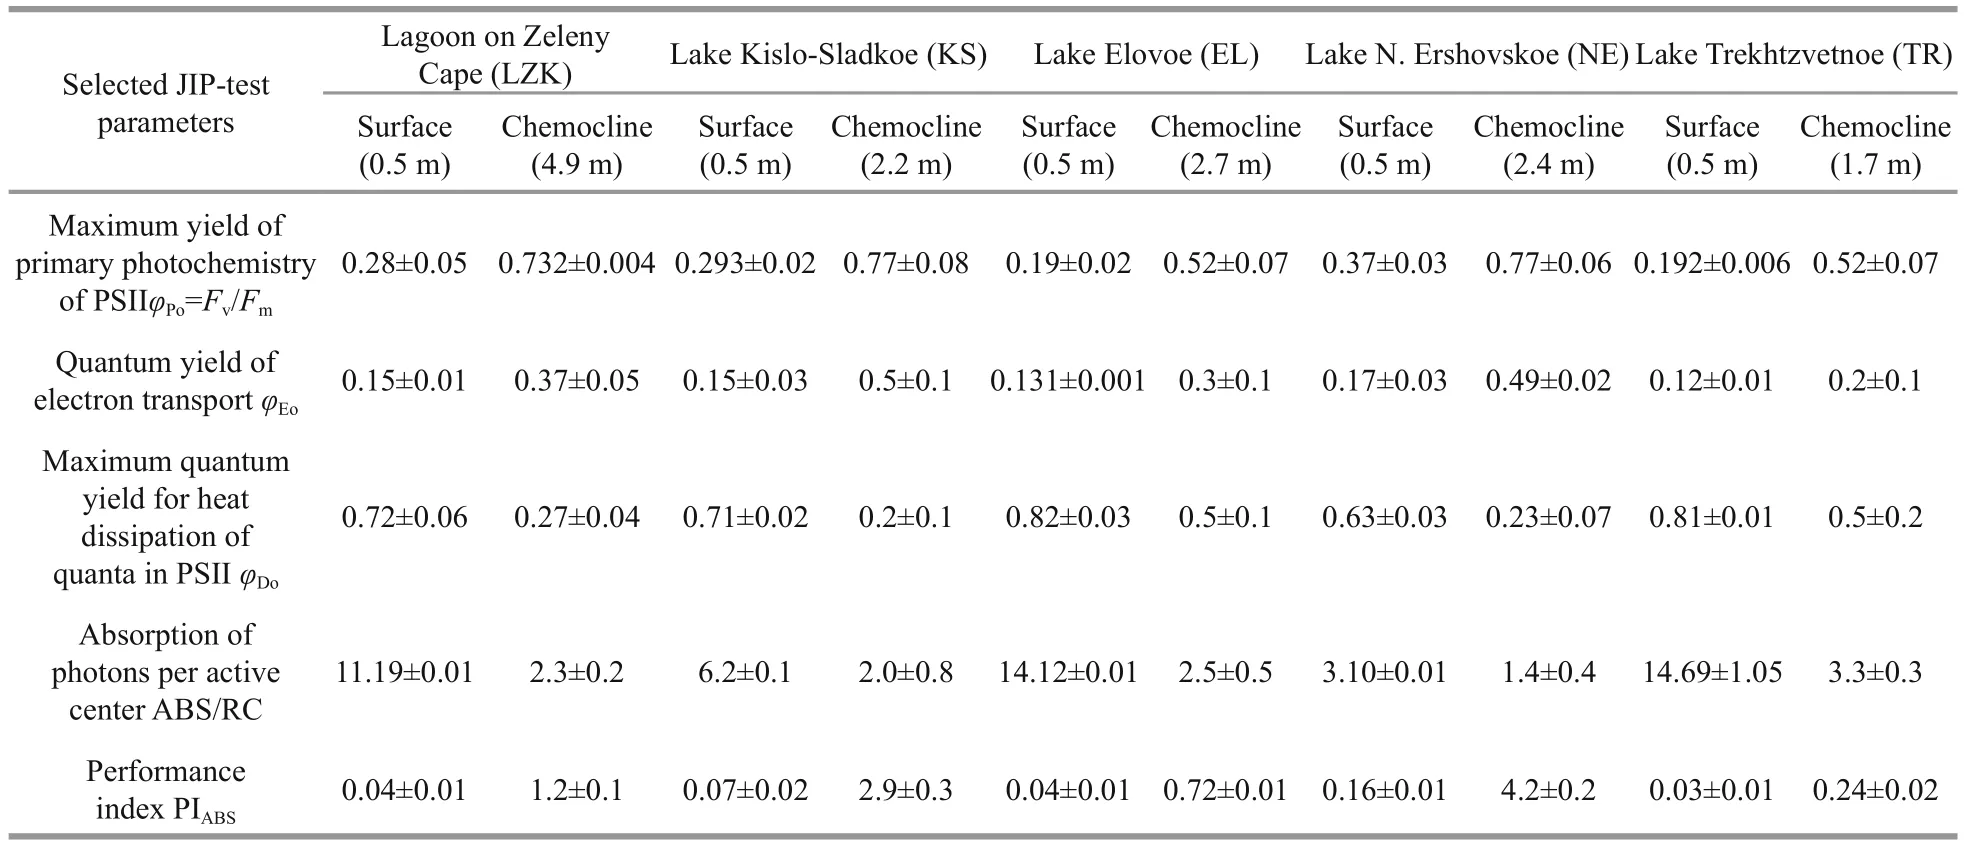
Table 6 JIP-test parameters estimated with Aquapen-C 100 in phytoplankton of stratified lakes on the White Sea coast
4 DISCUSSION
Colored layers with a high concentration of phototrophic organisms substantially contribute to primary production of entire aquatic ecosystems, and influence the structure of the food web. Often they are formed by prokaryotes, including purple and green sulfur bacteria (Gorlenko et al., 1978; Overmann et al., 1991; Nakajima et al., 2004; Tonolla et al., 2004;Kondo et al., 2009; Rogozin et al., 2010; Lauro et al.,2011; Mori et al., 2013), or by algae, which can form a deep chlorophyll maximum in marine environments(Anderson, 1969; Hamilton et al., 2010) as well as in freshwater lakes (Camacho, 2006; Simmonds et al.,2015). The leading factors influencing the appearance of a deep chlorophyll maximum were reviewed in detail by Camacho (2006). Occurrence of thin layers with algal blooms in stratified marine systems, their oceanographic causes, and the life strategies of the algae and the physical-biological interactions were discussed by the participants of the Global Ecology and Oceanography of Harmful Algal Blooms program(Gentien et al., 2008). Mixotrophic organisms are often involved in the formation of deep chlorophyll maxima; this is due to their physiological features and the favorable environment (Gervais, 1998; Laybourn-Parry et al., 2000; Laybourn-Parry, 2002; Laybourn-Parry and Marshall, 2003; Clegg et al., 2012).
In the White Sea coastal stratified lakes we see similar layers formed by phototrophic organisms that favor abiotic gradients. It is interesting that in these lakes two or three differently colored layers are present simultaneously. These can belong to the following categories: 1) greenish oxygenic phototrophic algae with Chla(mostly green algae,Chlorophytes, or phototrophic dinoflagellates) in the lower part of the aerobic zone; 2) red, pink or greenish mixotrophic unicellular organisms in the chemocline above the oxic-anoxic interface (different species of Cryptophytes orEuglena), 3) turbid green or brown high-density culture of anoxygenic phototrophs(green sulfur bacteria) below the boundary between oxidized and reduced environments; 4) grey or greenish-grey bottom water with green sulfur bacteria and their decay products. The position of the layers and their environment are determined by the vertical physical and chemical stratification in the lakes.
In all five lakes, phytoplankton was most abundant in the chemocline, which is characterized by sharp gradients of physico-chemical indices. A zone with a high content of oxygen and the hydrosulfuric zone are only 10–30 cm distant from each other. According to quantitative parameters, the phytoplankton abundance in the chemocline can be estimated as moderate and intensive blooming, and in KS as hyper-blooming.That layer also accounted for a peak of Chlafluorescence, a high maximum quantum yield of primary photochemistry, activity of electron transport and photosynthetic performance of PSII, as well as low heat dissipation. Cryptophytes are especially well adapted to the layers demonstrating the highest values of the measured parameters of Chlafluorescence.The quantum yield of primary photochemistry in the layers dominated by cryptophytes was 0.70–0.77,which are similar to the maximal values determined in algal cultures (Falkowski and Raven, 2007). The layer with the dominance of the mixotrophic algae microorganisms such asRhodomonassp.,Cryptomonassp. andEuglenasp. is typical for the coastal lakes separated from the White Sea. This layer is always located close to the level of zero Eh or overlaps it. The only lake without a mixotrophic algae layer is EL; however, this niche seems to be occupied by ciliates that are especially numerous in the chemocline of this lake (Krasnova et al., 2015a), and many of them have photosynthetic endosymbionts.
The lower part of the chemocline is a habitat for anoxygenic phototrophs-green sulfur bacteria.Stratified lakes are inhabited by different groups of green sulfur bacteria with different spectral properties.A maximum fluorescence at 765–770 nm following excitation at 410 nm is typical for green colored bacteria; emission at 735–740 nm characterizes brown colored ones. The width and the height of an integrated fluorescence band depend on their ratio(Orf and Blankenship, 2013; Kharcheva et al., 2016).
The most intriguing feature of the vertical distribution of the phototrophs in the salt lakes separated from the White Sea is an algal bloom at the chemocline. The question must therefore be asked what factors permit photosynthetic organisms to proliferate in such great abundance and why in this particular layer.
Light is essential for photosynthesis. In the studied lakes, 50%–90% of the solar energy is dissipated in the surface stratum where phototrophs are few.According to illuminance measurements, just 1%–10% of sunlight reaches the upper colored layer with abundant green algae; the colored layer with mixotrophic organisms is situated close to the compensation depth. Nevertheless, the environment is favorable for them. While in the surface waters we registered photoinhibition of PSII and enhanced quantum heat dissipation, in the chemocline these parameters indicate optimal physiological status of the phytoplankton. Green sulfur bacteria exist in very shadowed conditions, just tenths and hundredths of a percent of the surface sunlight reaches their layer. The other factor favoring the habitation of photosynthetic microbes is the high concentration of biogenic elements in the chemocline, which serve as a nutricline between surface water which is limited by low nutrient concentrations and the lower levels which are limited by light. In the studied lakes this is true not only for algae but also for anoxygenic phototrophic bacteria.
The toxicity of sulfide to oxygenic phototrophs affects the diversity of the algae near the chemocline to only a few dominating species which account for 50%–100% of the phytoplankton biomass. The mixotrophic flagellatesRhodomonassp.,Cryptomonassp., andEuglenasp. in the studied lakes seem to be resistant to H2S. We are not the first to notice active photosynthesis in a sulfide environment:strains of cyanobacteria are able to photosynthesize at low concentrations of hydrogen sulfide (Weller et al.,1975; Oren et al., 1979; Castenholz and Utkilen,1984; Okada et al., 2007). The heterotrophic dinoflagellateO.marinaencountered in the chemocline of LZC and KS is able to live in the presence of hydrogen sulfide (Altenbach et al., 2012),which enables that predator to use food resources in the chemocline inaccessible to obligate aerobes.
Of particular interest is the close proximity of the mixotrophic layer and the layer of anoxigenic autotrophs. Previously, we assumed that mixotrophs can swallow bacteria or assimilate the products of their vital activity. However, chlorophyllafluorescence parameters in the mixotrophic layer indicate effective photosynthesis, rather than saprotrophic nutrition. This problem requires further study, but at this stage we are inclined to think that mixotrophs are attracted to the redox interface by upward diffusion of nutrients. The role of sulfur bacteria is that they catch the hydrogen sulfide coming from below, and make oxygenic photosynthesis possible in the overlying layer.
5 CONCLUSION
1. The typical hydrological structure of the studied coastal lakes at different stages of separation from the sea consists of 5 strata: 1) a surface stratum with lower salinity than that of the remaining water column, 2) a pycnocline, 3) a saline aerobic intermediate layer, 4) the chemocline, 5) anaerobic bottom water.
2. The position of the colored layers and their properties are determined by the vertical physical and chemical stratification in the lakes: 1) near the compensation depth a greenish layer is found with abundant phytoplankton; 2) a red, pink or greenish layer of mixotrophic microorganisms is situated in the chemocline above the oxic-anoxic interface; 3) below the boundary between oxidized and reduced environments a turbid green or brown high-density bloom of anoxygenic phototrophs appears; 4) the bottom water is colored grey or greenish-grey by green sulfur bacteria and their decay products.
3. The maximum density of the phototrophs appears in the chemocline, at the boundary of aerobic and anoxic waters. Their environment is characterized by low illuminance (below the compensation depth of 1% of sunlight penetration), high nutrient concentrations, and low concentrations of H2S.
4. In the chemocline, the photosynthetic apparatus of the phototrophs is characterized by high values of the maximum quantum yield of primary photochemistry(φPo=Fv/Fm), the activity of electron transport (φEo), the photosynthetic performance of PSII (PIABS), the fraction of the active centers (ABS/RC), and by low values of heat dissipation (φDo).
5. Analysis of the biophysical parameters shows that in the chemocline environment the functional status of the cryptophyte algae photosynthetic apparatus is more efficient than that of the green algae, allowing them to effectively photosynthesize below the compensation depth.
6. The high intensity of photosynthesis in the mixotrophic layer suggests that mixotrophs provide phototrophic type of nutrition, rather than a saprotrophic one. The role of the bacterial layer is to catch the hydrogen sulfide and keep the overlying layer of water safe for oxygenic photosynthesis.
Electronic supplementary material
Supplementary material (Supplementary Figs.1–6) is available in the online version of this article at https://doi.org/10.1007/s00343-018-7323-2.
The characteristic pattern of multiple colored layers in coastal stratified lakes in the process of separation from the White Sea
Elena D. KRASNOVA1, Dmitry N. MATORIN1, Tatiana A. BELEVICH1, Ludmila E. EFIMOVA2, Anastasiia V.KHARCHEVA3, Natalia M. KOKRYATSKAYA4, Galina N. LOSYUK4, Daria A. TODORENKO1, Dmitry A.VORONOV5,6, Svetlana V. PATSAEVA3
Supporting information

Suppl.1 Fluorescence emission spectra of water samples from LZC excited with 410 nm wavelength light
Suppl. 2 Fluorescence emission spectra from water samples from KS excited with 410 nm light

Suppl. 3 1Fluorescence emission spectra from water samples from EL excited with 410 nm light
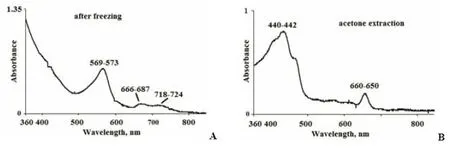
Suppl. 4 The absorption spectra in NE from a depth of 2.4 m: A - in the water solution after destruction of the cells by freezethaw, B - in the acetone extract

Suppl.5 Fluorescence emission spectra in water samples from TR after excitation with 410 nm light

Suppl.6 The absorption spectra in KS from a depth of 2.2 m: A – in the water sample, B – in the acetone extract. No band of the bacteriochlorophyll a was registered which indicates the absence of purple sulfur bacteria in the red laye r
杂志排行
Journal of Oceanology and Limnology的其它文章
- Neuroanatomy and morphological diversity of brain cells from adult crayfish Cherax quadricarinatus*
- On the influence of season and salinity on the phenology of invertebrates in Australian saline lakes, with special reference to those of the Paroo in the semiarid inland
- Man-made plutonium radioisotopes in the salt lakes of the Crimean peninsula
- Cladophora mats in a Crimean hypersaline lake: structure,dynamics, and inhabiting animals
- Antimony speciation at the sediment-water interface of the Poyang Lake: response to seasonal variation*
- Seasonal variations of phosphorus species in the Tuohe River,China. Part I. Sediments*