A Dual-spline Approach to Load Error Repair in a HEMS Sensor Network
2018-11-29XiaodongLiuandQiLiu
Xiaodong Liuand Qi Liu,
Abstract: In a home energy management system (HEMS), appliances are becoming diversified and intelligent, so that certain simple maintenance work can be completed by appliances themselves. During the measurement, collection and transmission of electricity load data in a HEMS sensor network, however, problems can be caused on the data due to faulty sensing processes and/or lost links, etc. In order to ensure the quality of retrieved load data, different solutions have been presented, but suffered from low recognition rates and high complexity. In this paper, a validation and repair method is presented to detect potential failures and errors in a domestic energy management system,which can then recover determined load errors and losses. A Kernel Extreme Learning Machine (K-ELM) based model has been employed with a Radial Basis Function (RBF)and optimised parameters for verification and recognition; whilst a Dual-spline method is presented to repair missing load data. According to the experiment results, the method outperforms the traditional B-spline and Cubic-spline methods and can effectively deal with unexpected data losses and errors under variant loss rates in a practical home environment.
Keywords: Electric load data analysis, home energy management, quality assurance and control.
1 Introduction
In recent years, Home Energy Management Systems (HEMS) become increasingly popular due to its features of cross-disciplinary, compatibility and interoperable [Lee,Hsiao, Huang et al. (2016)]. It can be well integrated with Smart Home [Shah, Khalid,Zafar et al. (2017)], Industrial Automation [Lin and Tsai (2014)] and Smart Grid [Lin and Tsai (2014)]. Investigation is also widely made with Cyber Physical Systems [Cintuglu,Mohammed, Akkaya et al. (2017)], Cloud Computing [Sanislav, Zeadally and Mois(2017)] and Big Data Analytics [Sheng, Zhao, Zhang et al. (2016)].
Monitoring and management of electric power consumption is one of the most concerned scenarios for demand side management of Smart Grid [Kumar, Singh, Zeadally et al.(2017); Kumar, Zeadally and Misra (2016)], where the collection, process and analysis of power load data are not only conducive to the industry, but to the end-consumers as well,e.g. in the cases of smart home, home energy management systems, etc. In a domestic environment, however, present home energy systems suffer from accuracy and stability of collected data, especially in those wireless solutions. According Aloulou et al.[Aloulou, Mokhtari, Tiberghien et al. (2015)], certain factors in the process of data perception and transmission may cause data missing and/or errors, including the failure of meters, battery shortage, communication failure and other reasons.
At present, different methods have been proposed to perform outlier detect and load data repair [Liang, Zhao, Luo et al. (2017)], but few of them focus on load error repair in a domestic environment, where solving missing and/or error data meets following challenges. First, there are no effective solutions when a large portion of data is missing.In addition, it is difficult to know in a domestic area whether relatively large deviation from a gathering point (e.g. a socket) reports an error or an unusual situation (e.g. another appliance being plugged). Finally, the uncertainty of retrieved data caused by changing behaviours due to energy consumption from different occupants, or even from the same one who has different regularity under unexpected circumstances.
In this paper, a method is proposed to detect and fix potential errors of collected load data in a domestic environment. A data verification method to eliminate the hardware failure is firstly presented to ensure no failure data being collected. It then examines the periodicity of data and detects potential errors by focusing on the uncertainty of energy consumption activities with robustness to data loss rates. A Dual-spline method is further designed to fix the missing data in a domestic energy management system.
The remainder of this paper is organized into five sections. Related work on error detection and repair is reviewed in Section II. In Section III, problem definition and preliminaries of core algorithms manipulated in our approach are introduced. Section IV explains the proposed method to achieve detection and repair of missing/error load data in a domestic environment. Results are presented and evaluated in Section V with comparison of corresponding algorithms. Finally, Section VI concludes and identifies future work.
2 Related works
Related work has been performed in the area of anomaly detection, which was extensively investigated using data mining and statistics models. Dean and Dixon proposed a Dixon’s Q test, using differences between observation and neighbours divided by a data range as Q values [Dean and Dixon (1951)]. It was then compared with corresponding sampling space with a confidence threshold to detect abnormal values.However, the method can only detect exceptions in a small data set. Grubbs [Grubbs(1969)] examined the differences between attribute means and observation by the standard deviation of attributes as Z-values, which was then compared with a 1% to 5%significance level. This method does not require any input parameters but is sensitive to the number of samples. The higher number of samples it has, the more representative. In Chandola et al. [Chandola, Banerjee and Kumar (2009)], a box-plot method was reviewed by adding and subtracting 1.5 times of upper and lower quartiles respectively as confidence intervals. Data beyond the scope were regarded as abnormal ones. In Weron[Weron (2006)], it assumed that a sequence period was given, so mean and median values at the corresponding time points in another period can be used to replace errors or lost values. The mean values, however, were easily affected by extreme values; whereas the median was not representative for the data. A concept of portrait dataset was proposed,segmenting datasets into a portrait dataset in Tang et al. [Tang, Wu, Lei et al. (2014)],where it assumed that the examined data followed probability distribution, which can be used to estimate and replace outliers. All above statistical methods have tried to find certain distribution in a dataset for outlier detection and further repair.
Time-series relative algorithms, e.g. an Auto-Regressive Moving Average (ARMA)model were also used for error repair. For example, outliers were simulated in a time series, so approximate distribution of the sequence was taken into account with statistical variables to detect the outliers [Ro, Zou, Wang et al. (2015)]. In Ljung [Ljung (1993)],the estimation and detection of outliers in a time series were proposed by Gaussian ARMA processes, which indicated that cumulative outliers were directly related to missing observations and could be detected using likelihood ratios and anomalous scores.However, ARMA-based models assume fixed time series, which is not suitable for domestic load data. Furthermore, historical data is used in an ARMA model for the prediction of future retrieved data along its time series; however, a data repair approach looks forward to discovery and correction of potential errors in a historical dataset. The fact that predictive models assume historical data are correct makes them inapplicable to error detection and fixing in a practical scenario. In addition, traditional statistical methods and ARMA-based models require large-scale reference data for better performance, which makes them not applicable to those scenarios where a large percentage of data is missing.
Data mining algorithms were also investigated for data repair, where the attribute of distance has been mainly used for outlier detection. In Ramaswamy et al. [Ramaswamy,Rastogi and Shim (2000)], a K-Nearest Neighbours (KNN) algorithm was employed to detect outliers, where an outlier could be recognised if n-1 points were closer to a pre-set point m. However, the method suffers high time complexity, resulting in poor performance when the number of neighbours increases. A K-means based method was specified in Aggarwal [Aggarwal (2015)] to classify data into a number of groups and iterate them to calculate distances between the centre and data points of each group. All points that are outside pre-defined clusters were then recognised as errors. Compared with the KNN solution, the K-means based work reduces the volume by dividing data into several clusters, and therefore effectively downgrades its computational complexity.A weighted KNN-based method was presented in Hilla et al. [Hilla and Minsker (2010)],which calculated weighted distances to identify outliers. An RNN model was proposed to calculate the outliers of data points [Hawkins, He, Williams et al. (2002)]. More usage of such methods can be found in Salvador et al. [Salvador and Chan (2005); Jones, Nikovski,Imamura et al. (2016); Aghabozorgi, Shirkhorshidi and Wah (2015); Gupta, Gao,Aggarwal et al. (2014)]. These methods calculated abnormal scores according to the distances between structured relational data to determine potential outliers, which are not applicable to practical domestic energy management cases.
Recent relevant research work has been undertaken on smoothing techniques. A nonparametric regression method was proposed in Chen et al. [Chen, Li, Lau et al. (2010)]based on kernel smoothing and B-spline smoothing algorithms, where an outlier was determined depending on confidence intervals of corresponding perception. In Guo et al.[Guo, Li, Lau et al. (2012)], a periodicity function was pre-defined to determine potential errors. It however requires prior knowledge of data periodicity and its period length,which is complicated to implement in a domestic HEMS environment.
All solutions examined above tries to find certain regularity in their retrieved data,whereas in a domestic scenario, randomness is an inevitable feature due to complexity of gathering processes of home appliances and diversity of human activities. A Dual-spline approach is therefore presented in this paper to adapt the uncertainty, which is detailed in the following sections.
3 Preliminaries
3.1 Definition of load errors
In a practical domestic energy management environment, energy consumption is collected at a given frequency, such as once a second or once a minute. Retrieved load data include energy usage of entire home and each appliance, which therefore implies consumers’ daily behaviour and habits. The quality of the retrieved data is influenced from multiple factors, such as meter malfunctions, communication failures, and/or even behaviour changes.
Hardware malfunctions in a HEMS system happen, but within a reasonable range. Smart sockets used in this paper, for instance, fulfil the requirements of 50/60 Hz IEC 687/1036 standard, which have their error rate within 0.2%.
In addition, energy data in this paper have been perceived and collected via a wireless sensor network, which suffer from data missing due to communication failures.
In terms of behaviour changes of consumers, an adaptive method is needed to gratify the diversity and uncertainty. For example, a household member always goes home for dinner, but decides to have dinner outside tonight. Such a scenario may cause an outlier using traditional methods, whereas so-called casual patterns happen quite often in a modern family.
Consideration above implies following definition on load data.
Definition 1: Load data can be time-series and denoted as, that is an-value sequence ordered by time, whererepresents thethtimestamp, andis the perceived value at.
3.2 A Kernel-based extreme learning machine model
The Extreme Learning Machine (ELM) algorithm was presented as a Single-hidden Layer Feedforward Neural network (SLFN) for faster training speed maintaining with high accuracy [Huang, Zhou, Ding et al. (2012)]. A typical L hidden neurons ELM model can be depicted in Eq. (1).

Kernel-based Extreme Learning Machine (K-ELM) was presented for the improvement of stability and generalisation performance over the ELM model [Lam and Wunsch(2017)]. A K-ELM algorithm requires no configuration on the number of neurons and the types of activation function but needs to provide a kernel function. In this paper, a Radial Basis Function (RBF) has been employed to conduct the verification of potential load errors, as shown in Eq. (2).

4 The proposed dual-spline approach
A Dual-spline solution is proposed in this section to adapt randomness caused by domestic users and to achieve accurate detection and error repair of load data retrieved in a domestic energy management environment.
4.1 System construction
The domestic energy management system established in this paper consists of a collecting gateway for remote communication with servers and local collection of load data, a CT clamp to gather total energy consumption, and multiple smart sockets to monitor the consumption of appliances. The entire system structure deployed in a domestic environment is depicted in Fig. 1. WiFi is employed to enable a star-topology wireless communication between the gateway and appliances.
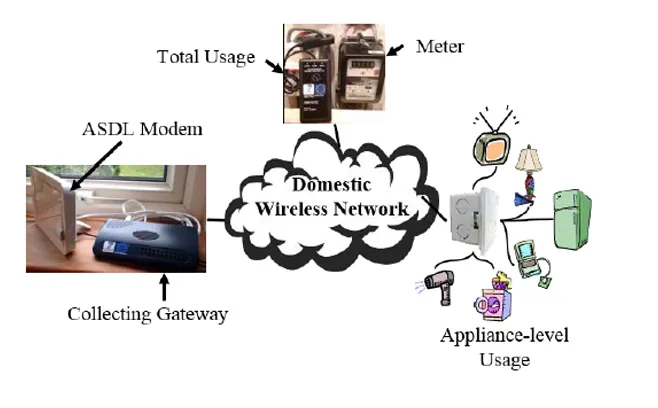
Figure 1: Domestic energy management system
4.2 Analysis of load data characteristics
A general domestic power line is a typical parallel circuit. Eq. (3) can therefore be used to describe the relation between the total power consumption of the examined flat and the power of each sub-terminal appliance consumes.

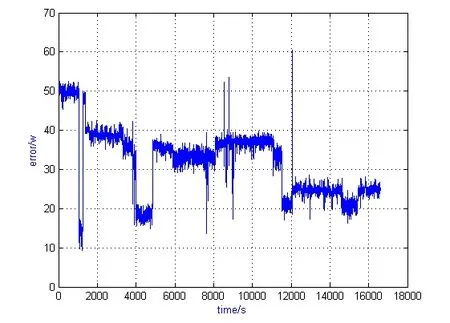
Figure 2: Power line losses in a practical HEMS environment
When all electrical appliances are working properly, the error ε represents the power difference between the total bus power and the consumption of all branches. In this case,major factors affectingare run-time loads of working appliances. According to Fig. 2, it can be seen that the errorkeeps stable when working appliances are constant. After sampling, an ELM-based neural network is proposed to learn and predict the trend of.
4.3 Verification of load data
After collecting the consumption of the total power and all appliances, according to (1),we can get run-time errors . In addition, predicted errorscan be calculated via the ELM regression. If the difference between a predicted error and the actual one is higher than a predefined thresholdand occurs 10 times, wrong data could be found.Algorithm 1 gives detailed steps to verify and locate potential outliers.
The verification algorithm above detects passible outliers generated by AC current sensors and/or other integrated hardware at the perception stage. Alternatively, load errors, e.g. energy data losses at the communication stage and other outliers due to behaviour changes of households will be taken into account in next section.
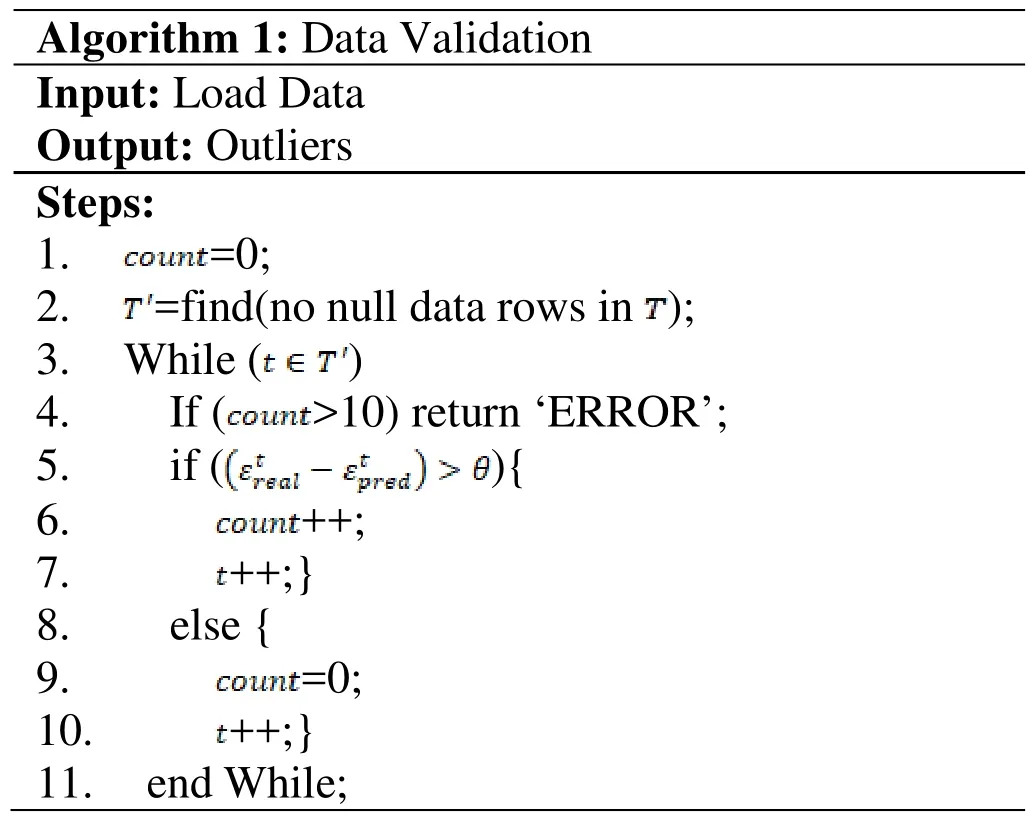
Algorithm 1: Data Validation Input: Load Data Output: Outliers Steps:1.=0;2.=find(no null data rows in);3. While ()4. If (>10) return ‘ERROR’;5. if (){6.++;7.++;}8. else {9.=0;10.++;}11. end While;
4.4 Repair processes of load errors
After collecting the consumption of the total power and all appliances, according to (1),we can get run-time errors. In addition, predicted errorscan be calculated via the ELM regression. If the difference between a predicted error and the actual one is higher than a predefined thresholdand occurs 10 times, wrong data could be found.Algorithm 1 gives detailed steps to verify and locate potential outliers.
1) B-spline method
Given a set of load data samples, data collection processes can be defined in(4):


In general, it is necessary to find an estimate functionto conduct local averaging procedures, or non-parametric regression. In a domestic case, the curve can be approximated as in (10):

2) Cubic-spline method
a) In every sampling interval,is a cubic polynomial;

If only one appliance reading is lost, it can be repaired following (12), according to (3):

Errors from multiple appliances
If more than one appliance has data losses detected, a dual-spline repair algorithm is proposed, combining two fitting curve methods to fit load curve data. Two situations need to be considered:
a) Two fitting curves are both located above or below the real value, while one of them is closer to the real one;
b) Two fitting curves are located with the real value in between.
A hybrid curve fitting method called Dual-spline is therefore employed in this paper to repair data losses from multiple appliances. The Dual-spline algorithm pseudo code is described in Algorithm 2.
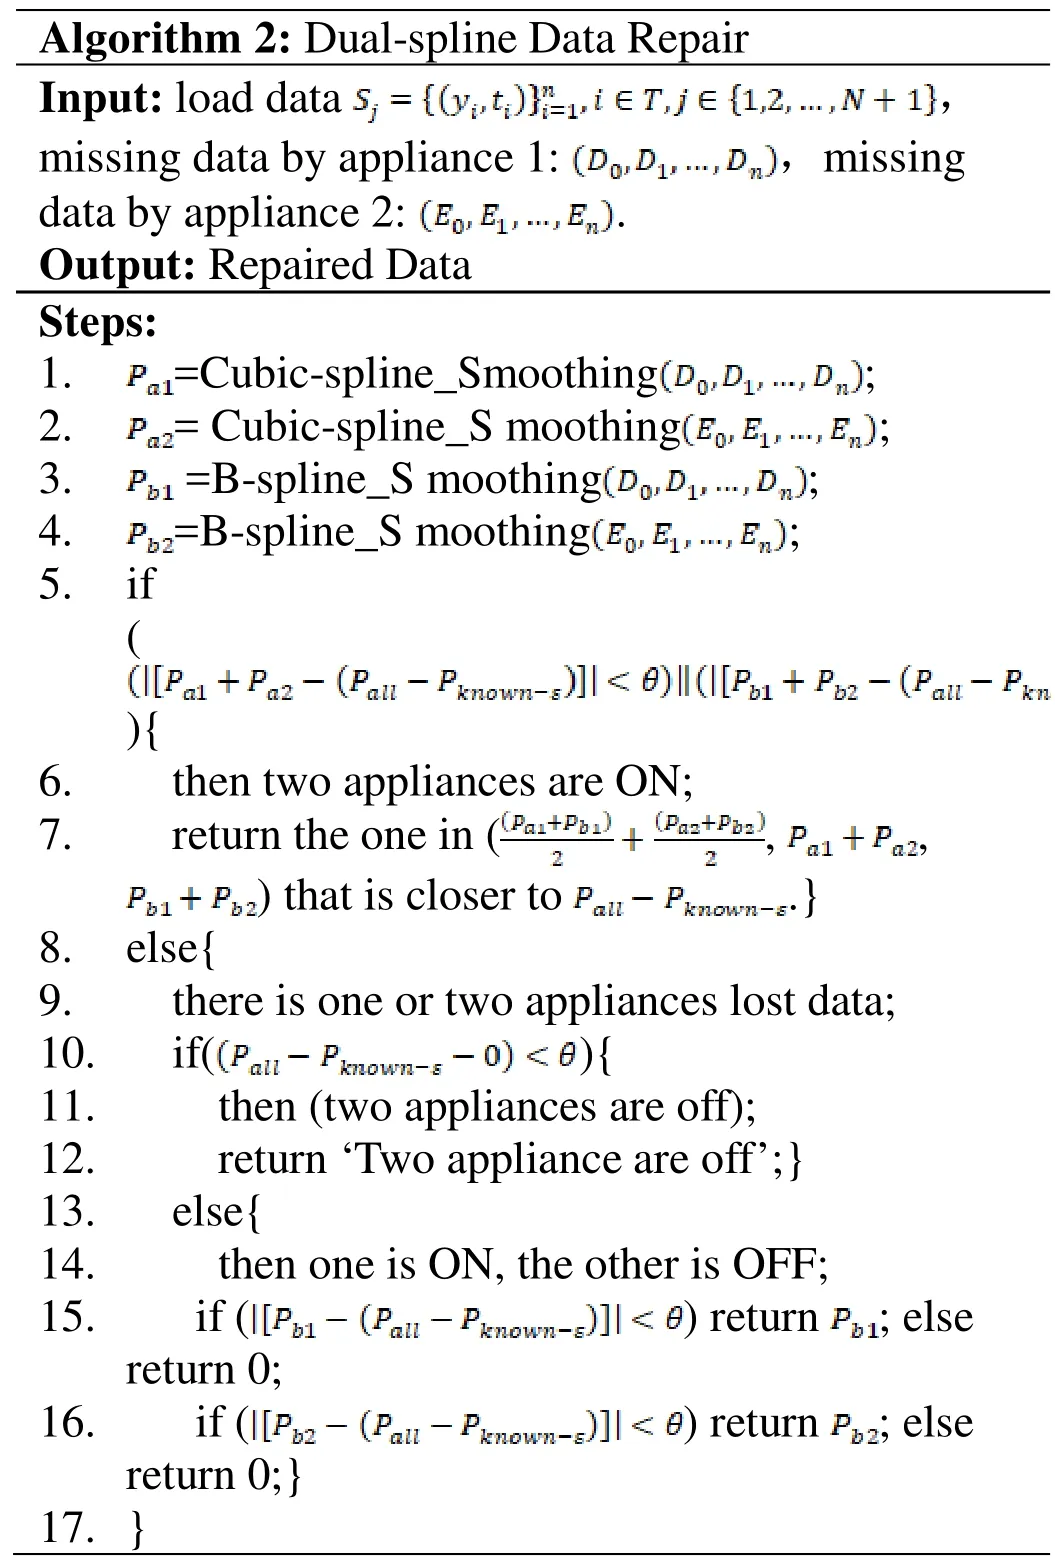
Algorithm 2: Dual-spline Data Repair Input: load data ,missing data by appliance 1:,missing data by appliance 2:.Output: Repaired DataSteps:1.=Cubic-spline_Smoothing;2.= Cubic-spline_S moothing;3.=B-spline_S moothing;4.=B-spline_S moothing ;5. if(){6. then two appliances are ON;7. return the one in (,,) that is closer to .}8. else{9. there is one or two appliances lost data;10. if(){11. then (two appliances are off);12. return ‘Two appliance are off’;}13. else{14. then one is ON, the other is OFF;15. if (; else return 0;) return 16. if (; else return 0;}) return 17. }
In the case of data losses from two appliances, the power consumption of the two appliances andcan be calculated according to (1). Data losses according to the Cubic-spline and B-spline algorithms can be calculated as,,,respectively.If the difference between both curve fitting methods’ results andis within the threshold, then the appliances are considered to be ON. According to the two possible situations, data loss can be repaired with the closest value among,, andto. The status with one appliance being switched off can also be examined and repaired.
5 Experiments and performance evaluation
5.1 Construction of experiment environment
A domestic energy management system is established in a real flat with 1 collecting gateway, 1 CT clamp and 10 smart sockets. All load data is gathered once per second. Total load consumption with various combinations of appliances is taken as training data for 1 h.
1) Parameter settings When training the ELM regression, its kernel function is set to RBF with the kernel parameter being set to 100 and the regression parameter to 1. The fitting performance is shown in Fig. 3.
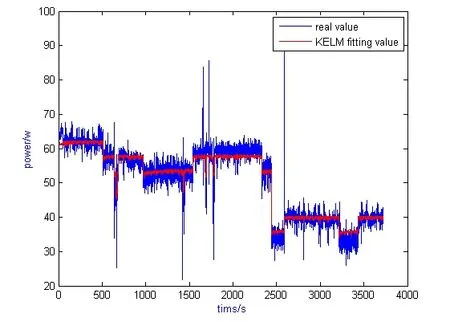
Figure 3: ELM-based fitting values
In the practical system, a desk lamp devotes the minimum power consumption, which varies from 15.7 to 16.7 watts. Line losses, i.e. ε is less than 5 watts according to our test samples. Therefore, taken the line losses in account, data losses from appliances should depict at least 10.7 watts compared to the total energy consumption.is therefore set to 10 for both Algorithm 1 and 2.
2) Evaluation criteria
The RMSE and decision coefficient are chosen to evaluate the performance, as shown in(13) and (14).

where represents the number of testing samples retrieved from the HEMS system;is the true value of thethsample;is the repair value for thethsample.
5.2 Scenario 1: Data errors on a single appliance
In this scenario, the power of a laptop, i.e. MacBook Pro 13 was collected and randomly removed its load data to repair. The repair accuracy is shown in Tab. 1.
The repair performance at different loss rates is shown in the Fig. 4. According to Tab. 1,it can be found that the repair accuracy of B-spline drops sharply when the loss rate increases. When the loss rate is at 65%, the B-spline has depicted significant divergences compared to the original load data for the first 70 s. The performance of the Dual-spline method keeps stable and illustrates robust to high data loss rates.In addition, when training speed is considered, a K-ELM algorithm with a RBF as its kernel function is employed in this paper, which shows better performance than traditional Back Propagation (BP) and Support Vector Machine (SVM) algorithms, as shown in Tab. 2. B-spline and Cubic-spline are not compared since a smoothing mechanism is employed for the prediction, which is different from the training mechanism used by neural network models.
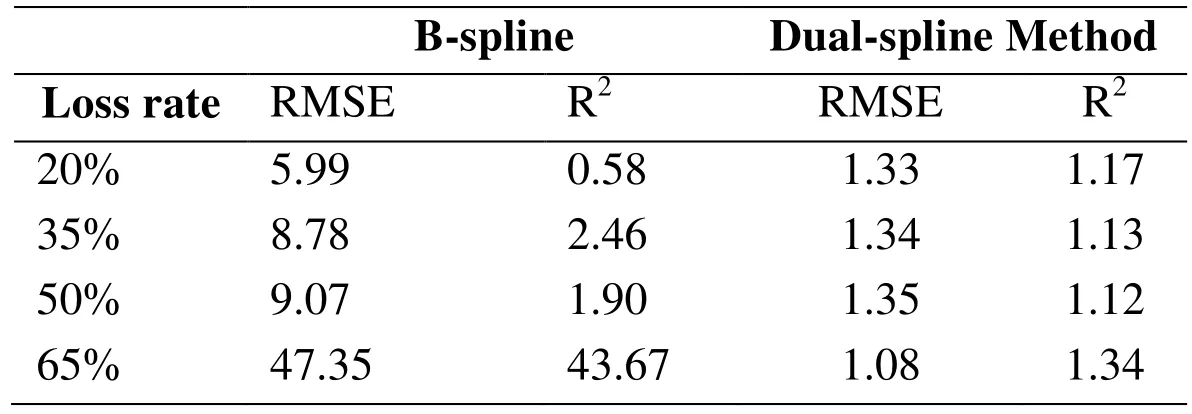
Table 1: Error repair with different loss rates in scenario 1
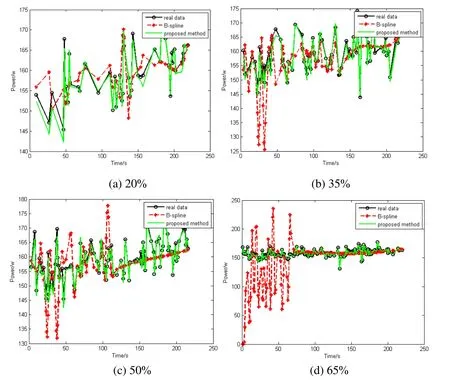
Figure 4: Performance of dual-spline smoothing repair at different loss rates with singleappliance errors

Table 2: Training time (second) in scenario 1
5.3 Scenario 2: Data errors on multiple appliances
When more than one appliance data is lost, the Dual-spline algorithm facilitates two curve fitting methods to achieve better performance. Tab. 3 shows the performance of the proposed method compared to the Cubic- and B-spline.

Table 3: Error repair with different loss rates in scenario 2

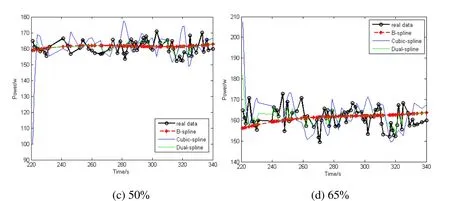
Figure 5: Performance of dual-spline smoothing repair at different loss rates with multiple-appliance errors
As shown in Tab. 3, the Dual-spline is closer to the real value than the B-spline and Cubic-spline. The comparison of repair accuracy is shown in Fig. 5. It can be seen that the Dual-spline is closer to the actual value than the other two smoothing methods.
The training speed is compared with a BP algorithm, as shown in Tab. 4. The SVM algorithm is not implemented in scenario 2 due to complicated configuration of classifiers when multiple appliances are taken into account.
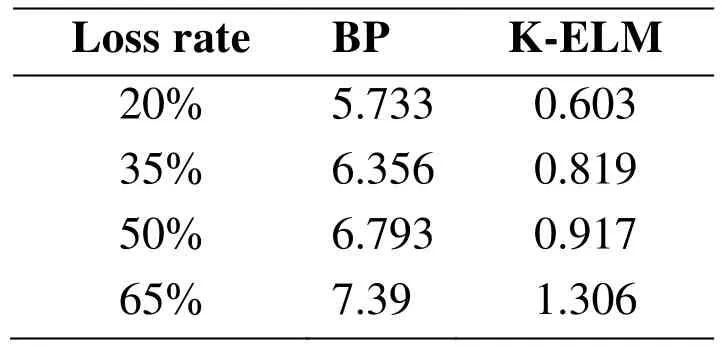
Table 4: Training time (second) in scenario 2
6 Conclusion
In this paper, a load data verification and repair method is proposed in a domestic energy management environment. A practical environment has been deployed, where load data of all home appliances and the power bus were collected. Based on the system, a data verification algorithm has firstly been proposed to verify whether an outlier happened or not. A Dual-spline method has then been proposed to repair the missing data. According to the results, potential errors can be verified and found via an improved K-ELM model with shortened training time compared to traditional methods, e.g. the BP and SVM based algorithms. In terms of the accuracy, the Dual-spline method employed in this paper has depicted higher accuracy than B-spline and Cubic-spline techniques. Furthermore, our method shows high robustness to the loss percent of the original data, which helps to be well adapted into a practical domestic energy management environment.
Acknowledgement:This work has received funding from the European Union’s Horizon 2020 research and innovation programme under the Marie Sklodowska-Curie grant agreement No. 701697.
杂志排行
Computers Materials&Continua的其它文章
- A Novel Time-aware Frame Adjustment Strategy for RFID Anti-collision
- A MPTCP Scheduler for Web Transfer
- Fault Diagnosis of Motor in Frequency Domain Signal by Stacked De-noising Auto-encoder
- Self-embedding Image Watermarking based on Combined Decision Using Pre-offset and Post-offset Blocks
- Band Selection Method of Absorption Peak Perturbance for the FTIR/ATR Spectrum Analysis
- An Evidence Combination Method based on DBSCAN Clustering
