Determination of asenapine in presence of its inactive metabolites in human plasma by LC-MS/MS
2018-10-18NirvPtelMllikSnylNveenShrmDineshPtelPrnvShrivstvBhvinPtel
Nirv P.Ptel,Mllik Snyl,Nveen Shrm,Dinesh S.Ptel,Prnv S.Shrivstv,Bhvin N.Ptel
aBioanalytical Laboratory,Cliantha Research India Ltd.,Bodakdev,Ahmedabad 380054,Gujarat,India
bKadi Sarva Viswavidyalaya,Sector-15,Ghandhinagar 382715,Gujarat,India
cDepartment of Chemistry,St.Xavier's College,Navrangpura,Ahmedabad 380009,Gujarat,India
dDepartment of Chemistry,School of Sciences,Gujarat University,Navrangpura,Ahmedabad 380009,Gujarat,India
Keywords:Asenapine Asenapine 13C-d3 Metabolites LC-MS/MS Bioequivalence study Human plasma
A B S T R A C T A highly selective and sensitive liquid chromatography-tandem mass spectrometry(LC-MS/MS)assay has been described for the determination of asenapine(ASE)in presence of its inactive metabolites N-desmethyl asenapine(DMA)and asenapine-N-glucuronide(ASG).ASE,and ASE 13C-d3,used as internal standard(IS),were extracted from 300 μL human plasma by a simple and precise liquid-liquid extraction procedure using methyl tert-butyl ether.Baseline separation of ASE from its inactive metabolites was achieved on Chromolith Performance RP8e(100 mm×4.6 mm)column using acetonitrile-5.0 mM ammonium acetate-10%formic acid(90:10:0.1,v/v/v)within 4.5 min.Quantitation of ASE was done on a triple quadrupole mass spectrometer equipped with electrospray ionization in the positive mode.The protonated precursor to product ion transitions monitored for ASE and ASE 13C-d3 were m/z 286.1→166.0 and m/z 290.0→166.1,respectively.The limit of detection(LOD)and limit of quantitation(LOQ)of the method were 0.0025 ng/mL and 0.050ng/mL respectively in a linear concentration range of 0.050–20.0 ng/mL for ASE.The intra-batch and inter-batch precision(%CV)and mean relative recovery across quality control levels were≤5.8%and 87.3%,respectively.Matrix effect,evaluated as IS-normalized matrix factor,ranged from 1.03 to 1.05.The stability of ASE under different storage conditions was ascertained in presence of the metabolites.The developed method is much simpler,matrix free,rapid and economical compared to the existing methods.The method was successfully used for a bioequivalence study of asenapine in healthy Indian subjects for the first time.
1.Introduction
Asenapine(ASE)is a second generation antipsychotic drug used for the acute treatment of manic or mixed episodes,associated with bipolar I disorder and schizophrenia[1–3].Pharmacologically,ASE is a dibenzo-oxepino pyrrole drug with a tetracyclic structure.It is the ninth atypical antipsychotic agent that received regulatory approval in August 2009 from the US Food and Drug Administration(FDA)to schizophrenia and bipolar I disorder in adults[4].It shows high affinity to serotonin receptors(5-HT1a,5-HT1b, 5-HT2a,5-HT2b,5-HT2c,5-HT5,5-HT6,and 5-HT7),dopamine receptors(D1,D2,D3,and D4),alpha 1 and 2 receptors,histamine(H1)receptors and moderate affinity to histamine(H2)receptors.Unlike otherantipsychotic agents,ASE has no appreciable affinity towards muscarinic receptors[1,4].ASE is unique among other atypical antipsychotics like risperidone,olanzapine and aripiprazole,in its mode of administration.It is available only as a sublingual,rapidly dissolving formulation that exposes the drug only to salivary enzymes and bypasses first pass metabolism.When administered sublingually,it has a bioavailability of about 35%,while the oral bioavailability is only 2%,when swallowed[5].The time taken to achieve the maximum drug plasma concentration(Tmax)after a single 5 mg dose is about 1h.ASE is highly protein bound(95%),primarily to albumin and alpha-1acid glycoprotein and shows excellent penetration across the blood–brain barrier.Asenapine is metabolized to several metabolites;however,none of them have any significant pharmacological activity.The primary mechanism of metabolism involves glucuronidation through UDP glucuronosyl transferase 1A4(UGT1A4),producing asenapine-N-glucuronide(ASG).The other major metabolite of ASE isN-desmethyl asenapine(DMA),which is formed via demethylation,mainly through CYP1A2,with only minor contributions from CYP3A4 and CYP2D6[2,6].
Literature presents few methods to determine ASE in biological samples[7–11].Van de Wetering-Krebbers et al.[7]studied the excretion balance and metabolism routes of ASE in humans and determined its plasma,urine and fecal concentration using highperformance liquid chromatography(HPLC).A gas chromatography-mass spectrometry(GC-MS)method is also described to analyze ASE in postmortem samples[8].Reddy et al.[9]have presented a liquid chromatography-tandem mass spectrometry(LC-MS/MS)method for the simultaneous determination of ASE and valproic acid in human plasma.Two other methods describe quantification of ASE and its inactive metabolites in human plasma[10]and urine[11]using LC-MS/MS.In these methods[10,11],two separate assays were developed,one for ASE,DMA and 11-O-sulfate asenapine(OSA)and the other for ASG,respectively under gradient elution.In the present work a highly selective and sensitive LC-MS/MS assay is developed to determine ASE in human plasma in presence of its inactive metabolites,ASG and DMA.The assay presents a straightforward liquid-liquid extraction(LLE)extraction procedure to obtain a precise and quantitative recovery of ASE.The proposed method was successfully applied to a bioequivalence study of 10 mg asenapine sublingual tablet formulation in 14 healthy subjects under fasting.
2.Experimental
2.1.Chemicals and materials
Reference standards of asenapine(ASE,99.6%),asenapine 13C-d3(IS,99.5%),N-desmethyl asenapine(DMA,99.1%)and asenapine-N-glucuronide(ASG,98.7%)were procured from Clearsynth Labs(P)Ltd.(Mumbai,India).HPLC grade methanol and acetonitrile,analytical grade formic acid,ammonia and ammonium acetate were obtained from S.D.Fine Chemicals Ltd.(Mumbai,India).Deionized water used for LC-MS/MS was prepared using Milli Q water purification system from Millipore(Bangalore,India).Methyltert-butyl ether(MTBE)was procured from J.T Baker Chemicals Ltd.(Haryana,India).Control buffered(K2-EDTA)human plasma was procured from Clinical Department,Cliantha Research India Limited(Ahmedabad,India)and was stored at-20°C until use.
2.2.LC-MS/MS instrumentation and conditions
The liquid chromatography system from Shimadzu(Kyoto,Japan)consisted of an LC-10ADvp pump,an autosampler(SIL-HTc)and an on-line degasser(DGU-14A).Chromatographic column used was Chromolith Performance RP8e(100mm×4.6mm)from Merck(Mumbai,India).The mobile phase consisted of acetonitrile-5.0mM ammonium acetate-10%formic acid in 90:10:0.1(v/v/v)ratio,delivered at a flow rate of 0.9mL/min.The auto sampler temperature was maintained at 4°C and the injection volume was kept at 5.0μL.Ionization and detection of ASE and IS was performed on a triple quadrupole mass spectrometer,API-4000 equipped with turbo ion spray from MDS SCIEX(Toronto,Canada)and was operated in the positive ionization mode.Quantitation was performed using multiple reaction monitoring(MRM)mode to monitor protonated precursor→product ion transition ofm/z286.1→166.0 for ASE andm/z290.0→166.1 for IS.All the parameters of LC and MS were controlled by Analyst software version 1.6.2.The optimized mass parameters are summarized in Supplementary material.
2.3.Preparation of calibration and quality control samples
The calibration standards(CSs)were made at 0.05,0.10,0.20,0.50,1.00,2.00,4.00,8.00,16.0 and 20.0ng/mL for ASE.Six quality control(QC)samples were prepared at the following concentrations,0.05ng/mL (LLOQ QC,lower limit of quantitation quality control),0.15ng/mL(LQC,low quality control),1.50/5.00ng/mL(MQC-1/MQC-2,medium quality control),15.0ng/mL(HQC,high quality control)and 20.0ng/mL(ULOQ QC,upper limit of quantitation quality control).
2.4.Protocol for sample preparation
Prior to analysis,spiked plasma/subject samples were thawed and allowed to equilibrate at room temperature.The samples were adequately vortexed before pipetting.Aliquots of 300μL plasma solutions containing 15μL of working solution of ASE and 285μL blank plasma were transferred into screw cap tubes.To which,25μL of methanol:deionized water(60:40,v/v),50μL working solution of IS(25.0ng/mL)was added and vortexed to mix.Further,500μL of 5.0mM ammonium acetate solution(pH 9,adjusted with ammonia)was added and vortexed again.LLE was carried out using 3.0mL of MTBE by centrifuging the samples for 5.0min at 1811g.After freezing the aqueous layer in dry ice bath,the organic layer was transferred in clean pre-labeled glass tubes.The samples were then evaporated to dryness at 40°C under gentle stream of nitrogen.The dried samples were reconstituted with 500μL of mobile phase solution and 5.0μL was used for injection in LC-MS/MS,in partial loop mode.
2.5.Methodology for validation
Method validation for ASE in human plasma was done following the USFDA guidelines[12]and the procedures followed were similar to our previous work[13].The details are described in Supplementary material.
2.6.Bioequivalence study design and incurred sample reanalysis(ISR)
The design of study comprised an open label,randomized,twoperiod,two-treatment,two-sequence,crossover,balanced,single dose,evaluation of relative oral bioavailability of test(10 mg asenapine sublingual orally disintegrating tablet from an Indian company)and reference formulations(SAPHRIS®,10 mg asenapine sublingual orally disintegrating tablet from Merck Sharp&Dohme Company,Whitehouse Station,NJ08889,USA)in 14 healthy adult Indian subjects under fasting.The procedures followed while dealing with human subjects were based on International Conference on Harmonization,E6 Good Clinical Practice guidelines[14].An incurred sample reanalysis(ISR)was also conducted by computerized selection of 70 subject samples near Cmaxand the elimination phase for the study as reported previously[15].The experimental details for the study along with statistical analysis are described in Supplementary material.
3.Results and discussion
3.1.Method development

?
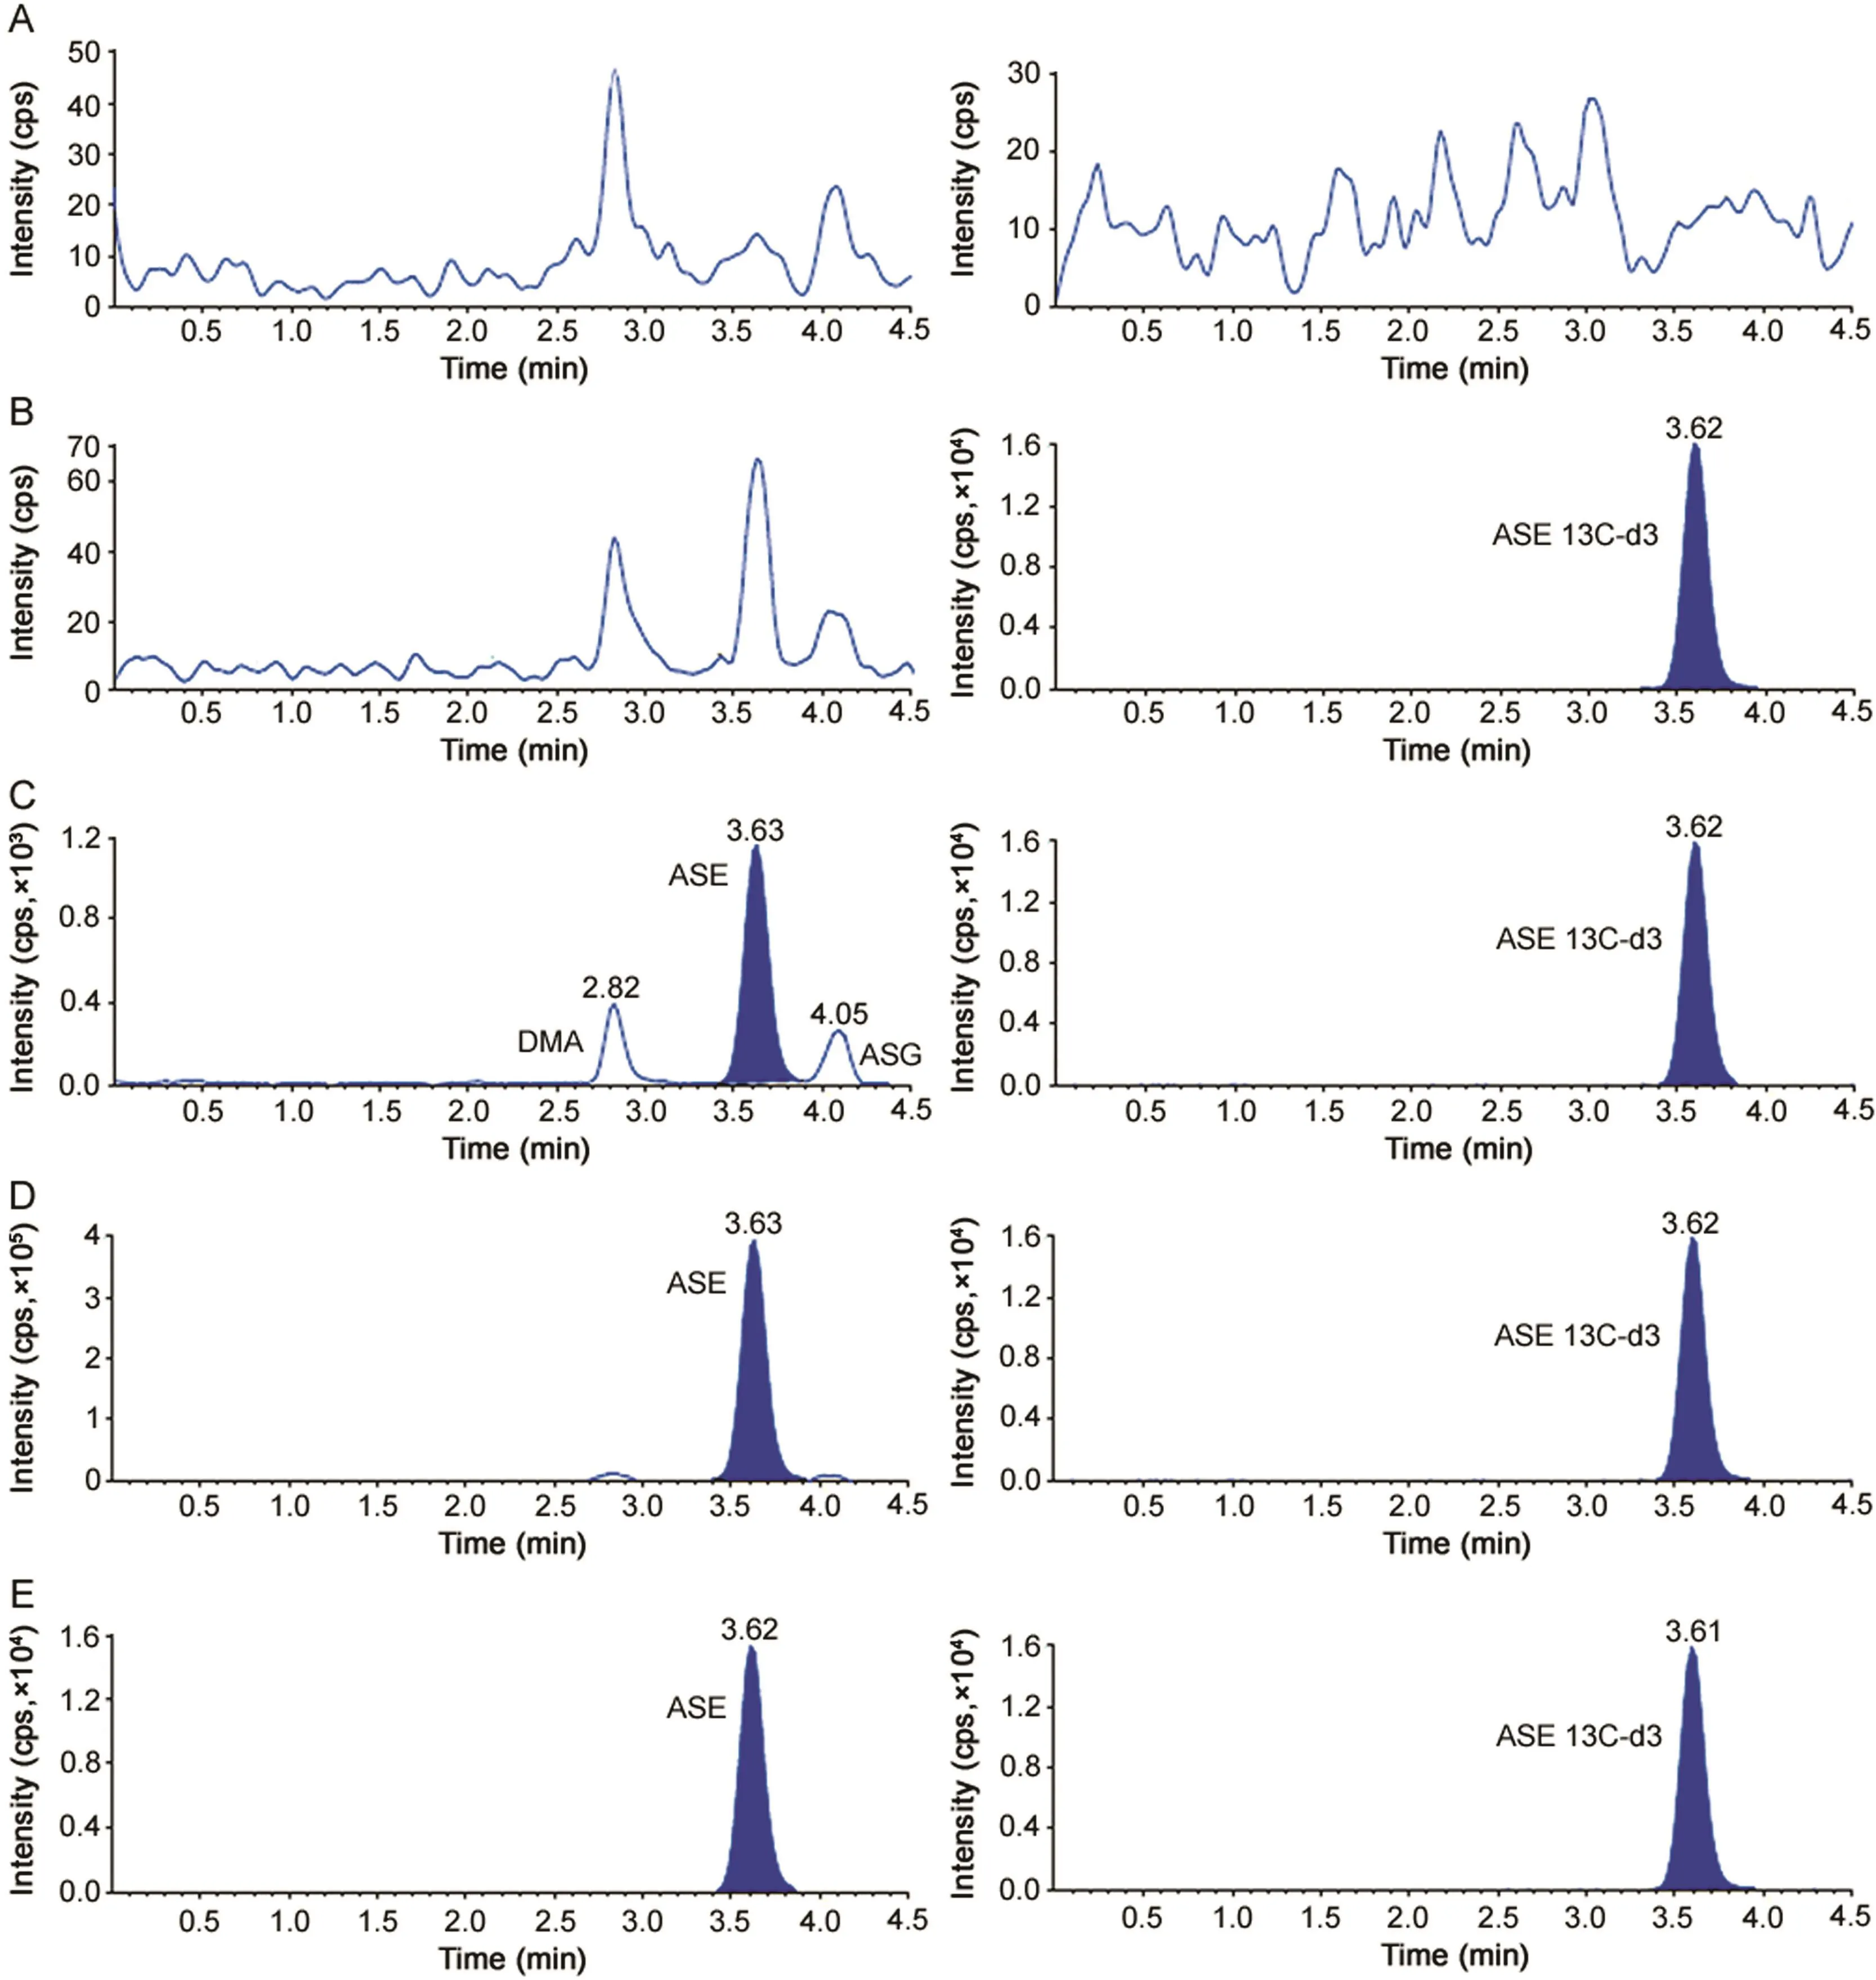
The objective of the present work was to develop and validate a selective and sensitive method for ASE in presence of its inactive metabolites by LC-MS/MS and to apply the method for a bioequivalence study of ASE sublingual tablet formulation in healthy subjects.Furthermore,the sensitivity of the method should be such that it can monitor at least five half lives of ASE concentration with good accuracy and precision for the analysis of subject samples.Though there are reports on the simultaneous determination of ASE and its metabolites in human plasma and urine[10,11],two different methods were adopted to determine ASG separately from ASE,DMA and OSA.Moreover,the analytes ASE,DMA and OSA were not chromatographically resolved on reversed-phase C8column under gradient elution conditions.Initial attempts to separate ASE from DMA(20.0 ng/mL)and ASG(20.0 ng/mL)on conventional reversed phase C8and C18columns like Hypurity C18(100 mm × 4.6 mm,5 μm),Hypurity C8(100 mm × 4.6 mm,5μm),ACE C8(100 mm × 4.6 mm,5 μm)and Eclipse XDB-C8(150 mm × 4.6 mm,3.5 μm)were unsuccessful using acetonitrile/methanol and 2–10 mM ammonium acetate/formate buffer as the mobile phase.Additionally,the flow rate was also varied from 0.6 to 1.2 mL/min.Under these conditions it was difficult to resolve the peaks of ASE and its metabolites even up to 10 min.Attempts to increase the proportion of organic content(>70%)or the flow rate resulted in poor resolution and peak shapes of ASG and to a lesser extent for DMA.Thus,the method was transferred to a monolithic silica column,Chromolith Performance RP8e(100 mm×4.6 mm)and developed using the same mobile phases.However,some peak tailing was observed for ASG and also the response was not adequate for ASE under isocratic elution conditions.Thus,the mobile phase was suitably optimized along with the buffer pH.Increase in pH of buffer resulted in slight increase in retention time of ASE with limited separation from ASG.However,the best chromatographic conditions in terms of resolution,analyte response,peak shape and adequate retention were obtained using acetonitrile-5.0 mM ammonium acetate-10%formic acid(pH,5.5)in 90:10:0.1(v/v/v)ratio as the mobile phase at a flow rate of 0.9 mL/min.All three compounds were baseline resolved within 4.5min.The retention time of ASE,DMA and ASG was 3.63,2.82 and 4.05min,respectively.Use of labeled IS helped in offsetting any possible ion suppression caused by the plasma matrix and also by compensating any inconsistency during extraction.
The mass spectra of ASE and ASE 13C-d3(IS)were recorded in the positive ionization mode as both the compounds are basic in nature due to the presence of pyrrole ring.Using 10.0 ng/mL tuning solution,ASE and IS gave predominant singly charged protonated precursor[M+H]+ions atm/zof 286.1 and 290.0 for ASE and IS,respectively in Q1 full scan spectra.Further,fragmentation of the precursor ion was initiated by providing sufficientnitrogen for collisional activation dissociation and by applying 20.0 psi curtain gas to obtain highly consistent and abundant product ions of ASE and IS atm/z166.0 as shown in Fig.S1.Other stable product ions were also found atm/z194,215 and 229.However,due to superior signal to noise(S/N)ratio the product ion atm/z166.0 was selected for quantitation.Additionally,to verify the identity of the analyte and IS qualifier transitions were also monitored atm/z286.1/194.0 for ASE andm/z290.0/194.1 for IS.Furthermore,to reach an ideal Taylor cone for better spectral response,nebulizer gas pressure was set at 50psi to get a consistent and stable response.A dwell time of 300ms was sufficient to generate at least 24 data points for quantitative analysis of ASE and IS.Also,there was no cross talk between the MRMs of ASE and IS which had identical product ions.
In a previous report,Reddy et al.[9]used LLE for the extraction of ASE from human plasma with a recovery of 81.3%.Moreover,ASE has a logPvalue of 4.9[16];thus LLE was tested with different solvents liken-hexane,MTBE,dichloromethane and diethyl ether and their binary mixtures.In these solvent systems the recovery of ASE ranged from 59%to 77%under neutral conditions.In addition,the recovery was highly consistent,especially in MTBE.In order to further improve the recovery,mild alkaline conditions(pH 9.0)were set to keep the drug in its unionized state using MTBE.The recovery of ASE(85.2%–89.4%)and IS(86.3%–88.0%)thus obtained from spiked plasma samples was highly consistent and reproducible.

Fig.1.Representative MRM chromatograms of(A)double blank plasma(without asenapine and asenapine13C-d3),(B)blank plasma spiked with asenapine13C-d3(25.0 ng/mL),(C)asenapine(0.050 ng/mL),N-desmethyl asenapine(20.0 ng/mL)and asenapine-N-glucuronide(20.0 ng/mL)and asenapine13C-d3(25 ng/mL),(D)asenapine(20.0 ng/mL),N-desmethyl asenapine(20.0 ng/mL)and asenapine-N-glucuronide(20.0 ng/mL)and asenapine13C-d3(25 ng/mL)and(E)real subject sample at Cmaxafter oral administration of 10 mg dose of asenapine.
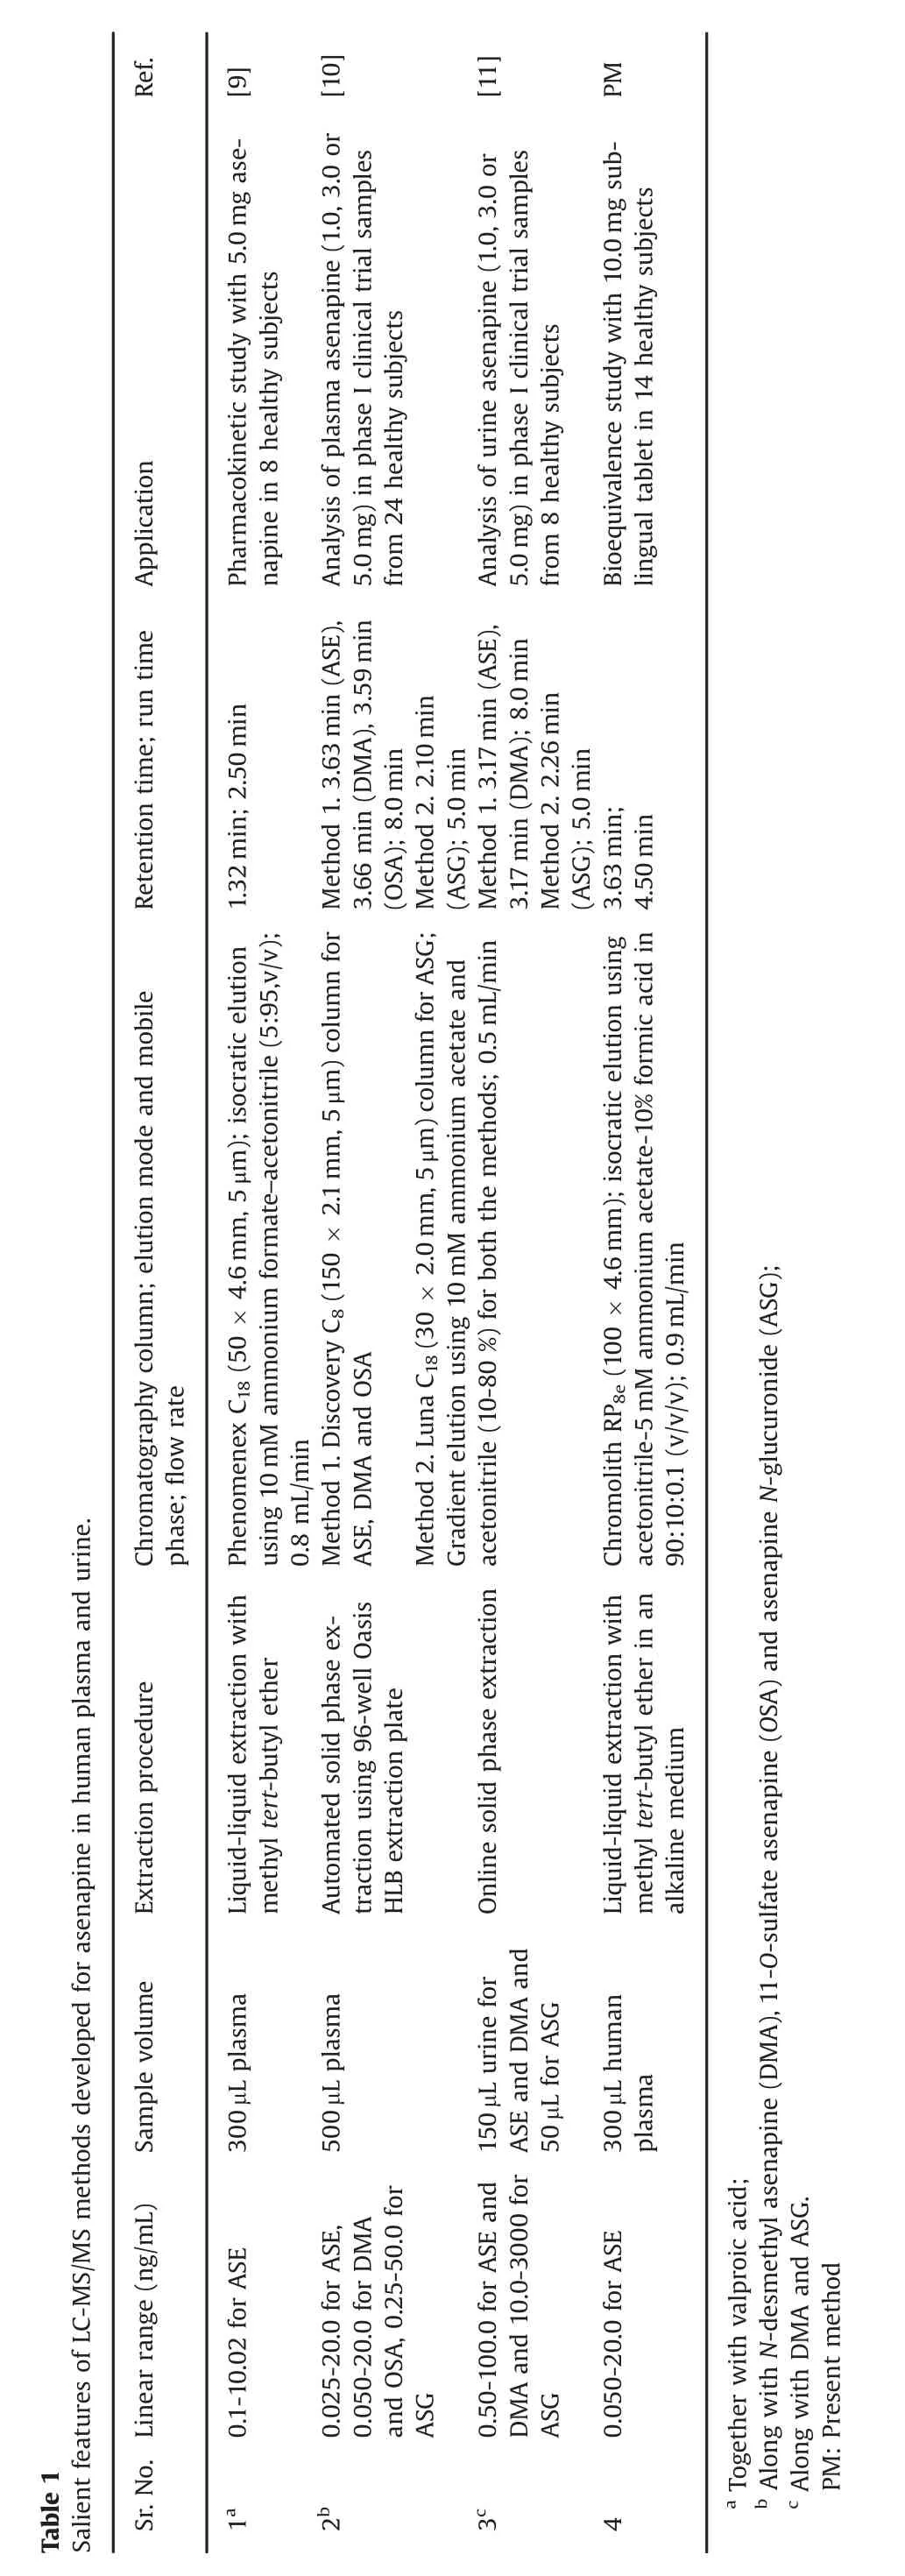
The significant features of the present work include baseline separation of ASE from its inactive metabolites under isocratic elution,which is not possible with the existing LC-MS/MS methods employing gradient elution program[10,11].Further,it was not feasible to analyze ASG along with ASE and other metabolites due to difference in polarity and therefore a separate method was established for ASG[10].Besides,the newly developed method presents an efficient,relatively inexpensive and straightforward extraction procedure for precise and quantitative recovery of ASE in presence of its inactive metabolites.Though the sensitivity of ASE achieved(0.05 ng/mL)was less than the work of de Boer et al.[10](0.025 ng/mL),it was higher than that of another report(0.10 ng/mL)[9].On the other hand,the analysis time of 4.5 min was shorter than in methods reported for the determination of ASE together with its metabolites[10,11].The plasma volume used for processing is less(300μL)compared to the work of de Boer et al.[10],which employed 500 μL sample volume.Moreover,their method involved an automated SPE using 96-well plate which is not used routinely.A comparative evaluation of methods developed for ASE is illustrated in Table 1.
3.2.Assay performance and validation
The selectivity of the method from endogenous plasma components was determined by analyzing eight different human plasma sources.This was done to evaluate the extent to which matrixcomponents may interfere at the retention time of ASE and the IS.Fig.1 demonstrates the selectivity of the method with the chromatograms of double blank plasma,blank plasma spiked with IS,ASE at LLOQ and ULOQ concentration and in subject samples.Carry-over evaluation was performed in each analytical run to ensure that it does not impact the accuracy and precision of the method.The results showed a carryover of≤2.23%for ASE concentration(0.05ng/mL)in the blank plasma sample after injection of highest calibration standard(ULOQ)at the retention time of ASE.Further,there was no interference of commonly used medications by healthy volunteers like acetaminophen,aspirin,caffeine,chlorpheniramine,cetirizine,ibuprofen and pseudoephedrine at the retention time of ASE and IS.Similarly,none of the metabolites(DMA and ASG)interfered in the determination of ASE as they were chromatographically separated.

Table 2 Intra-batch and inter-batch accuracy and precision for asenapine.

Table 3 Extraction recovery and matrix factor for asenapine in presence of its metabolites(n=6).

Table 4 Stability results for asenapine under different conditions(n=6).

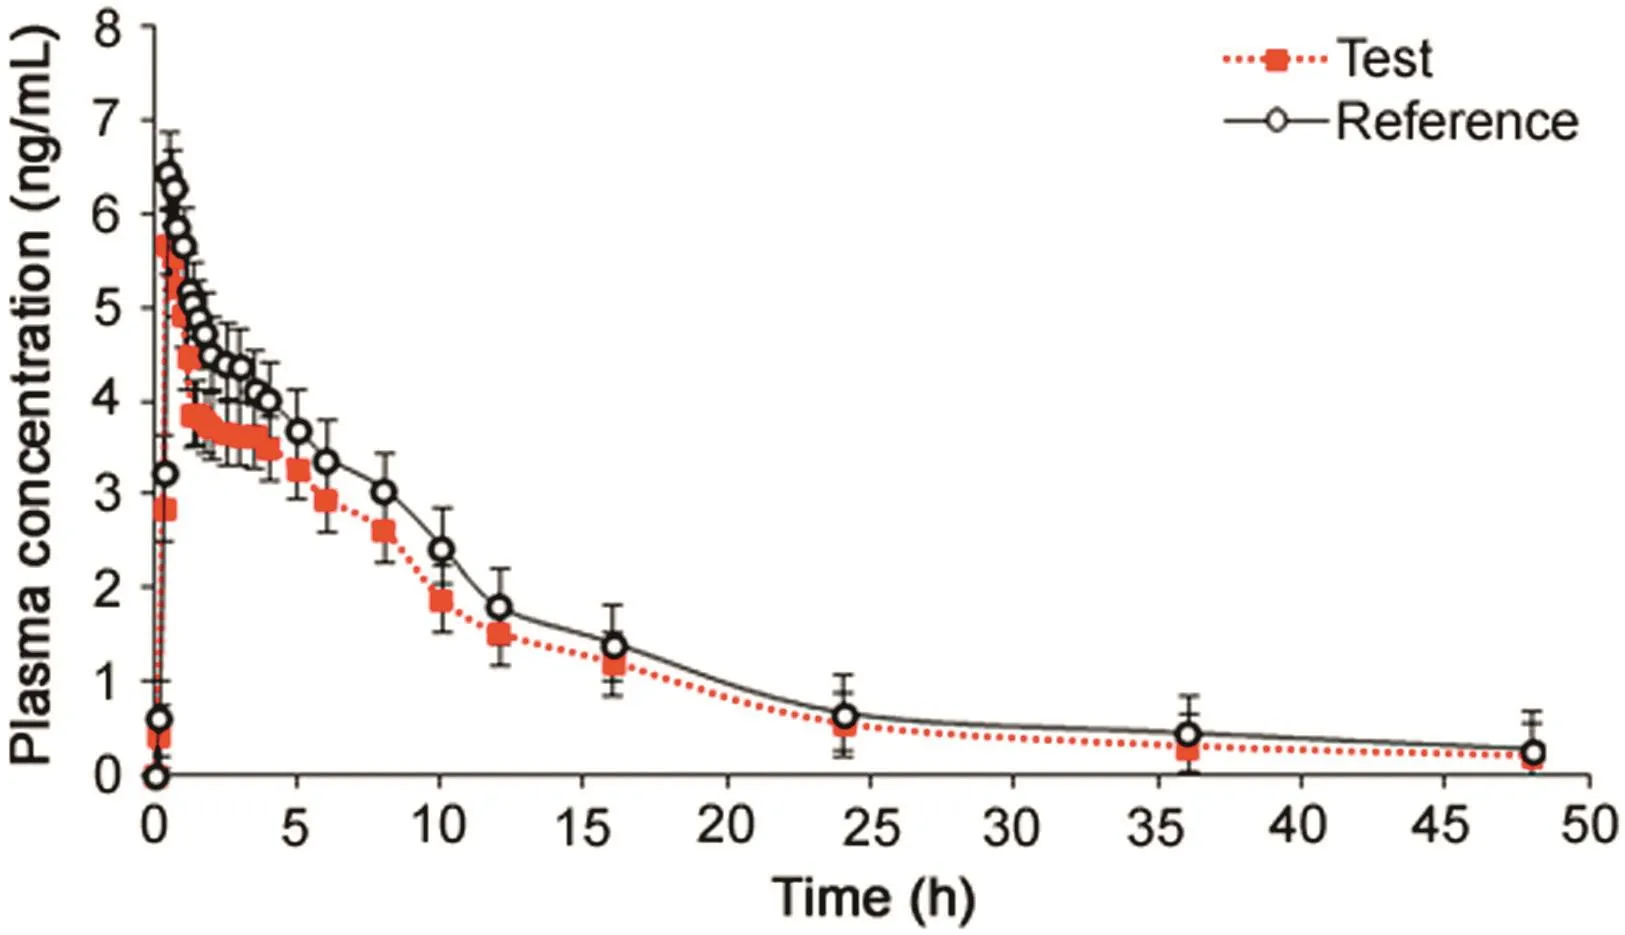
Fig.2.Mean plasma concentration-time profile of asenapine after sublingual administration of 10 mg tablet(test and reference)formulation to 14 healthy Indian subjects under fasting.
The calibration curve was linear over the concentration range of 0.05–20.0ng/mL with correlation coefficientr2≥ 0.9996.Astraight-line fit was made through the data points by least square regression analysis to give a mean linear equation,y=(1.2033±0.0035)x–(0.0091 ± 0.0007),whereyis the peak area ratio(ASE/IS)andxis the concentration of ASE.The accuracy and precision(%CV)observed for the CSs ranged from 97.3%to 102.3%and 0.6%–2.3%,respectively.The lowest concentration(LLOQ)that was measured with acceptable accuracy and precision was 0.05 ng/mL at S/N≥15,and the limit of detection(LOD)of the method was 0.0025 ng/mL.

Table 5 Mean pharmacokinetic parameters(±SD),comparison of treatment ratios and 90%CIs of natural log(Ln)-transformed following administration of 10 mg asenapine maleate sublingual tablet to 14 healthy Indian subjects under fasting.
The intra-batch and inter-batch precision and accuracy results are summarized in Table 2.The intra-batch precision(%CV)ranged from 1.3%to 2.8%and the accuracy was within 94.1%–99.5%.For the inter-batch experiments,the precision varied from 2.4%to 5.8%and the accuracy was within 91.2%–97.0%.The extraction recovery and matrix effect data for ASE and IS are shown in Table 3.Highly consistent recovery was obtained across QC levels for ASE.The IS-normalized matrix factors ranged from 1.03 to 1.05,which shows minimal interference of endogenous matrix components.Matrix effect was also checked in different plasma sources(6-K2EDTA,1-lipemic and 1-heamolyzed)and was also evaluated at LQC and HQC levels.The precision(%CV)in different plasma sources varied from 0.6%to 2.8%for ASE(Table S1).This was much less than that of a previous report[10],wherein it was>15%for ASE and its IS.Post-column infusion further substantiated the absence of matrix effects with no signal enhancement or suppression at the retention time of ASE or ASE 13C-d3(Fig.S2).There was a minor ion suppression(~3.0%)observed before the analyte peak at 3.3–3.4 min,but it did not interfere in the quantitation of ASE or IS.
Stability experiments were performed to evaluate the stability of ASE in stocks solutions and in plasma samples under different conditions in presence of its metabolites.ASE was found stable in controlled blank plasma at room temperature up to 24h and for six freeze and thaw cycles.The stability of ASE in extracted plasma samples was stable for 94 h under refrigerated conditions(5°C)and for 75 h at room temperature.The spiked plasma samples of ASE stored at-20 °C and at-70 °C for long-term stability showed no evidence of degradation even up to 126 days.The detailed stability results are shown in Table 4.
Dilution integrity of the method was checked to ascertain dilution reliability of samples having concentration of ASE above ULOQ.The precision(%CV)values for 10-fold dilution of 100 ng/mL(5 × ULOQ concentration)were in range of 0.9%–1.5%and accuracy results was within 97.3%–100.5%.Similarly,the precision and accuracy for method ruggedness on two different Chromolith Performance RP8ecolumns and with different analysts varied from 1.0%to 7.4%and 92.5%–96.9%,respectively for ASE.
3.3.Application of the method in healthy subjects and ISR results
The validated method was applied to a bioequivalence study of ASE in 14 healthy Indian subjects who received 10 mg test and reference formulations of ASE under fasting condition.The method was sensitive enough to monitor their plasma concentration up to 48 h.Fig.2 shows the plasma concentration-time profile of ASE in healthy subjects.Table 5 gives the values of pharmacokinetic parameters of test and reference formulations and equivalence statistics of bioavailability for the pharmacokinetic parameters.The results obtained forCmax,Tmax,t1/2and AUC were in good agreement with reported studies[3,5,9].Further,the 90%conf i dence intervals of the test/reference formulations for Cmax,AUC0–48hand AUC0-infvaried from 83.4%to 97.3%,which is within the bioequivalence acceptance criterion of 80%–125%.No statistically significant differences were found between the two formulations in any parameter.Further,there was no adverse event during the course of the study.The%change in the measurement of selected subject samples for ISR was within±14.5%,which confirms method reproducibility.
4.Conclusion
In summary,we have described a selective and sensitive LCMS/MS method for the estimation of ASE in human plasma,especially to meet the requirement for subject sample analysis.The inactive metabolites,DMA and ASG,were successfully resolved on a monolithic silica column.The LLE procedure employed in the present work gave consistent and reproducible recovery for ASE.The optimized linear concentration range was adequate to monitor at least five half-lives of ASE with good accuracy and precision.Furthermore,the results of the reanalysis of study data have shown sufficient reproducibility of the method.
Conflicts of interest
The authors declare that there are no conflicts of interest.
Acknowledgments
The authors are indebted to Mr.Vijay Patel,Executive Director,Cliantha Research Ltd.,Ahmedabad,India,for providing necessary facilities to carry out this work and to Mr.Anshul Dogra,Head of the Department,Cliantha Research Ltd.,for his support during the course of this project.
Appendix A.Supplementary material
Supplementary data associated with this article can be found in the online version at http://dx.doi.org/10.1016/j.jpha.2018.06.002.
杂志排行
Journal of Pharmaceutical Analysis的其它文章
- 3D biofabrication of vascular networks for tissue regeneration:A report on recent advances
- A rapid reporter assay for recombinant human brain natriuretic peptide(rhBNP)by GloSensor technology
- Solution pH jump during antibody and Fc-fusion protein thaw leads to increased aggregation
- Primula vulgaris extract induces cell cycle arrest and apoptosis in human cervix cancer cells
- Discoursing on Soxhlet extraction of ginseng using association analysis and scanning electron microscopy
- Molecular docking studies of human MCT8 protein with soy isoflavones in Allan-Herndon-Dudley syndrome(AHDS)
