Selection and evaluation of potential reference genes for gene expression analysis in greenbug (Schizaphis graminum Rondani)
2018-08-06ZHANGBaizhongLlUJunjieYUANGuohuiCHENXilingGAOXiwu
ZHANG Bai-zhong , LlU Jun-jie, YUAN Guo-hui, CHEN Xi-ling GAO Xi-wu
1 Postdoctoral Research Base, Henan Institute of Science and Technology, Xinxiang 453003, P.R.China
2 College of Plant Protection, Henan Agriculturaluniversity, Zhengzhou 450002, P.R.China
3 Department of Entomology, China Agriculturaluniversity, Beijing 100193, P.R.China
Abstract In order to precisely assess gene expression level, a suitable internal reference gene must be chosen to quantify real-time reverse transcription polymerase chain reaction (RT-qPCR) data. For greenbug, Schizaphis graminum, a suitable reference gene for assessing the levelof transcriptional expression of target genes has yet to be explored. In our study, eight reference genes, elongation fator 1 beta (Ef1β), TATA box binding protein (TBP), alpha-tubulin (α-TUB), 18S ribosomal (18S), 28S ribosomal (28S), glyceraldehyde-3-phosphate (GAPDH), actin (ACT), and ribosomal protein L18 (RPL18) were evaluated in S. graminum at different developmental stages, tissues, and insecticide treatments. To further explore whether these genes are suitable to serve as internal control, three software-based approaches (geNorm, BestKeeper, and NormFinder),∆Ct method, and one web-based comprehensive tool (RefFinder) were employed to analyze and rank the tested genes.The optimal number of reference genes was determined using the geNorm program, and the suitability of particular reference genes was empirically validated according to normalized gene expression data of three target genes, heat shock protein gene (HSP70), cytocrome P450 gene (SgraCYP18A1), and glutathione S-transferase (GST). We found that the most suitable reference genes varied considerably under different experimental conditions. For developmental stages,α-TUB and 28S were the optimal reference genes; for different tissues, 18S and ACT were suitable reference genes; for insecticide treatments, 28S and α-TUB were suitable for normalizations of expression data. In addition, 28S and α-TUB were the suitable reference gene as they had the most stable expression among different developmental stages, tissues and insecticide treatments. This should be useful for the selection of the suitable reference genes to obtain reliable RT-qPCR data in the gene expression of S. graminum.
Keywords: Schizaphis graminum, gene expression, normalization, RT-qPCR, reference gene
1. lntroduction
The internal controlof target gene measurement refers to the use of reference gene expression and is the currently preferred method for normalizing reverse transcription quantitative real-time polymerase chain reaction (RT-qPCR)data as reference genes could capture all nonbiological variations (Ciric 2010). Although no gene exhibits constant expression under all experimental conditions, the studies of validating reference genes have been driven by severalalgorithms and freely available softwares, e.g., geNorm(Vandesompele et al. 2002), BestKeeper (Pfaffl et al. 2004),NormFinder (Andersen et al. 2004).
RT-qPCR is generally characterized as one of effective,sensitive, and economical methods, which has been already widely applied to analyze gene expression in biological research (Lu et al. 2013; Liang et al. 2014). However,there remains a number of challenges. One of the biggest challenges in RT-qPCR analysis is normalization of the data to correct the variations created due to tissue amount, RNA extraction and purification, reverse transcription, efficiency of PCR amplification, etc. (Bustin et al. 2009). Several strategies have been proposed to normalize these variations in RT-qPCR analysis, including normalization of sample size,ensuring the quality and quantity of RNA, and removing DNA contamination (Huggett et al. 2005). Of such strategies, the most widely used one is the selection of appropriate reference gene to normalize nonspecific variation or errors (Liang et al. 2014). Actin (ACT) and glyceraldehyde-3-phosphate dehydrogenase (GAPDH) have been demonstrated to change broadly under particular experimental conditions or in response to external stimuli (Glare et al. 2002; Ma et al. 2016).Clearly, for a given set of experimental biological samples,selecting suitable reference genes for use in the normalization of RT-qPCR data is quite urgent. To date, several studies have systematically assessed reference genes in various insects across different experimental conditions.
The greenbug, Schizaphis graminum is one of the most serious pests of cereal crops, especially for wheat and is extensively distributed in relative temperate areas (Al-Mousawi et al. 1983; Lage et al. 2003; Newman 2005).This pest is the most important factor affecting wheat yield(Burton et al. 1985; Kieckhefer and Kantack 1988; Riedell et al. 1999; Kindler et al. 2002; Ranjan 2006; Hussain et al.2015). In addition, it also injects toxins into host plants and causes serious plant damage (Reavy and Mayo 2002).However, the mechanisms including evolutionary history,resistance to insecticides, transmission of viruses and so on, were seldom studied.
In recent years, RT-qPCR has been widely used to quantify gene expression level in pests, such as studies of insecticide resistance and ecologicaladaption (Shang et al.2016; Zhang et al. 2016). Some studies have shown that at least two or three reference genes should be used to achieve accurate normalization (Thellin et al. 1999; Vandesompele et al. 2002). However, in the aforementioned reports, only one reference gene (18S, GAPDH, or ACT) was used to normalize the variation in mRNA levels of genes of interest for allof the diverse experimental conditions.
No validated reference gene for S. graminum was used in gene expression of developmental stages, different tissues and insecticide treatments. Thus, a systematic validation of reference gene is required to ensure suitable normalization in S. graminum. So, we conducted the present study to ameliorate this situation and to enable the empirically informed selection of suitable reference genes for future study with S. graminum. Eight commonly used normalization genes, elongation fator 1 beta (Ef1β), TATA box binding protein (TBP), alpha-tubulin (α-TUB), 18S ribosomal (18S), 28S ribosomal (28S), glyceraldehyde-3-phosphate (GAPDH), actin (ACT), and ribosomal protein L18(RPL18) were selected for analyzing their performance under several different experimental conditions in S. graminum.Whereafter, three target genes, heat shock protein gene(HSP70), cytocrome P450 gene (SgraCYP18A1), and glutathione S-transferase (GST) were selected and used as the validation on the performance of the reference genes.To our knowledge, our study is critical systematic study to validate a set of candidate reference genes for RT-qPCR in S. graminum. This should be useful for the selection of suitable, reliable reference genes in modern molecular genetic analyses in S. graminum.
2. Materials and methods
2.1. lnsect culture
The strain of S. graminum used was collected from the Department of Entomology, China Agriculturaluniversity,which has been maintained in laboratory for more than 3 years. The aphids were reared on wheat seedlings under controlled conditions of 15-23°C, 60% relative humidity(RH), and a photoperiod of 16 h L:8 h D, as described previously (Lu and Gao 2007).
2.2. Biotic factors
Developmental stages Ten offirst-instar nymphs,third-instar nymphs, alate adults, and apterous adults of S. graminum were collected in RNase-free tubes for each replication, respectively. Then snap frozen in the liquid nitrogen before stored at -80°C for RNA extraction. The experiments were replicated at least three times.
Different tissues Heads, thoraces, and abdomens were collected from 30 third-instar nymphs in RNase-free tubes for each replication. Then snap frozen in the liquid nitrogen before stored at -80°C for RNA extraction. The experiments were conducted at least three times.
2.3. Abiotic factors (lnsecticide treatments)
Leaf-dipping with aphids was performed according to the methods of Lu et al. (2007) with slight modifications. Imidacloprid was dissolved in acetone and then diluted with distilled water(LC10=0.01 mg L-1). The wheat seedlings with aphids were dipped into the insecticide solution for 10 s. Control groups treated with distilled water were collected at the same time points as their imidacloprid-treated counterparts. The surviving third-instar nymphs were collected at 24 h after imidacloprid challenge. Aphids snap frozen in the liquid nitrogen before stored at-80°C for RNA extraction. The experiment was replicated at least three times.
2.4. Reference gene selection and primer design
Eight ever used reference genes were selected,elongation fator 1 beta (Ef1β), TATA box binding protein (TBP), alpha-tubulin (α-TUB),18S ribosomal (18S), 28S ribosomal (28S),glyceraldehyde-3-phosphate (GAPDH), actin(ACT), and ribosomal protein L18 (RPL18).PCR primers for RT-qPCR were designed using primer3 input (http://primer3.ut.ee/). The primers were designed on the basis of sequences(Appendix A). Details for the primers used in this study are listed in Table 1.
2.5. RNA extraction and cDNA synthesis
Total RNA was isolated from S. graminum samples using TRIzol reagent. Sample RNA concentrations were measured using a NanoDrop 2000 spectrophotometer (Thermo Fisher Scientific, USA) at 260 nm. After total RNA (1.0 μg per sample) was treated with DNase I (Fermentas, USA) to remove possible genomic DNA contamination,first-strand cDNA was synthesized in a 20-μL reaction system using a First Strand cDNA Synthesis Kit (Fermentas,USA) with oligo(dT)18as the primer.
2.6. RT-qPCR
RT-qPCR reactions were performed in a 20-μL mixture containing 1 μlof cDNA, 10 μlof SYBR Green RT-qPCR SuperMix-UDG, 0.15-μlof each primer, and 8.7 μlof H2O. The amplification efficiency of the target genes and reference genes were estimated using E=10(−1/Sope)−1,where the slope was derived from the plot ofthe cycle threshold (Ct) value vs. the log of the serially diluted template concentration. The optimised RT-qPCR program consisted of an initial step at 50°C for 2 min, 94°C or 2 min, followed by 50 cycles of 94°C for 15 s and 60°C for 30 s. After the cycling protocol, melting curves were obtained by increasing the temperature from 60 to 95°C(0.2°C s−1) to denature the double-stranded DNA. The RT-qPCR amplifications were carried out in 96-well plates.The assays were run in an ABI 7500 System using the SDS ver.1.4 application software (Applied Biosystems,USA). Standard curves were created based on afive-fold dilution series of cDNA (1:5, 1:25, 1:125, 1:625, 1:3 125,and 1:15 625). Each sample was prepared as three biological replicates, and each reaction was analyzed with two technical replications.
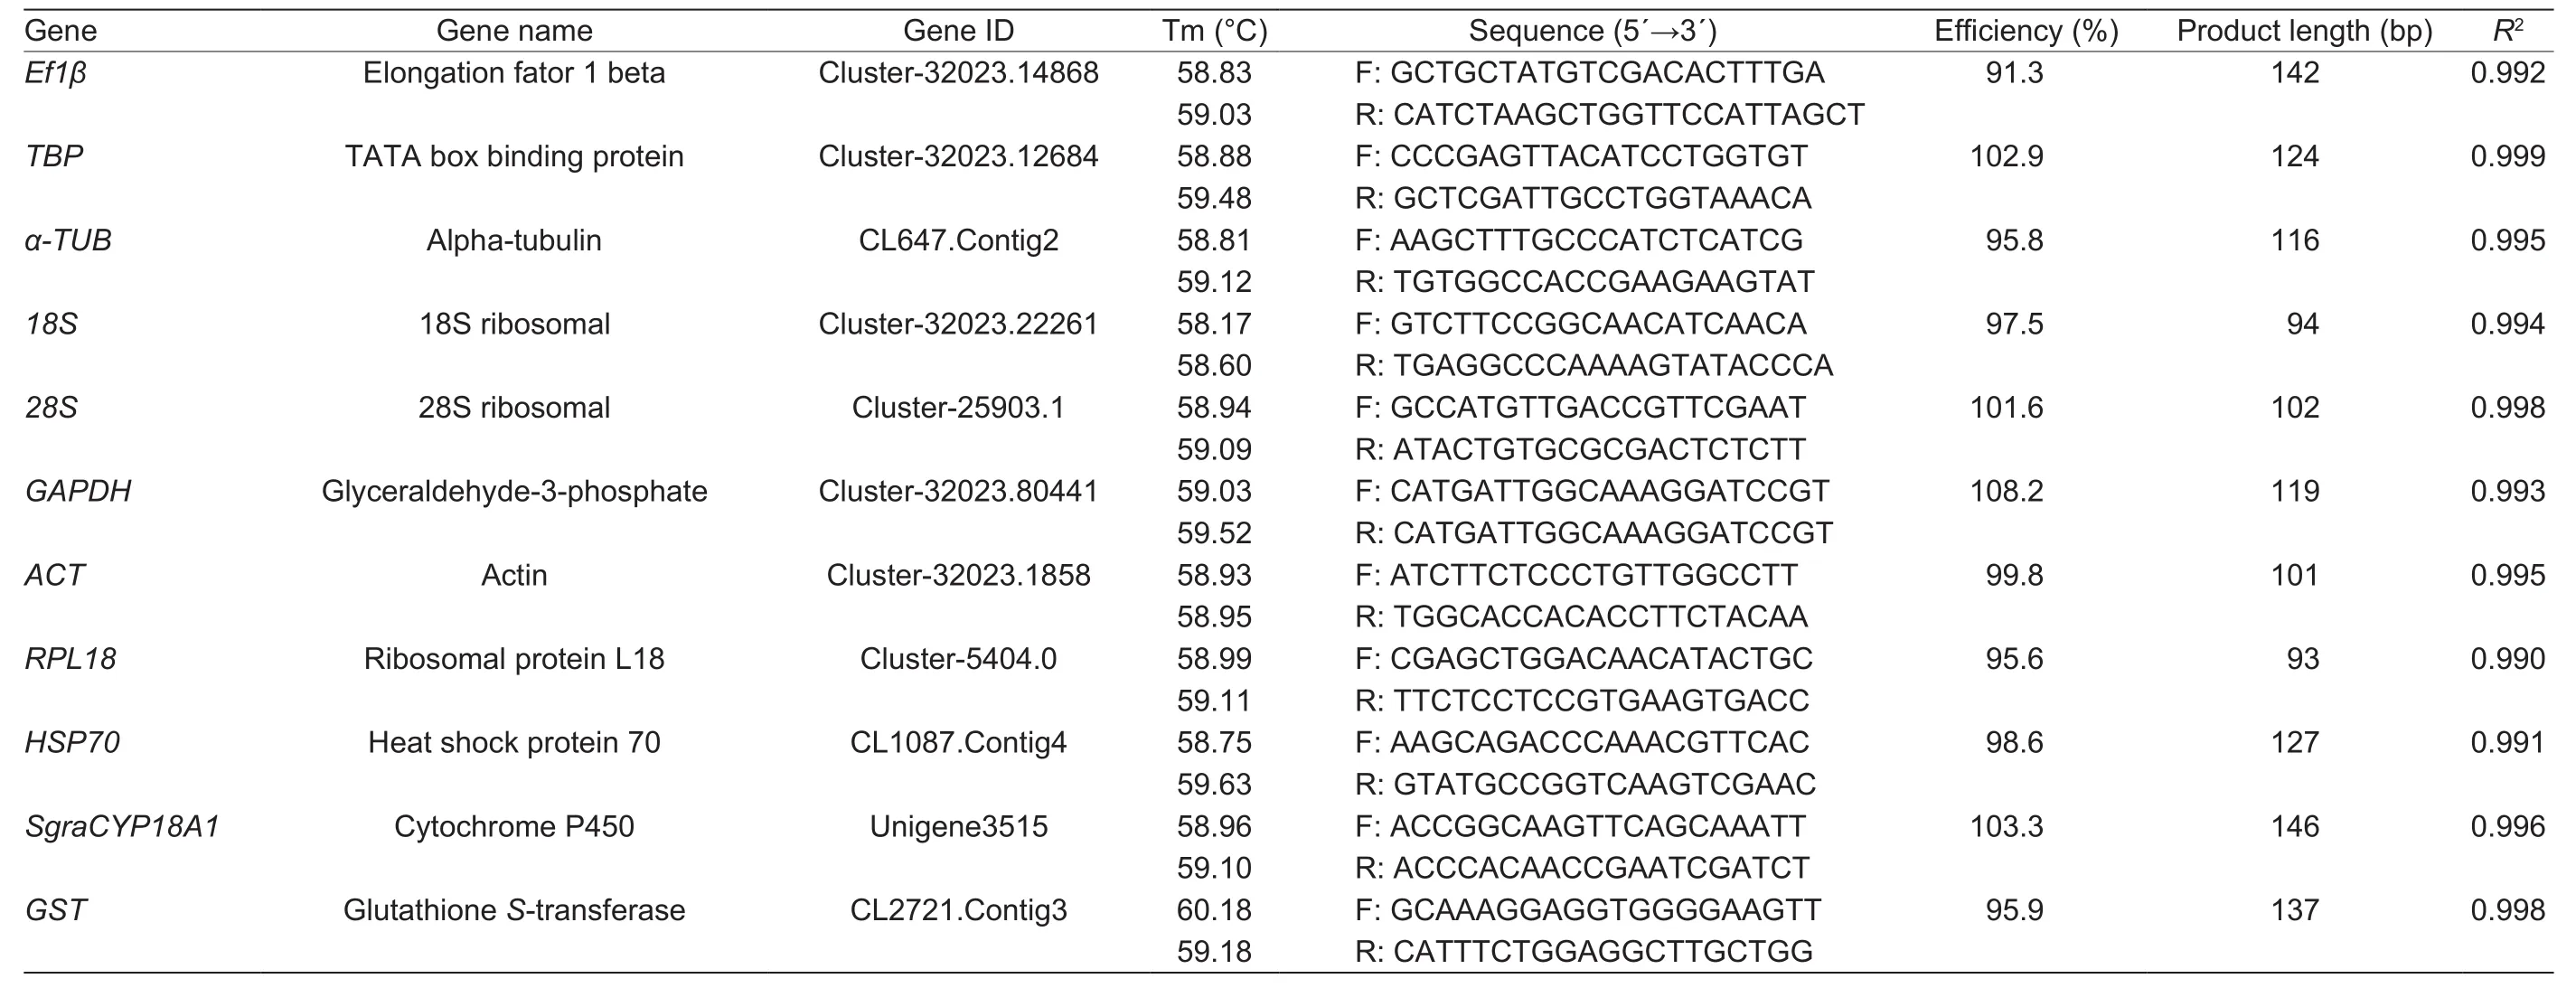
Table 1 Primer paris used for RT-qPCRanalysis of candidatereference genes, as wellas twotarget genes, HSP70and SgraCYP18A1
2.7. Analyses of the stability of reference gene expression
The geNorm software initially calculates the value of gene expression stability (M) and generates a stability ranking; genes with the lowest M value have the most stable expression. The geNorm also calculates pair-wise variation Vn/n+1, which represents the variation between two sequential normalization factors and determines the optimal number of reference genes required for accurate normalization. A Vn/Vn+1ratio below 0.15 suggest that the use of an additional reference gene would not significantly improve normalization. NormFinder software is a modelbased approach to identify suitable reference genes for use in normalization (Andersen et al. 2004), the candidate gene with the lowest value is considered the most stable reference gene. Excel-based software BestKeeper and the comparative ∆Ct method were also used to select optimal reference genes. A user-friendly web-based comprehensive tool, RefFinder online (http://150.216.56.64/referencegene.php) was used to evaluate and select reference genes. RefFinder combines the aforementioned major computational programs (∆Ct method, geNorm,Normfinder, and BestKeeper) to compare and rank the tested candidate reference genes. RefFinder also assigns an appropriate weight to each gene and calculates the geometric mean of the weights for thefinal ranking.
2.8. Validation of reference gene selection
To evaluate the validity of the selection of reference genes, the expression levels of three target genes,HSP70, SgraCYP18A1, and GST were analyzed under different experimental conditions (different developmental stages, tissues, and insecticide treatments). For each experimental condition, the expression profiles of HSP70,SgraCYP18A1, and GST were normalized using the most stable reference gene (NF1), the least stable reference gene (NF8) and several stable reference genes (NF(1-n))recommended by RefFinder. The relative expression levels of HSP70, SgraCYP18A1, and GST in different samples were calculated according to the 2-∆∆CTmethod (Livak and Schmittgen 2001).
2.9. Statisticalanalysis
Data organization was performed using Excel 2010 and lethal concentration of pesticides was calculated using Polo (probit and logit analysis) (LeOra Software Company,Petaluma, CA). The expression levels of target genes oneway ANOVA using InStat v.3.0 (GraphPad Software, San Diego, CA) with a significance level set at P<0.05.
3. Results
3.1. Traditional PCR amplification efficiencies and expression levels of candidate reference genes
Traditional PCR was used to evaluate the primer specificity of the eight reference genes and the three target genes of interest. Each primer pairs produced a single product through PCR, then analysis of melting curves showed that there was a single peak for each primer pairs. The amplification efficiencies of all the primer pairs were between 91.3 and 108.2%, and the coefficient of determination (R2)ranged from 0.990 to 0.999 (Table 1).
The Ct values were adopted to compare the transcript abundance of the selected genes in different samples.The mean Ct values of the eight reference genes varied significantly. The means of the Ct values ranged from 21.05 to 27.60, with the lowest and highest Ct values obtained from EF1β (21.05) and ACT (27.60), respectively. EF1β had the highest mean expression levels, followed by 18S (23.73),28S (24.13), α-TUB (24.23), TBP (25.72), GAPDH (26.05)and RPL18 (27.41) (Fig. 1).
3.2. Stability of the candidate reference gene expression
Analyses using four programs ranked the tested genes according to gene stability measured from the most stable(the lowest value) to the least stable (the highest value) as shown in Table 2.
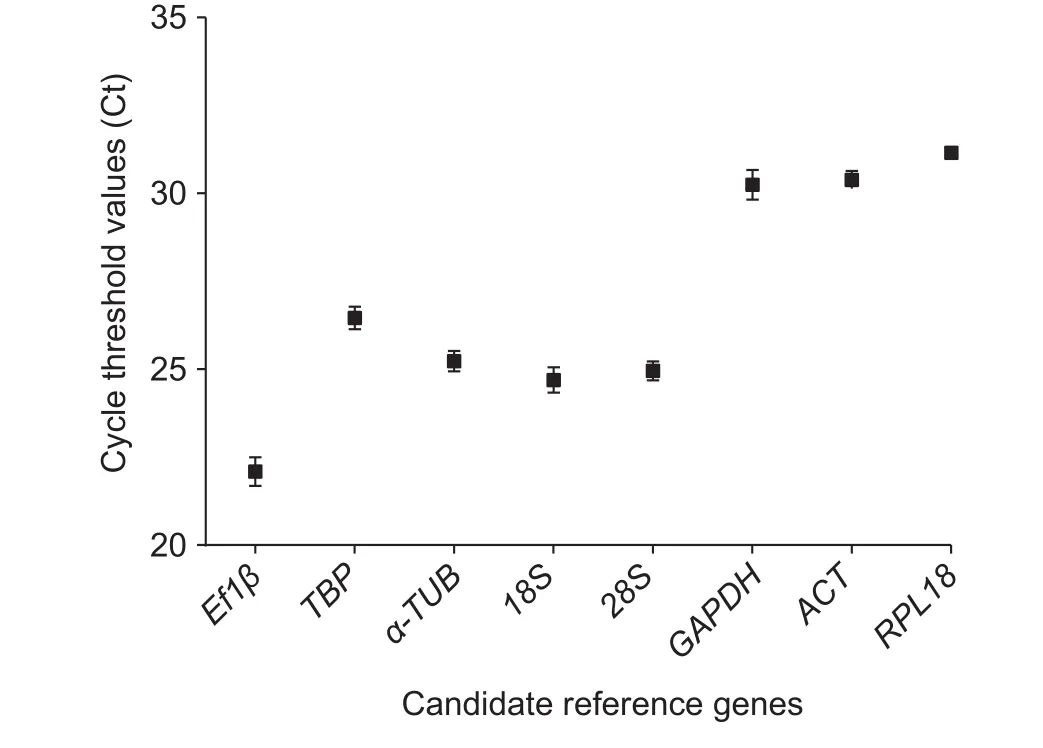
Fig. 1 Expression levels of candidate reference genes of Schizaphis graminumas indicated by Ct values. A higher Ct value indicates lower levelof expression. The black boxes indicate the mean values of all samples (n=27), and the whiskers indicate the standard error of the mean.
Different developmental stages The overall expression stability rankings produced by the four methods, ∆Ct method, BestKeeper, NormFinder, and geNorm, were almost identical, the top two stable reference genes were α-TUB and 28S (Table 2). According to the RefFinder method, the stability rankings from the most stable to the least stable were as follows: α-TUB, 28S, 18S, TBP, EF1β, ACT, GAPDH, and RPL18 (Fig. 2-A). In addition, RPL18 was identified by all the four methods as the least stably expressed reference gene. Moreover, using geNorm analysis, the V2/3was below the threshold of V=0.15 (Fig. 3), indicating that two most stable genes are required for normalization. Therefore, for the developmental stage experiments, α-TUB and 28S were appropriate to normalization.
Different tissues ∆Ct method and NormFinder identified 18S and ACT as the most stably expressed genes,BestKeeper selected 28S and α-TUB, while geNorm selected EF1β and TBP (Table 2). According to the RefFinder method, the stability rankings from the most stable to the least stable were as follows: 18S, ACT, α-TUB, 28S,EF1β, TBP, RPL18, and GAPDH (Fig. 2-B). Interestingly,GAPDH was identified by four methods as the least stably expressed reference gene. For geNorm analysis, allofthe Vn/n+1values were below the 0.15 cut-off value (Fig. 3),indicating that the two most stable genes are required for normalization. Therefore, for the different tissues, 18S and ACT were appropriate to normalization.
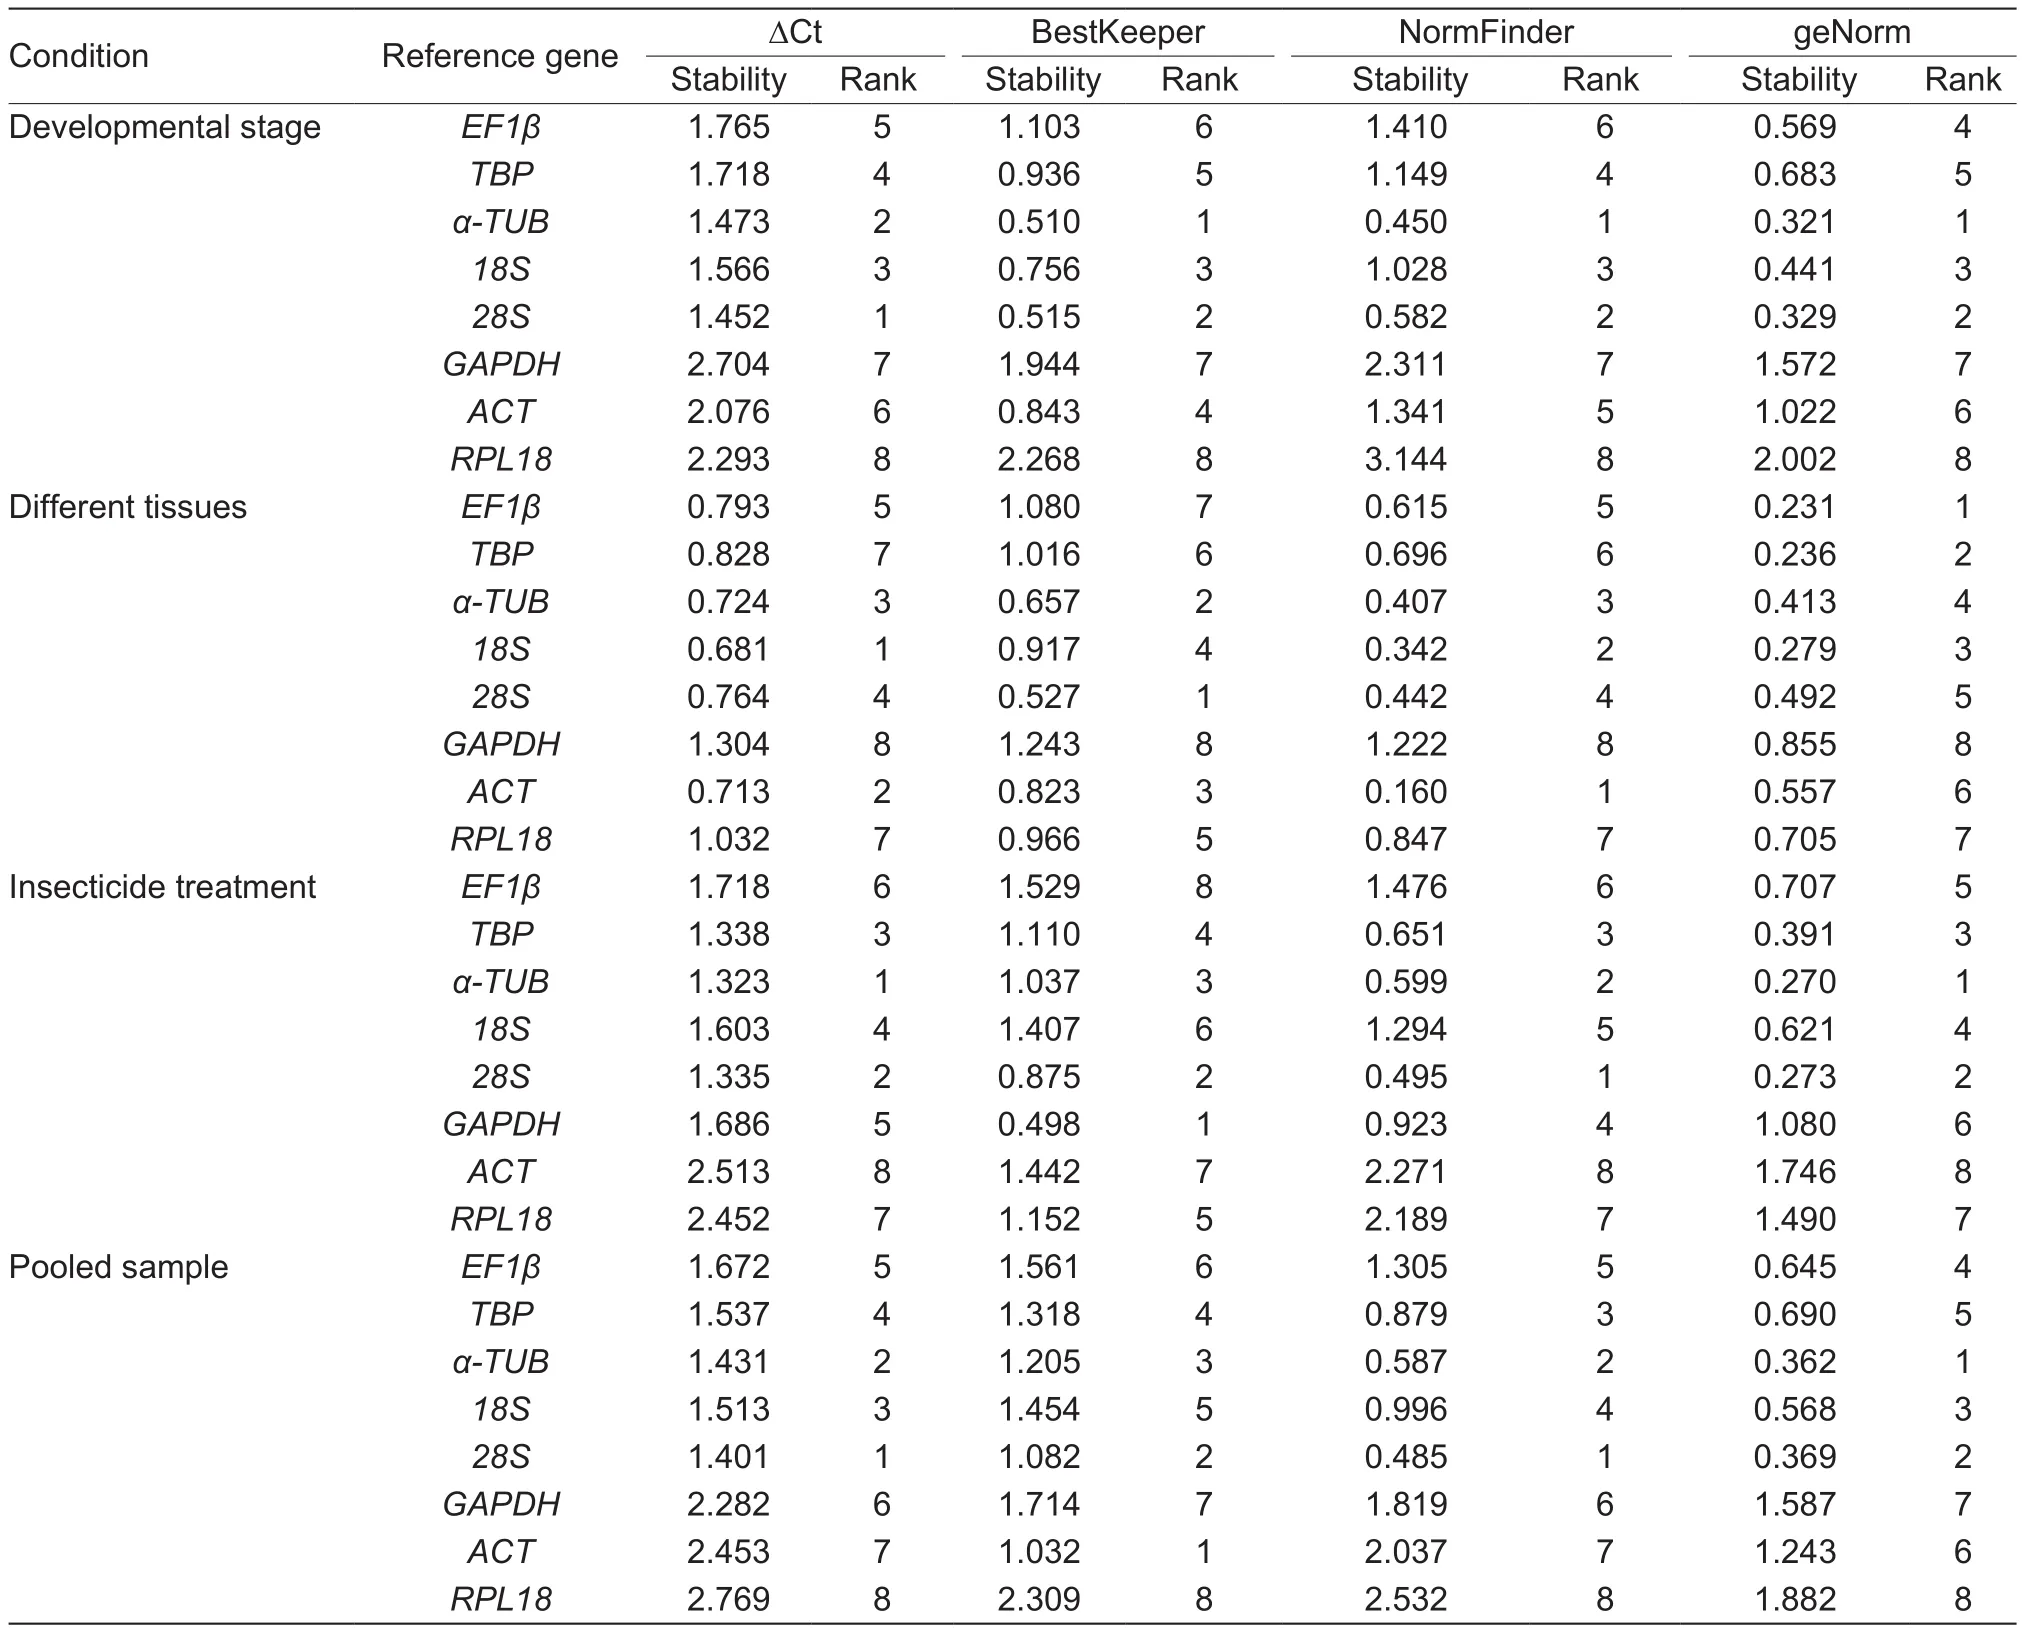
Table 2 Expression stability of the candidate reference genes under different experimental conditions

Fig. 2 Expression stability of the candidate reference genes under different experimental conditions calculated by RerFinder. A,different developmental stages. B, different tissues. C, insecticide treatments. D, pooled samples. A lower Geomean of ranking value indicates more stable expression.
lnsecticide treatments The stability rankings produced by∆Ct, NormFinder, and geNorm were similar, in that α-TUB and 28S were confirmed as the two most stably expressed reference genes, and ACT was identified by all the these three methods as the least stably expressed reference gene. BestKeeper identified GAPDH and 28S as the most stably expressed reference genes (Table 2). According to the RefFinder method, the stability rankings from the most stable to the least stable were as follows: 28S, α-TUB,TBP, GAPDH, 18S, EF1β, RPL18, and ACT (Fig. 2-C).For geNorm analysis, the V2/3was below the 0.15 cut-off value (Fig. 3). Thus, two reference genes were enough to normalize the gene expression levels in RT-qPCR analyses.Therefore, 28S and α-TUB were the most suitable for normalizing RT-qPCR data in the insecticide treatments.Pooled data of various conditions Stability rankings produced by ∆Ct method, NormFinder, and geNorm were similar, 28S and α-TUB were confirmed as the two most stably expressed reference genes. However, BestKeeper identifed ACT and 28S as the two most stably expressed reference genes (Table 2). According to the RefFinder method, the stability rankings from the most stable to the least stable were as follows: 28S, α-TUB, 18S, TBP, ACT,EF1β, GAPDH, and RPL18 (Fig. 2-D). Interestingly, RPL18 was identified by all the five methods as the least stably expressed reference gene. For geNorm analysis, the V2/3was below the 0.15 cut-off value (Fig. 3). 28S and α-TUB were suggested suitable for normalizing the RT-qPCR data in the insecticide treatments.
3.3. Validation of reference gene selection

Fig. 3 Optimal number of reference genes for normalization in Schizaphis graminum. The pairwise variation (Vn/n+1) was analyzed by geNorm Software between the normalization factors NFn and NFn+1 to determine the optimal number of reference genes required for accurate normalization in a given class of experiment. A value lower than 0.15 indicates that the use of additional reference genes would not significantly improve normalization.
To assess the stability of selected reference genes, the expression levels of HSP70, SgraCYP18A1, and GST were analyzed in the same experimental conditions used for the comparisons of the expression stability of the reference genes. The similar expression levels were obtained in the developmental stages when normalized using the most stable reference gene (α-TUB), the combination of the two most stable reference genes (α-TUB and 28S), and the least suitable reference gene (RPL18). HSP70 transcript level was the lowest infirst-instar nymphs while it was the highest in alate adults among all developmental stages,and no significant difference was observed betweenfirstand third-instar nymphs. However, the expression levelof HSP70 normalized by the most stable reference gene or the combination of the two best reference genes was significantly different from the expression level calculated using the least suitable reference gene among all developmental stages(P<0.05) (Fig. 4-A). Across different tissues, no evident difference of HSP70 transcript levels was observed between heads, thoraces and abdomens no matter whether it was normalized by the most stable reference gene (18S), the combination of the two most stable reference genes (18S and ACT), or the least stable reference gene (GAPDH). The expression levelof HSP70 normalized by the most stable reference gene or the combination of the two best reference genes was not significantly different from the expression level calculated using the least suitable reference gene in the abdomens (P<0.05) (Fig. 4-B). Across insecticide treatments, HSP70 transcript levels increased significantly in insecticide treatments compared with controls no matter whether it was normalized by the most stable reference gene(28S), the combination of the two most stable reference genes (28S and α-TUB), or the least stable reference gene (ACT). Furthermore, the expression levelof HSP70 normalized by the most stable reference gene or the combination of the two best reference genes was markedly different from the expression level calculated using the least suitable reference gene in the insecticide treatments(P<0.05) (Fig. 4-C).
A cytocrome P450 gene, SgraCYP18A1, whose transcript level was the lowest in alate adults while it was the highest in apterous adults among all developmental stages, showed no significant difference between third-instar nymphs and apterous adults. However, the expression levelof SgraCYP18A1 normalized by the most stable reference gene or the combination of the two best reference genes was significantly different from the expression level calculated using the least suitable reference gene among all developmental stages (P<0.05) (Fig. 5-A). Across different tissues, significant differences in SgraCYP18A1 transcript levels were observed among heads, thoraces and abdomens no matter whether it was normalized by the most stable reference gene (18S), the combination of the two most stable reference genes (18S and ACT), or the least stable reference gene (GAPDH). The expression levelof SgraCYP18A1 normalized by the most stable reference gene or the combination of the two best reference genes was significantly different from the expression level calculated using the least suitable reference gene in the abdomens (P<0.05) (Fig. 5-B). Across insecticide treatments, SgraCYP18A1 transcript levels increased significantly in insecticide treatments compared with controls no matter whether it was normalized by the most stable reference gene (28S), the combination of the two most stable reference genes (28S and α-TUB), or the least stable reference gene (ACT). Furthermore, the expression levelof SgraCYP18A1 normalized by the most stable reference gene or the combination of the two best reference genes was not significantly different from the expression level calculated using the least suitable reference gene in the insecticide treatments (P>0.05) (Fig. 5-C).
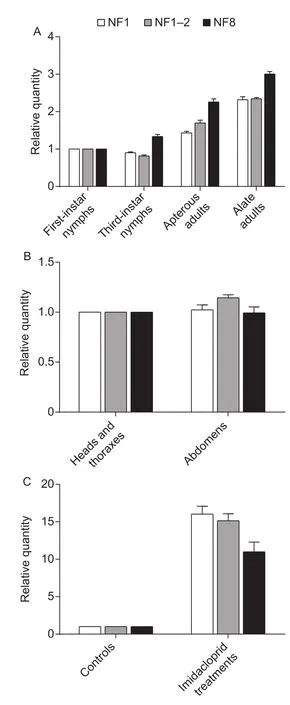
Fig. 4 Relative expression levels of HSP70 normalized usin g different sets of reference genes. A, expression levels in different developmental stages. B, expression levels in different tissues. C, expression levels in insecticide treatments. NF1,the most stable reference gene; NF1-2, the top two stable reference genes; NF8, the least stable reference gene. Bars represent the mean±SE of three biological replicates.

Fig. 5 Relative expression levels of a target gene of interest(SgraCYP18A1) calculated using different sets of reference genes. A, expression levels in different developmental stages.B, expression levels in different tissues. C, expression levels in insecticide treatments. NF1, the most stable reference gene;NF1-2, the top two stable reference genes; NF8, the least stable reference gene. Bars represent the mean±SE of three biological replicates.
For a detoxifying gene, GST, whose transcript level was the lowest in alate adults while it was the highest in apterous adults, we observed significant differences among all developmental stages. However, the expression levelof GST normalized by the most stable reference gene or the combination of the two best reference genes was significantly different from the expression level calculated using the least suitable reference gene in third-instar nymphs and apterous adults (P<0.05) (Fig. 6-A). Across different tissues, significant difference of GST transcript levels was observed between heads, thoraces and abdomens no matter whether it was normalized by the most stable reference gene(18S), the combination of the two most stable reference genes (18S and ACT), or the least stable reference gene(GAPDH). The expression levelof GST normalized by the most stable reference gene or the combination of the two best reference genes was significantly different from the expression level calculated using the least suitable reference gene in the abdomens (P<0.05) (Fig. 6-B). Across insecticide treatments, GST transcript levels increased significantly in insecticide treatments compared with controls no matter whether it was normalized by the most stable reference gene (28S), the combination of the two most stable reference genes (28S and α-TUB), or the least stable reference gene (ACT). Furthermore, the expression levelof GST normalized by the most stable reference gene or the combination of the two best reference genes was significantly different from the expression level calculated using the least suitable reference gene in the insecticide treatments (P<0.05) (Fig. 6-C).
4. Discussion
We found that 28S and α-TUB were the best reference genes according to the average expression stability or stability values acquired by ∆Ct method, geNorm, NormFinder and RefFinder while BestKeeper selected ACT and 28S. There were also some differences in developmental stages, tissues and insecticide treatments when the outcomes of the five methods were compared. Considering the developmental stages, ∆Ct method, BestKeeper, NormFinder, geNorm,and RefFinder all identified α-TUB and 28S as the most stable genes. Among different tissues, the most stable genes were RPL7 and EF1α (∆Ct method, NormFinder),28S and α-TUB (BestKeeper), EF1β and TBP (geNorm),and 18S and ACT (RefFinder), respectively. For insecticide treatments, the most stable genes were α-TUB and 28S(∆Ct, NormFinder, geNorm, and RefFinder), and GAPDH and 28S (BestKeeper), respectively. Based on the rankings from RefFinder, which integrates outcomes of the four major statistic algorithms (∆Ct method, geNorm, Normfinder, and Bestkeeper), and it also assigns an appropriate weight to an individual gene and calculates the geometric mean of their weight, 28S and α-TUB had a good performance under specific conditions.

Fig. 6 Relative expression levels of a target gene of interest(GST) calculated using different sets of reference genes.A, expression levels in different developmental stages. B,expression levels in different tissues. C, expression levels in insecticide treatments. NF1, the most stable reference gene;NF1-2, the top two stable reference genes; NF8, the least stable reference gene. Bars represent the mean±SE of three biological replicates.
Of these most commonly-used reference genes, GAPDH,EF1α, 18S, 28S and ACT tested in S. graminum varied considerably. rRNAs, including 18S rRNA and 28S rRNA,were commonly-used reference genes, as the levels of rRNA are thought to be less likely to vary due to under different conditions (Bustin 2000; Bagnalland Kotze 2010;Chandra et al. 2014). This is consistent with our results that 18S and 28S were the stable genes among the different developmental stages, tissues and insecticide treatments.However, 18S and 28S were the least suitable reference genes under the majority of the experimental conditions in other studies (Shen et al. 2010; Li et al. 2013; Chandra et al.2014; Liang et al. 2014; Yuan et al. 2014; Ma et al. 2016).ACT and GAPDH were the most frequently used reference genes for normalizing RT-qPCR (Ruan and Lai 2007; Lord et al. 2010; Pan et al. 2010; Gu et al. 2013). However, we found that ACT and GAPDH are also not ideal reference genes for all the studies of S. graminum, they are only suitable under certain experimental conditions and needed to cooperate with other reference genes to obtain a reliable result. These results indicate that the commonly-used reference genes are often not well-suited for normalization of all RT-qPCR data, and that researchers should pay more attention than they typically do when selecting genes to use as internal controls for normalization. EF1 (EF1α and EF1β) had been proven to be the optimal candidate reference gene for normalization in Agrilus planipennis(Rajarapu et al. 2012), Rhodnius prolixus (Majerowicz et al.2011), and cotton aphid Aphis gossypii (Ma et al. 2016).However, EF1β was not a preferable gene in S. graminum.RPL18 was the least suitable for normalization as a reference gene among different developmental stage,tissues, and insecticide treatments in S. graminum, though it was wellused in Schistocerca gregaria (Hiel et al. 2009),Delphacodes kuscheli (Maroniche et al. 2011), and A.gossypii (Ma et al. 2016). In addition, α-TUB was also one of the most suitable for normalization as a reference gene in all conditions in our study while it was least stable in all conditions in A. gossypii (Ma et al. 2016). These results suggested that the commonly-used reference genes are not well suited for normalization for all circumstances. Thus,these traditionally-used reference genes are not persistently and stably expressed in many species or experimental treatments (Chen et al. 2011; Chandna et al. 2012; Cheng et al. 2013), emphasizing the need to evaluate reference genes in S. graminum.
To validate these selected reference genes, the expression levels of HSP70, an important stress-inducible heat shock protein gene (Bettencourt et al. 2007), and two detoxifying genes, SgraCYP18A1 and GST, were analyzed in different developmental stages, tissues, and insecticide treatments. We found that using unsuitable reference gene for normalization might lead to deviated results. We advise to choose α-TUB and 28S in the developmental stage,18S and ACT in different tissues, and 28S and α-TUB in insecticide treatments. Therefore, choosing appropriate reference genes for normalization is a key precondition for the accurate estimation of target gene expression.
5. Conclusion
We studied eight candidate reference genes by four popular programs and ∆Ct method, and confirmed that α-TUB and 18S was the most suitable reference genes for exploring gene expression profiles among different developmental stages, different tissues and insecticide treatments. This not only provided useful reference to Northern blot and RT-PCR techniques that require a reference gene for normalization, but also identified several potential reference genes to accurately evaluate target gene expression profiles in S. graminum.
Appendix associated with this paper can be available on http://www.ChinaAgriSci.com/V2/En/appendix.htm
Acknowledgements
The authors are highly obliged to the National Key Research and Development Program of China (2017YFD0201700),the Key Science and Technology Program (Agriculture) of Henan, China (182102110053), the Major Projects of Henan Institute of Science and Technology, China (14QN024), the Project of High-Level Talent Introduction of Henan Institute of Science and Technology, China (208010616003), the Scientific and Technological Innovation of Henan Institute of Science and Technology, China (208010616005) for thefinancial support given to the present research work.
杂志排行
Journal of Integrative Agriculture的其它文章
- Agricultural remote sensing big data: Management and applications
- A mitochondrial phosphate transporter, McPht gene, confers an acclimation regulation of the transgenic rice to phosphorus deficiency
- Transcriptomic responses to aluminum (Al) stress in maize
- Overexpression of GmBIN2, a soybean glycogen synthase kinase 3 gene, enhances tolerance to salt and drought in transgenic Arabidopsis and soybean hairy roots
- A simple way to visualize detailed phylogenetic tree of huge genome-wide SNP data constructed by SNPhylo
- Effects of zinc fertilizer and short-term high temperature stress on wheat grain production and wheat flour proteins
