Reduction of mitomycin C resistance in human bladder cancer T24 cells by knocking-down ras oncogene
2018-07-27OsamaSharafEldinAbdelMotaalFoudaAmanyYoussefPeterHamiltonPerryMaxwellKateWilliamson
Osama Sharaf Eldin, Abdel-Motaal Fouda, Amany R. Youssef, Peter Hamilton, Perry Maxwell,Kate E. Williamson
1Weston General Hospital, Weston-super-Mare BS23 4TQ, UK.
2Faculty of Medicine, Mansoura University, Mansoura 35516, Egypt.
3Centre for Cancer Research and Cell Biology, Queen's University, Belfast BT9 7AE, UK.
Abstract Aim: Mitomycin C (MMC) is a commonly used as intravesical treatment for superficial bladder cancer. However, its role in combination with ras inhibition has not been investigated. The aim of this study was to explore the role of ras in MMC-induced apoptosis in T24 bladder cancer cells and to determine the efficacy of combination therapy in vitro.Methods: We measured the effects of various doses of MMC on apoptosis induction as well as on ras, ERK and Ki-67 protein expression by T24 cell line using immunocytochemistry, flow cytometry and Western blotting. We also tested the effect of siRNA on ras employed singly or in combination with MMC.Results: T24 cells expressed high level of ras protein. MMC treatment increased the level of ras and ERK protein expression after 24 h, and decreased these levels after 72 h. Ras siRNA (100 nmol/L) caused massive apoptosis associated with a marked decrease in ras expression in T24 cells. When combined with low doses of MMC, ras siRNA (50 nmol/L)sensitized T24 cells to apoptosis and decreased their expression of ras. The effect of combined therapy was higher than that of either compound used alone. Expression levels of ERK, a downstream target of ras, declined following combination therapy.Conclusion: Ras siRNA in combination with low dose MMC is a possible treatment strategy for patients with ras-positive bladder tumors.
Keywords: Mitomycin C, ras oncogene, T24 cells, bladder cancer, siRNA
INTRODUCTION
Bladder cancer is one of the leading causes of cancer-related death in the world[1]. Despite the increasing number of studies in recent years, the recurrence and progression of bladder cancer remains a challenge.Therefore, new strategies are necessary. The standard treatment for non-muscle-invasive transitional cell carcinoma of the bladder (TCCB) is transurethral resection and adjuvant intravesical chemotherapy or immunotherapy[2,3]. However, clinical effectiveness of mitomycin C (MMC) is often limited by the emergence of drug-resistant tumor cells[4,5]. Approximately 43% of the non-muscle-invasive bladder cancer relapses and about 8% progress to muscle-invasive disease[6].
A substantial body of literature has documented the association of bladder cancer and tumor resistance to chemotherapy with dysregulated production of the signal transducer protein ras[7]. This association was reported in the T24 bladder carcinoma cell line, where the first human oncogene was detected[8]. Subsequent studies have underscored the crucial role of mutated ras proteins in bladder cancer. Mutations in RAS genes can lead to production of a ras protein without intrinsic GTPase activity. Dysregulation of a variety of other upstream and downstream components of cell cycle progression, proliferation and apoptosis pathways ultimately leads to uninterrupted cell growth and carcinogenesis[9]. Overexpression of at least one of the three ras canonical proteins was shown in 77% of the analyzed tumors, with K-ras and N-ras primarily overexpressed in bladder carcinoma. H-ras was more frequently overexpressed in transitional cell carcinomas[10]. Even a single nucleotide polymorphism in the H-ras locus was associated with a higher risk of developing bladder carcinomas and with advanced, more aggressive types of cancer[11].
Mitogen-activated protein kinases (MAPKs) are an evolutionary conserved family of protein kinases[12,13]. In multicellular organisms, there are three well-characterized subfamilies of MAPKs. These MAPKs include the extracellular signal-regulated kinases, ERK1 and ERK2, the c-Jun NH2-terminal kinases, and the four p38 enzymes. The ERK1 and ERK2 pathway is one of the best characterized and the most strongly related to human cancer among MAPK pathways[12]. ERK-1 and ERK-2 are ubiquitously expressed and are involved in cell proliferation, differentiation, apoptosis, and angiogenesis. Oncogenic ras persistently activates the ERK-1/ERK-2 pathway, leading to increased proliferation rate and resistance of tumor cells[13].
Ras inhibition was employed as a treatment strategy to control cell proliferation, to induce apoptosis, and to increase the sensitivity of tumor cells to various tumor cell-killing agents[14]. The inhibition was targeted at many levels including RAS gene, ras mRNA (by small interfering RNA or siRNA) or by blocking ras protein anchorage to cell membranes. In addition, upstream activators of ras [growth factors and receptor tyrosine kinase (RTK) ligands] and downstream effectors (MAP kinases/ERK pathways) were targeted as a means to increase tumor cell sensitivity to apoptosis-inducing agents[15,16]. Unfortunately, little is known regarding knockdown of ras in bladder cancer cell lines using siRNA, despite the major role of ras in bladder cancer progression and chemotherapy resistance[2,17]. The aim of this study, therefore, was to elucidate the effect of knockdown of ras protein on the apoptotic response of MMC-resistant T24 cell lines. Although H-ras is the predominant mutated ras isoform in TCCB and in T24 cells, the presence of K-ras and N-ras may provide alternative pathways for tumor cell recovery and acquisition of resistance. Therefore, in this study,ras interference with the three isoforms of ras was employed to ensure potency.
METHODS
Cell culture
The human bladder cancer cell line T24, obtained from the European Collection of Authenticated Cell Cultures (ECACC), were grown in confuent monolayers with McCoy’s 5A medium (Sigma-Aldrich Co. Ltd.,Poole, Dorset, England) supplemented with 10% fetal calf serum (FCS), penicillin G (100 IU/mL), streptomycin(100 µg/mL), and L-glutamine (2 mmol/L) and were maintained at 37 °C with 5% CO2. Cells were grown on coverslips for subsequent morphology and immunocytochemistry. They were grown in T75 fasks for fow cytometry and Western blotting assessments.
Treatment protocols
MMC treatment: MMC cross links DNA, therefore, DNA damage is time- and concentration-dependent. In experiments examining the effect of MMC alone, MMC (Kyowa Hakko UK Ltd, England) containing media(0.1, 0.3, 1, 3, 10, 30, and 100 μg/mL) was applied to cells for 1h to simulate the microenvironment during intravesical therapy[18]. MMC containing media was then withdrawn and cells were washed and incubated with drug-free media to examine the delayed effects of MMC alone after 24 and 72 h.
Ras siRNA transfection: The siRNA used was a human pan-ras that targets all isoforms of ras. Human pan-ras siRNA and the non-targeting negative control siRNA were syntesized according to manufacturer’s instructions (siIMPORTER transfection kit, Upstate Biotechnology, VA, USA). In experiments examining the effect of ras siRNA alone, cells were transfected with pan-ras siRNA at concentrations of 50 and 100 nmol/L and were incubated in serum-free medium for 4 h at 37 °C. FCS was then added and cells were incubated for 72 h.A full set of controls were used to detect false-negative or false-positive results.
Combination treatment: In experiments that investigated the combined effect of MMC and ras siRNA, T24 cells were exposed to low concentrations of MMC (0.1, 0.3, 1, 3, and 10 μg/mL) for 1 h, and then were washed and further transfected with 50 nmol/L of ras siRNA. The effect of MMC-ras siRNA combination was tested after 72 h.
Morphological assessment of apoptosis
Tumor cells grown on coverslips were fixed in 70% alcohol for 1 h and stained with Giemsa or hematoxylin and eosin. We assessed architectural features which described the overall arrangement of the sheets of growing cells and the extent of cell loss, mitotic activity, apoptotic count, and the most prevalent apoptotic stage on a set of three slides, using the 40×, 100×, and 400× objectives on a Leica DM2500 microscope (Leica,Germany) equipped with high resolution DC300 Leica camera. A combined morphological scoring system was devised as follows: (1) apoptotic count/100 cells: 0-5 = 1; 5-10 = 2; > 10 = 3; (2) phase of apoptosis: early apoptosis shown by nuclear shrinkage and formation of cell blebbing = 1; late apoptosis shown by formation of apoptotic bodies = 2; (2) mitotic count/100 cells: decreased by one third = 1; decreased by two thirds = 2; no mitosis = 3; and (4) architectural pattern: irregular small clefts/spaces = 1; spaces coalesced = 2; large spaces with few cells = 3. All assessments were repeated three times by three independent observers.
Flow cytometric analysis
Progression of cells through the cell cycle and cell apoptosis were measured by propidium iodide (PI)/fuorescence-activated cell analysis of subGo/G1 DNA content[19]. After fixation in 70% alcohol for 1 h, cells were washed and suspended in 1 mL fuorescent probe solution containing PBS, 1% Triton X-100, 50 µg/mL PI and 0.5 mg/mL RNase for 30 min in the dark at room temperature. Ten thousand events were acquired in a Coulter Epics Elite fow cytometer (Beckman Coulter, Florida, USA) equipped with a 488 nm argon laser.Cells were discriminated according to levels of red fuorescence emitted from the PI, which was collected using the 610 nm long band pass filter. DNA histograms were analyzed using WinCycle version 3.0 (Phoenix Flow Systems, San Diego, USA).
Immunocytochemistry
Alcohol-fixed cells were washed prior to immunostaining using 5 µg/mL anti-pan-ras (clone RAS10, Upstate,VA, USA), 1 µg/mL rabbit polyclonal ERK-1, which reacts with both ERK-1 and ERK-2 (K-23; Santa-Cruz Biotechnology, Santa-Cruz, CA), 1 µg/mL mouse anti human Ki-67 (Clone MIB-1, Dako, UK) or matched isotypes IgG2a (ras) and IgG1 (ERK and Ki-67) at equivalent concentrations diluted in PBS with 0.04% Tween 80 (PBST). Immunoreactivity was visualized using HRP anti-mouse IgG (DAB+) EnVision Kit (Dako) and the stained slides were analyzed by digital image analysis.
Digital image analysis
Computer-aided quantification of ICC staining was performed based on the principle originally described by Dahab et al.[20]with slight modification[21]. Briefy, digital images were acquired at 100× using a Leica digital camera and were analyzed with VideoTesT-Morphology software (Russia). For ras and ERK, color sampling was selected and the number of selected pixels was read from the histogram of colors. The percentage per section was determined. We estimated Ki-67 labelling indices (LIs) refecting the proliferation activity of tumor cells according to a recently described method[22]. The Ki-67 LI was calculated as 100 × Ki-67 positive nuclei/(Ki-67-positive nuclei + Ki-67-negative nuclei) per image. Ten random images from each slide were analyzed and averaged.
Western blotting
5 × 10⁶cells were lysed for 15 min on ice using 300 µL of CelLytic-M Mammalian Reagent (Sigma-Aldrich,UK). Protein concentration in the supernatant was determined using the BCA Protein Assay Kit (Pierce,USA). Lysates were diluted in NuPAGE 4X LDS sample buffer (Invitrogen USA). Ten micrograms of the total protein were denatured, reduced, and resolved on NuPAGE Novex 4%-12% Bis-Tris Gels (Invitrogen,USA) by SDS-PAGE prior to transfer onto 0.2 µmol/L pore size nitrocellulose membrane. After incubation in blocking solution [1% bovine serum albumin (BSA) in Tween-20/TBS (TBST)] for 2 h at room temperature,membranes were incubated with 1 µg/mL anti-pan-ras or ERK antibodies diluted in 5 mL of TBST overnight at room temperature.
Statistical analysis
Statistical analysis was performed using SPSS 15.0 (SPSS Inc, Chicago, IL, USA). Data were quantified from triplicate samples and were presented as the mean ± SD. Multiple comparisons between means was performed using one-way ANOVA followed by Dunnett's post hoc test. A P-value of less than 0.05 was considered statistically significant.
RESULTS
T24 cells sensitivity after MMC treatment alone
Untreated T24 cells grew in irregularly dispersed sheets comprising cells of variable sizes and shapes [Figure 1].Apoptotic cells were only very occasionally identified, usually in the early apoptotic phase. Apoptotic bodies were observed 24 h after treatment with very low doses of MMC. The apoptotic count score was 1 after 1.0, 3.0,and 10 µg/mL, and increased to 2 after 30 and 100 µg/mL [Figure 2]. By contrast, the mitotic count decreased significantly at 10, 30 and 100 μg/mL, and this was refected as increases in the mitotic score. Architectural differences were observed after treatment with MMC 30 µg/mL (score = 1) and were more pronounced after treatment with 100 µg/mL (score = 2). There was a dose-dependent increase of subGo/G1 events as shown by DNA fow cytometry [Figure 3]. The intensity of ras and ERK immunoreactivity in T24 cells significantly increased 24 h after treatment with MMC doses ≥ 10 μg/mL, compared with that of untreated cells. This suggests enhanced ras protein synthesis countering the anti-proliferative effects of MMC (P < 0.001 for all).This was also confirmed by Western blot analysis of ras protein expression [Figures 4-6]. The percentage of Ki-67 labelled cells decreased progressively with increasing doses of MMC from 75.0% ± 7.0% without treatment to 15% ± 2.4% at 100 μg/mL (P < 0.001, Figure 7).
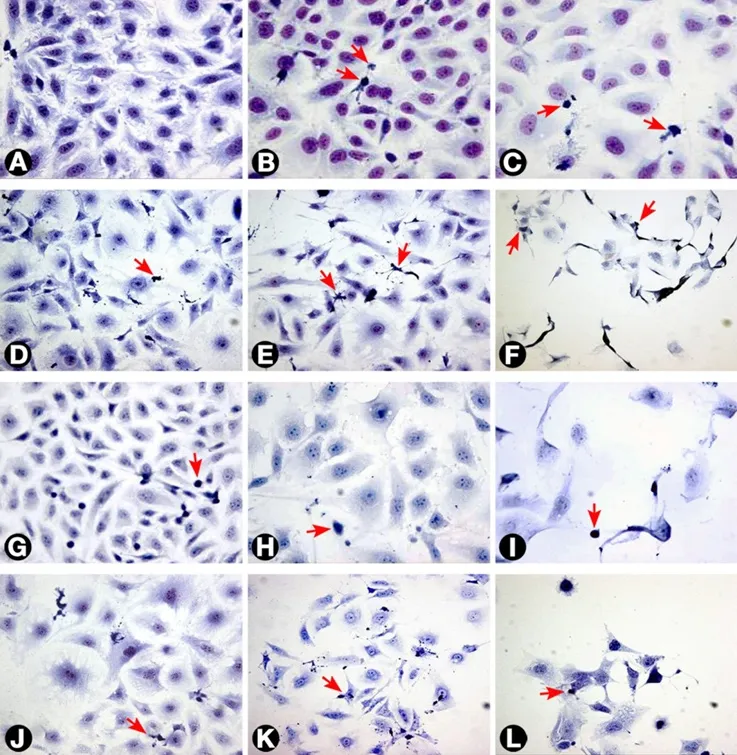
Figure 1. Morphology of T24 cells as seen with different treatments. (A) Untreated cells; (B and C) cells treated with 3 and 30 μg/mL MMC respectively after 24 h; (D) cells treated with 0.3 μg/mL MMC after 72 h; (E and F) cells treated with 3 and 30 μg/mL MMC after 72 h; (G) cells treated with negative control ras siRNA after 72 h; (H and I) cells transfected with 50 and 100 nmol/L ras siRNA after 72 h, respectively. The cells became larger with loss of spindling. The architecture was significantly disrupted with marked decrease in cellularity; (J, K and L) cells treated with 0.3, 3, and 10 μg/mL MMC, respectively, combined with 50 nmol/L ras siRNA after 72 h. The arrows indicate apoptotic cells (Giemsa 400×). MMC: mitomycin C
After 72 h, there were isolated strands randomly dispersed amongst large spaces at doses ≥ 3 µg/mL MMC[Figure 1]. The apoptotic count score was 1 after 0.1, 0.3, and 1.0 µg/mL. It reached a maximum of 3 after 10 µg/mL and, gradually began to decline at doses greater than 10 µg/mL [Figure 2]. Following treatment with 10, 30, and 100 µg/mL, mitotic count progressively decreased (score = 1, 2, and 3, respectively). There was substantial architectural deterioration (score = 3) at 100 µg/mL MMC. The amount of apoptosis, as assessed by DNA fow cytometry, was higher at 72 h than at the 24 h time point. Treatment with 1 µg/mL MMC induced a 1.9-fold increase in subGo/G1 events (P < 0.005), while treatment with 10 µg/mL induced a 3.8-fold increase in subGo/G1 events (mean subGo/G1 = 22.2 ± 3.9 compared with 5.8 ± 0.6 in untreated cells, P <0.001, Figure 3). The staining intensity of ras and ERK decreased progressively from 22.7% ± 3.5% and 17.2%± 3.1% in untreated cells, to 13.5% ± 2.2% and 9.4% ± 2.0%, respectively, after treatment with 10 µg/mL MMC(P < 0.001 for all), to nearly complete absence of staining of both proteins after treatment with 100 µg/mL MMC.These findings were confirmed using fow cytometry and Western blotting [Figures 4-6]. The percentage of Ki-67 labelled cells decreased significantly with increasing the dose and duration of MMC compared with that of untreated cells [Figure 7].
T24 cell sensitivity after ras siRNA treatment alone
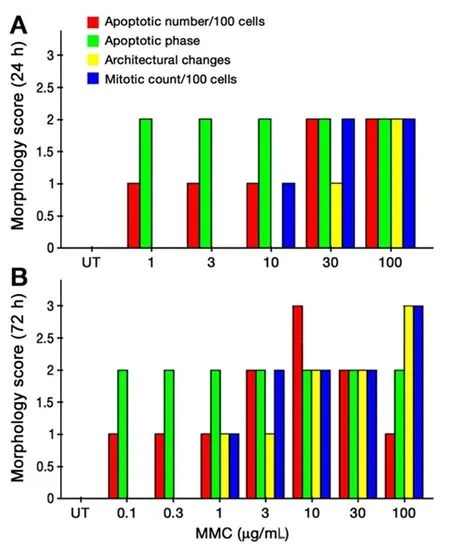
Figure 2. Combined morphological score of T24 cells after 24 h (A) and 72 h (B) of MMC treatment. MMC: mitomycin C; UT: untreated cells
ras siRNA treated cells were compared with control slides for better characterization of the effect of ras knockdown on the T24 cell phenotype. After 72 h of transfection with 50 nmol/L ras siRNA, T24 cells showed loss of spindling and substantial architectural disruption [Figure 1]. This was associated with increase in subGo/G1 events by 1.1-fold (P < 0.01 vs. untreated). Ras immunoreactivity decreased but ERK immunoreactivity increased. By contrast, 100 nmol/L of ras siRNA increased subGo/G1 events by 1.8-fold(P < 0.001 vs. untreated) and decreased both ras and ERK immunoreactivity [Figure 4]. These data were further supported by fow cytometry and Western blotting. The mean of Ki-67 labelled cells also decreased after transfection with 50 and 100 nmol/L ras siRNA (45.5% ± 5.4% and 36.2% ± 4.8%, respectively, compared with 72.0% ± 6.8% in control cells, P < 0.001 for both). Although there were few observed changes in the measured parameters following the use of negative control ras siRNA compared with the untreated cells,these changes were not significant as compared with the effects induced by ras siRNA at 50 and 100 nmol/L concentrations [Figure 4].
T24 cell sensitivity after combined MMC and ras siRNA treatment
Because of the significant cell death induced in T24 cells following the individual use of high concentrations of either MMC or ras siRNA observed in our pilot study, we used lower doses of MMC (maximal 10 µg/mL) in combination with low-dose ras siRNA (50 nmol/L) in the synergy experiment, and the results were assessed after incubation for 72 h of ras siRNA transfection. The morphological pattern of T24 cells treated with low concentrations of MMC in combination with 50 nmol/L ras siRNA was similar to that of cells treated with ten-fold high concentration of MMC alone [Figure 1]. In addition, the combined treatment with 10 µg/mL MMC and 50 nmol/L ras siRNA induced three times as many subGo/G1 events compared to the number induced by l0 µg/mL MMC alone [Figure 3]. The decrease in the intensity of ras and ERK immunoreactivity visualized after combined treatment was greater than that observed after either MMC or ras siRNA were used alone [Figures 4 and 6]. The staining values for ras and ERK proteins were significantly correlated(r = 0.867, Pearson correlation, data not shown). Significant synergistic effects were observed when MMC concentrations exceeded 1 µg/mL. The percentage of Ki-67-positive cells decreased progressively to reach the lowest value at 3 and 10 μg/mL of MMC. The decrease in Ki-67-positivity was greater than when either MMC or ras siRNA were used alone [Figure 7].

Figure 3. SubGo/G1events in T24 cells using DNA flow cytometry after 72 h of incubation with different concentrations of MMC alone (A) or in combination with ras siRNA (B). The DNA histograms illustrate an increase in percentage of SubGo/G1events at 30 and 100 μg/mL MMC.Combination with 50 nmol/L ras siRNA increased subGo/G1 events when compared with MMC alone. MMC: mitomycin C; UT: untreated cells
DISCUSSION
Therapy for bladder cancer remains associated with persistent high rates of failure resulting from the acquisition of chemoresistance. Therefore, novel therapeutic combinations and treatments are required to improve chemoresponsiveness. In this study, we investigated the synergistic antitumor effects of low doses of MMC and pan-ras siRNA in T24 bladder cancer cells that had previously been reported to be MMC-resistant[23]. We reasoned that the tumorigenic role of ras in T24 cells may provide key information to our understanding as to why 30% to 60% of bladder tumors that carry mutated ras have a propensity to induce tumor aggressiveness and resistance[17,24]. This direction was further suggested by the fact that T24 bladder cancer cells represent a wide variety of tumors carrying mutant ras protein that are clinically linked with occupational and environmental bladder cancers[25].
Finding a synergy between drug combinations should be examined carefully. The synergism should include augmentation of the action of one drug by another drug that has a different mechanism of action in contact with a common target. The common objective of MMC and siRNA synergy experiments is to break MMC resistance of T24 cells (induction of higher apoptosis level) through inhibition of ras-induced resistance. We tested the combination of MMC and ras siRNA for possible synergy using low doses of MMC and a fixed dose of 50 nmol/L of siRNA that was determined from pilot experiments (data not shown) to be the most suitable for combination with MMC. In addition, the understanding of the proper MMC dose/time point was acquired from preliminary experiments which suggested that MMC treatment using low concentrations over 72 h was the best combination regimen with ras siRNA. This pre-rationale assessment strategy meant that the siRNA study design was based on a solid background and knowledge of how the proteins behaved in response to single agents. This was extremely important because the “hit” of the second therapy could be timed to coincide with the lowest expression of the target.
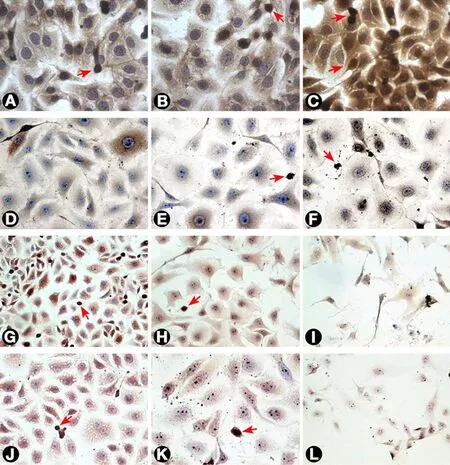
Figure 4. Ras expression by T24 cells as visualized by immunostaining. (A) Untreated cells; (B and C) T24 cells treated with 3 and 30 μg/mL MMC after 24 h. The intensity of staining increased after treatment as compared with untreated cells; (D, E, and F) cells treated with 0.3, 3, and 30 μg/mL MMC after 72 h, respectively. The staining intensity showed progressive reduction with increasing MMC dose to reach the minimum after treatment with 100 μg/mL (not shown); (G, H, and I) cells treated with negative control, 50, and 100 nmol/L ras siRNA after 72 h, respectively. The cells showed little intensity of staining when compared to negative control with the least intensity at 100 nmol/L; (J and K) cells treated with 0.3 and 3 μg/mL MMC, respectively, combined with 50 nmol/L ras siRNA and cultured for 72 h;(L) cells treated with 3 μg/mL MMC combined with 100 nmol/L ras siRNA and cultured for 72 h. The cells undergoing apoptosis or mitosis(arrows) were more intensely stained compared with other cells (400×). MMC: mitomycin C
We showed that T24 cells express more ras, supporting previous reports that ras expression was associated with tumor cell resistance[24,26]. We observed increased ras immunoreactivity in T24 cells 24 h after MMC treatment. This could be attributed to enhanced ras protein synthesis to counter the anti-proliferative effects of MMC. Previous reports have shown that expression of ras enhances pro-survival signaling pathways after DNA damage induced by chemotherapeutic agents[27,28]. Contrary to this effect, we observed ras immunoreactivity was decreased 72 h after treatment with low concentrations of MMC. This could be attributed to depletion of the protein synthesis capacity in T24 cells after 72 h[29]. These data suggest that ras siRNA would be most effective 72 h after treatment with low concentrations of MMC.
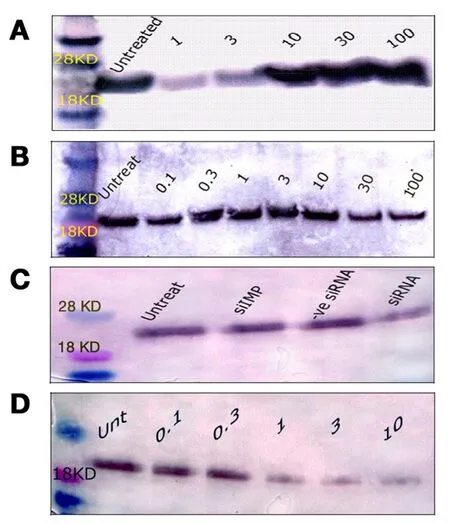
Figure 5. Western blotting of ras protein expression in T24 cells. (A) ras protein expression 24 h after treatment with 1, 3, 10, 30, or 100 μg/mL MMC; (B) ras protein expression 72 h after treatment with 0.1, 0.3, 1, 3, 10, 30, or 100 μg/mL MMC. There was a progressive decrease of the blot thickness and intensity with increasing doses of MMC; (C) the level of ras following 50 nmol/L ras siRNA was low compared with untreated cells, or with other controls; (D) ras protein changes 72 h after low doses of MMC combined with 50 nmol/L of ras siRNA. All bands appeared between 18 and 28 kDa at the standard ras molecular weight of 21 kDa when compared with the molecular weight marker. MMC: mitomycin C
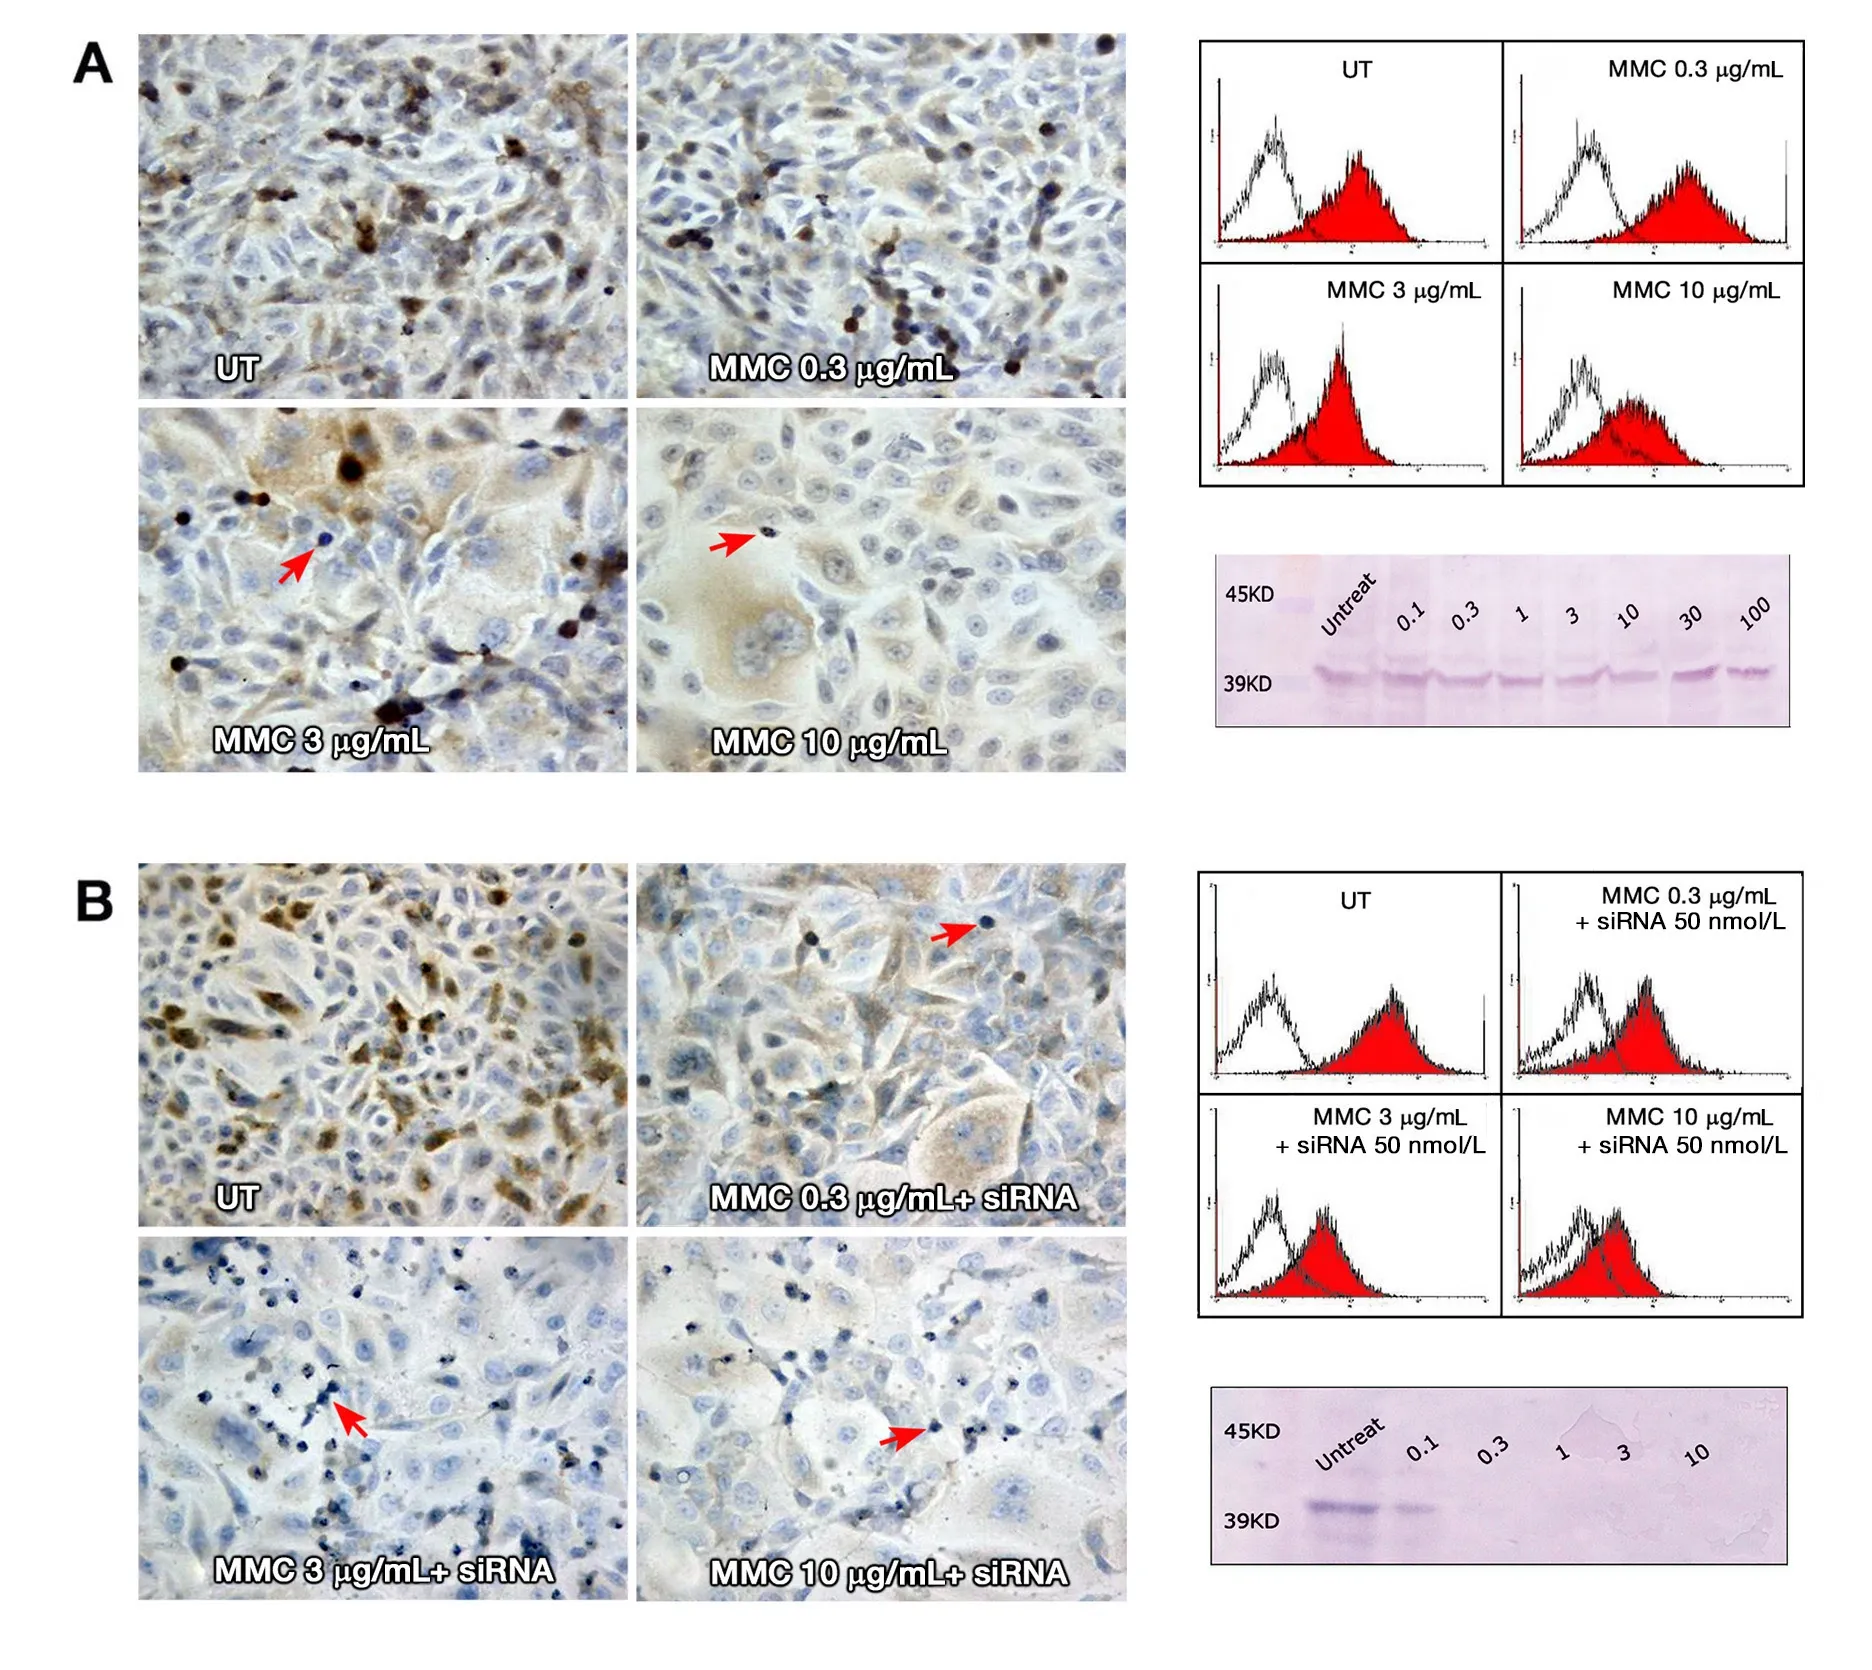
Figure 6. (A) ERK expression in T24 cells 72 h after MMC treatment alone. ERK staining showed progressive decline in the staining intensity with increasing MMC dose; (B) ERK staining with MMC combined with siRNA, where the decline in staining intensity was greater when MMC was combined with ras siRNA. In all slides, the apoptotic and mitotic cells (arrows) were negative for ERK staining(200×). To the right, overlay histograms of flow cytometry show the extent of ERK specific fluorescence (red-filled) in comparison to isotype control fluorescence (unfilled). Western blot traces show mild decrease of the blot thickness and intensity at 10, 30, and 100 μg/mL MMC compared to the UT control (above), with nearly complete absence of the blot when MMC was combined with ras siRNA(below). All the bands appeared between 39 and 45 kDa on the molecular marker at the standard ERK 1/2 molecular weight of 42/44 kDa. MMC: mitomycin C; UT: untreated cells
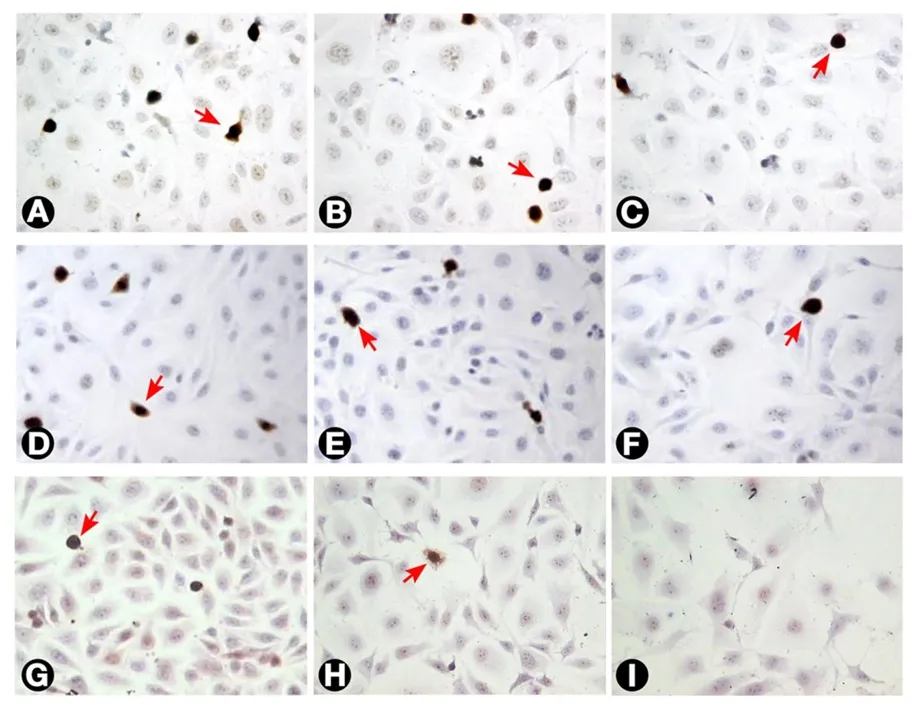
Figure 7. The incidence of Ki-67 labelled T24 cells as seen with different treatments. (A) Untreated cells; (B and C) cells treated with 3 and 10 μg/mL MMC, respectively, after 24 h; (D, E, and F) cells treated with 0.3, 3, and 10 μg/mL MMC, respectively after 72 h.The percentage of Ki-67 labelled cells (arrows) decreased progressively with increasing dose and duration of MMC treatment; (G, H,and I) cells treated with 0.3, 3, and 10 μg/mL MMC combined with 50 nmol/L ras siRNA after 72 h. The decrease in Ki-67 positivity was higher than with MMC alone (200×). MMC: mitomycin C
ERK is the direct downstream effector pathway responsible for cell resistance, and hence acts as a surrogate marker of ras activation status and expression levels[30]. To explore further the effects of ras siRNA alone and in combination with MMC, we designed a set of experiments employing the anti-ERK1/ERK2 antibody.Several studies have shown that ras activates a number of signal transduction pathways, including the RAF-MAP2K-MAP kinase pathway[16,31]. MAP kinases including ERK1/ERK2 have also been shown to be activated following radiation through this pathway. Activation was dependent on mutant ras in T24 cells,while wild type ras, which is induced by radiation in RT4 cells, was independent of ras[32]. This substantial body of literature would suggest that ERK plays a critical key role downstream of ras activation[9,13]. In our study, low concentrations of MMC, 100 nmol/L ras siRNA, and combination therapies decreased ERK immunoreactivity and were associated with increased apoptosis, while 50 nmol/L ras siRNA increased ERK immunoreactivity and was associated with only marginal apoptosis. On the other hand, the increase in ERK after 50 nmol/L ras siRNA may be explained by Mishra et al.[33], who identified the presence of a rasindependent pathway for ERK stimulation through the Rap-1 cascade of MAP kinase activation.
We speculate that a small reduction in ras protein levels could be compensated for by ras-independent pathways, but that significant decreases in combination with inhibition of ras synthesis would not be compatible with compensatory mechanisms. Hence the combination of ras siRNA and MMC was synergistic and achieved the greatest decreases in ras synthesis and ERK expression. This combination of withdrawal of survival factors and induction of apoptosis achieved a synergistic combination through targeting different pathways of apoptotic resistance[34]. Interconnectivity of oncogenic signal transduction networks leads to drug resistance. This underscores the need to investigate combination therapies which inhibit two pathways or which are designed to hit one pathway and its corresponding feedback loop[35].
In conclusion, the data presented in this study suggest that T24 cell resistance to MMC-induced apoptosis is dependent on ras activation. We demonstrated that ras siRNA knockdown in combination with low dose MMC was synergistic in T24 cells at specific pre-determined optimal timings. Translation of this therapeutic strategy may be feasible following validation of in vivo timing to ensure that ras siRNA administration coincides with optimal MMC effects.
DECLARATIONS
Authors’ contributions
Conceptualization, methodology, software, formal analysis, investigation, resources, data analysis, writing original draft, review and editing, visualization, and project administration: Sharaf Eldin O
Conceptualization, methodology, formal analysis, investigation, resources, data curation, writing original draft, and revision of the final version: Fouda AM
Conceptualization, methodology, validation, investigation, data analysis, and revision: Youssef AR
Conceptualization, methodology, validation, investigation, resources, review and editing, visualization,supervision, and project administration: Hamilton P
Investigation, resources, revision: Maxwell P
Conceptualization, methodology, validation, formal analysis, investigation, resources, data analysis, writing original draft and editing, visualization, supervision, and project administration: Williamson KE
Data source and availability
Corresponding author may be contacted for any data inquiries.
Financial support and sponsorship
None.
Conflicts of interest
There are no conficts of interest.
Patient consent
Not applicable.
Ethics approval
This research study was approved by the institutional review board of the study site.
Copyright
© The Author(s) 2018.
杂志排行
Cancer Drug Resistance的其它文章
- Resistance mechanism to cisplatin in NCl-H460 non-small cell lung cancer cell line: investigating apoptosis, autophagy, and cytogenetic damage
- lmproved potency of F10 relative to 5-fluorouracil in colorectal cancer cells with p53 mutations
- ldentification and targeting of CD22ΔE12 as a molecular RNAi target to overcome drug resistance in high-risk B-lineage leukemias and lymphomas
- How to overcome ATP-binding cassette drug efflux transporter-mediated drug resistance?
- Cancer drug resistance: a new perspective
