Feature Selection Method Based on Class Discriminative Degree for Intelligent Medical Diagnosis
2018-07-12ShengqunFangZhipingCaiWenchengSunAnfengLiuFangLiuZhiyaoLiangandGuoyanWang
Shengqun Fang, Zhiping Cai, , Wencheng Sun, Anfeng Liu, Fang Liu, Zhiyao Liangand Guoyan Wang
Abstract:By using efficient and timely medical diagnostic decision making, clinicians can positively impact the quality and cost of medical care. However, the high similarity of clinical manifestations between diseases and the limitation of clinicians’ knowledge both bring much difficulty to decision making in diagnosis. Therefore, building a decision support system that can assist medical staff in diagnosing and treating diseases has lately received growing attentions in the medical domain. In this paper, we employ a multi-label classification framework to classify the Chinese electronic medical records to establish corresponding relation between the medical records and disease categories, and compare this method with the traditional medical expert system to verify the performance.To select the best subset of patient features, we propose a feature selection method based on the composition and distribution of symptoms in electronic medical records and compare it with the traditional feature selection methods such as chi-square test. We evaluate the feature selection methods and diagnostic models from two aspects, false negative rate (FNR) and accuracy. Extensive experiments have conducted on a real-world Chinese electronic medical record database. The evaluation results demonstrate that our proposed feature selection method can improve the accuracy and reduce the FNR compare to the traditional feature selection methods, and the multi-label classification framework have better accuracy and lower FNR than the traditional expert system.
Keywords:Medical expert system, EMR, multi-label classification, feature selection,class discriminative degree.
1 Introduction
Medical diagnostic decision making refers to the process of evaluating a patient complaint to develop a differential diagnosis, design a diagnostic evaluation, and arrive at a final diagnosis. The traditional method taken by doctors to diagnose the patients is mostly based on doctors’ professional knowledge, work experience and test results.
However, this diagnostic process is full of uncertainty and diagnostic results are closely related to the doctors’ professional competence, especially for those complex medical records. At the same time, with the continuous development in the medical field, the disciplines of clinical medicine are getting more detailed. The doctors in different departments only pay attention to the subjects they have learned, which means that it is difficult for the doctors to conduct a comprehensive analysis on all aspects of the patients[Tang, Liu, Zhang et al. (2018)]. Accordingly, how to use information technology to develop a medical decision support system (MDSS) has become a hot research topic.
The first MDSS is an expert system based on knowledge base and rules of inference that utilizes computer technology to simulate the process of diagnosis and treatment that are usually done by medical experts. The United States started the earliest research on the medical expert system. The two most famous ones are the MYCIN expert system[Shortliffe, Davis, Axline et al. (1975)] developed by Stanford University in 1976 for the diagnosis and treatment of bacterial infections, and the Internist-I Internal Medicine Computer-Aided Diagnostic System [Miller, McNeil, Challinor et al. (1986)] developed by the University of Pittsburgh in 1982. With the development of information technology,the medical expert system becomes more complex. In Norouzi et al. [Norouzi,Yadollahpour, Mirbagheri et al. (2016)] build an adaptive neurofuzzy inference system using 10-year clinical records of newly diagnosed chronic kidney disease patients. In Ba¸sçiftçi et al. [Ba¸ sçiftçi and Avuçlu (2018)] develop a new Medical Expert System (MES)which uses Reduced Rule Base to diagnose cancer risk according to the symptoms in an individual and a total of 13 symptoms. By controlling reduced rules, results are found more quickly. However, most of the expert systems are not intelligent enough. They only save the inference rules, professional knowledge and work experience summarized by the medical experts to the computer, and then get the diagnostic results through simple reasoning. On the one hand, it is not easy to put forward a sound and complete set of inference rules because the problems faced by doctors are very complicated. On the other hand, there is a limitation in the professional knowledge of the medical experts.
Text categorization (also known as text classification or topic spotting) is the task of automatically sorting a set of documents into categories from a predefined set [Liu, Dong,Liu et al. (2018)]. In the medical field, the documents refer to electronic medical records and the categories refer to disease types, therefore we can apply the data mining technologies on EMR [Sun, Cai, Liu et al. (2017)] to disease diagnosis. The workflow of traditional text categorization includes text preprocessing, text representation, feature selection and model construction, in which feature selection is extremely important primarily because it serves as a fundamental technique to direct the use of variables to what's most efficient and effective for a given classification model. However, features selected by traditional methods can be unrepresentative and highly sparse sometimes[Huang, Liu, Zhang et al. (2018)]. Under this circumstance, we need to acquire features manually. In recent years, the research idea of building language models using neural networks has become more and more mature. By using word embedding such as one-hot representation, combined with deep learning frameworks, feature selection can be omitted. In 2013, Mikolov et al. [Mikolov, Yih and Zweig (2013)] propose the word2vec model, which effectively solved 2289 the curse of dimensionality problem in the traditional one-hot word vector representation method and made further development oftext classification using deep learning algorithms [Wang, Chang, Li et al. (2016);Johnson and Zhang (2015)].
In order to take advantage of machine learning techniques, this paper applies text classification algorithms to medical diagnosis, and proposes an intelligent diagnosis model. The demonstration of the proposed framework is shown in Fig. 1.
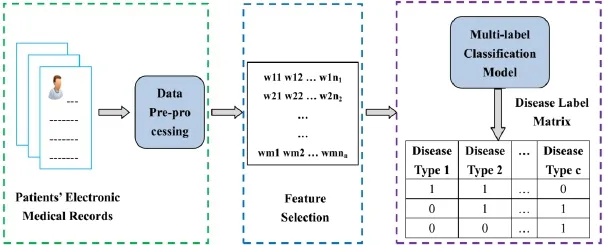
Figure 1: Workflow demonstration of the proposed framework. The green box on the left contains the data pre-processing. The blue central box mainly select the features using chi-square test and the proposed method in this paper. The purple box on the right shows the process of building a model using a multi-label classification algorithm
The main contributions of this paper can be summarized as follows:
· Feature selection (also known as subset selection) [Chandrashekar and Sahin (2014);Sun, Cai, Li et al. (2018)] is a widely employed technique for reducing the dimensionality of the dataset. It aims to select a subset of variables from the input which can efficiently describe the input data while reducing effects from noise or irrelevant variables and still provide good prediction results. We propose a feature selection method based on the composition and distribution of symptoms in electronic medical records and compare it with traditional feature selection methods such as chi-square test.
· Decision support for medical diagnosis is actually a multi-label classification problem,which means the patient, according to the medical records, is labeled as belonging to multiple disease classes. We adopt a variety of multi-label classification algorithms, such as binary relevance SVM (BR-SVM), multi-label kNN (MLkNN), etc. and compare the performance of different algorithms.
· To compare the performance of the proposed model with the medical expert system,we have invited medical experts from the cooperative hospital to construct a medical expert system.
· Extensive experiments have been conducted on a real-world Chinese medical record database obtained from the cooperative hospital. The experimental reports have shown that our proposed method is more effective for performing feature selection than the compared approaches and the intelligent diagnosis model is more effectivethan the medical expert system in diagnosing diseases.
The rest of this paper is organized as follows: Related work will be reviewed in Section II.We will elaborate our method in detail in Section III, followed by evaluation reports in Section IV. We conclude the paper in Section V.
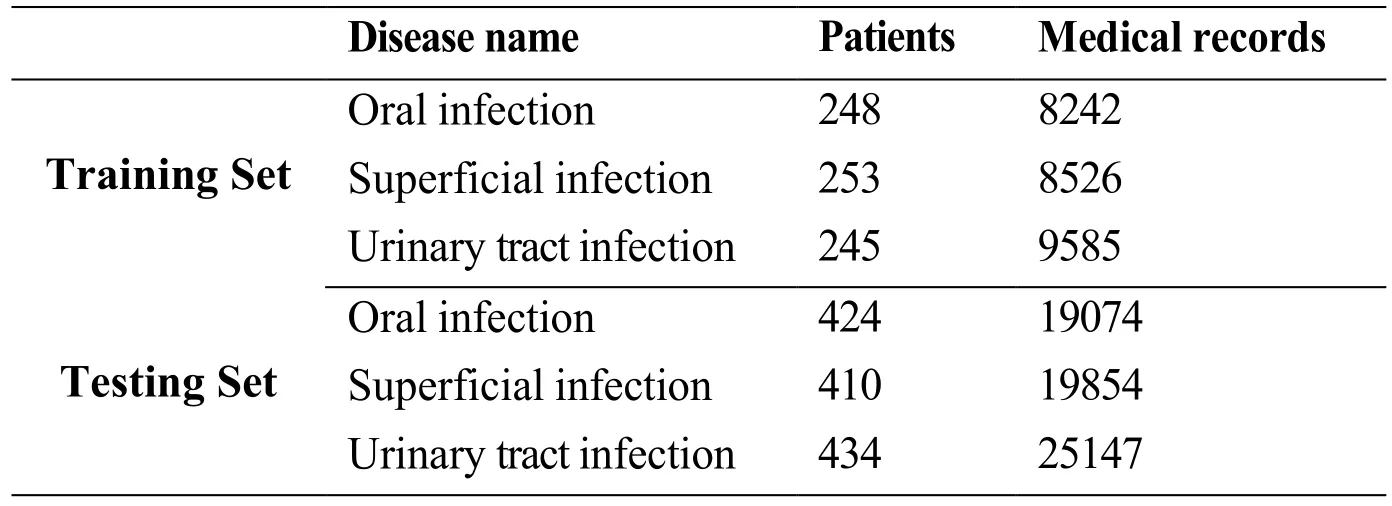
Table 1: Summarization of the dataset
2 Related work
2.1 Medical feature selection
There are no word boundaries in Chinese text. Therefore, unlike English, word segmentation is required before the feature selection for Chinese original text. We build a dictionary based on the names of Chinese medicines and diseases to improve the effect of word segmentation. There are three broad classes of feature selection algorithms[Chandrashekar and Sahin (2014)]: Wrapper, Filter and Embedded methods. Wrapper methods utilize the classifier as a black box to score the subsets of features based on their predictive power and the most commonly used classifier is SVM. Wrapper methods can be divided into deterministic and randomized [Saeys, Inza and Larrañaga (2007)]. The representative algorithms of the former include sequential forward selection (SFS) and sequential backward elimination (SBE), and the representative algorithms of the latter include Simulated annealing Randomized hill climbing and Genetic algorithms. Filter methods select features based on discriminating criteria that are relatively independent of classification and the commonly used criteria include simple correlation coefficients and mutual information. Filter methods can also be splitted into two categories [Saeys, Inza and Larrañaga (2007)]: univariate and multivariate. The commonly used feature selection methods, such as chi-square test, information gain and gain ratio belong to the former type and the latter type includes correlation-based feature selection (CFS) and Markov blanket filter (MBF). For Embedded methods, the feature selection algorithms are embedded as part of the learning algorithm and the typical algorithms include ID3, C4.5 and CART. In this paper, we summarize the characteristics of the Chinese electronic medical records and propose a feature selection method based on these characteristics.
2.2 Multi-label classification in disease diagnosis
Multi-label classification has been well studied in recent years [Zhao, Huang, Wang et al.(2015); Zhang and Wu (2015); Zhu, Li and Zhang (2016); Chen, Ye, Xing et al. (2017);Tabatabaei, Dick and Xu (2017)]. The existing strategies could be roughly categorized into three families, based on the order of correlations that the learning techniques have considered [Zhang and Zhou (2014)]: (i) First-order strategy; (ii) Second-order strategy;(iii) High-order strategy. The latter two strategies consider the relevance between labels.In the medical field, patients may suffer from multiple diseases at the same time, so multi-label classification has attracted more and more research attention to this domain.Stefano et al. [Bromuri, Zufferey, Hennebert et al. (2014)] propose multi-label classification of multivariate time series contained in medical records of chronically ill patients. Many researches on multi-label classification have already pointed out that the potential correlations between labels have great impact on the classification performance.Wang et al. [Wang, Chang, Li et al. (2016)] propose an algorithm which can capture the disease relevance when labeling disease codes rather than making individual decision with respect to a specific disease, and the evaluation results demonstrate that the method improves multi-label classification results by successfully incorporating disease correlations. In this paper, we use the co-occurrence information of diseases as an indicator to measure the relevance of the diseases and set a threshold to determine whether the diseases are related or not. In our framework, we leverage BR-SVM and MLkNN to solve the multi-label classification problem. BR-SVM [Zhang, Cai, Liu et al.(2018)] attempts to convert the multi-label problem into single-label problem and MLkNN attempts to modify single-label classification algorithm to solve the multi-label classification directly.

Table 2: Co-occurrence frequencies of the 3 diseases
3 Methods
In this section, we first introduce the details of the data pre-processing method, followed by feature selection from the electronic medical records will be elaborated. A medical expert system and an intelligent diagnosis model based on the multi-label classification algorithms are subsequently built to solve the aforementioned problems.
3.1 Data pre-processing
Data pre-processing involves the following steps:
· Remove the negative phrases. There are many negative phrases in Chinese electronic medical records, for instance, “history of negative hepatitis”. However, these phrases have little or no effect on the diagnosis. Therefore we collect negative words frequently used in medical records and form a negative word list to eliminate these phrases.
· Word segmentation. Word segmentation is needed for electronic medical record beforefeature selection. On the one hand, Chinese medical records often contain a lot of noises, for example, a large number of typos are recorded or different descriptions of the same symptom in different hospitals. On the other hand, there are a lot of medical terminologies, such as chronic sore throat. To improve the performance of word segmentation, we build a dictionary based on the names of Chinese medicines crawled from the official website of the State Food and Drug Administration and the names of Chinese diseases extracted from ICD-10 disease code.
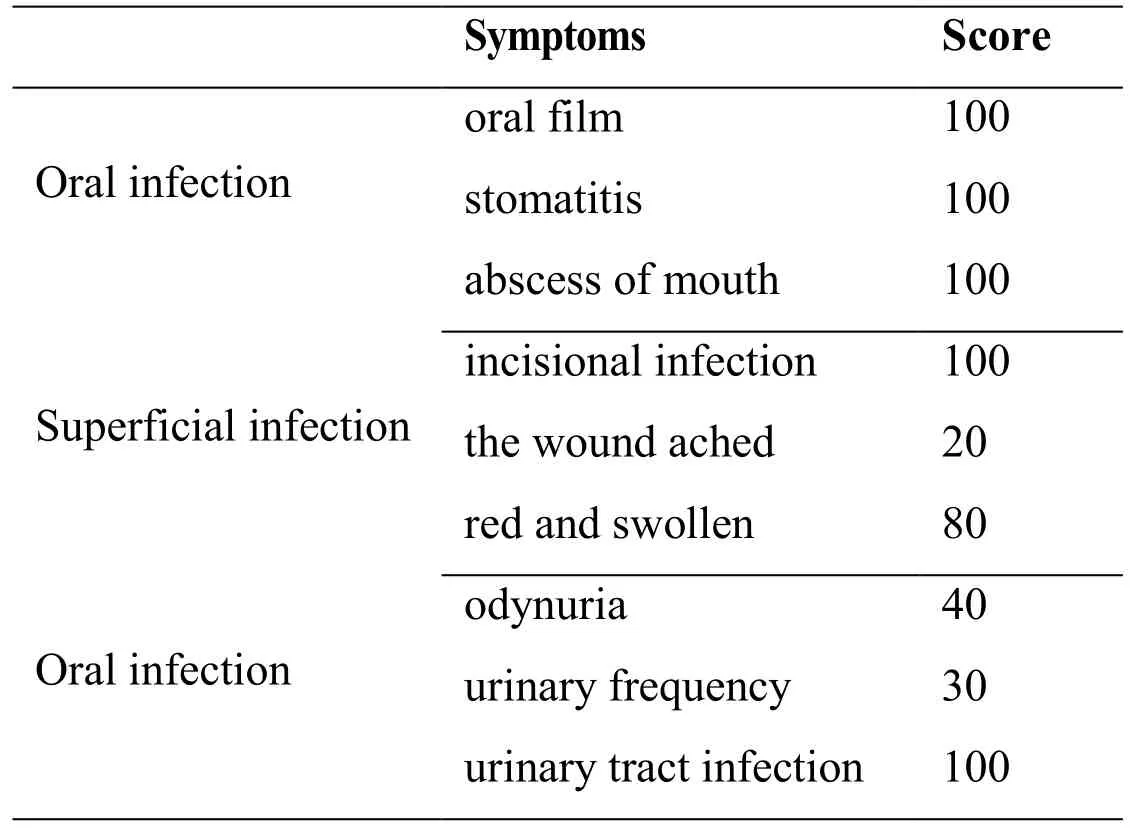
Table 3: Symptoms and scores selected by the medical experts
3.2 Feature selection
Through the analysis of Chinese electronic medical records, we find that these medical records have the following three characteristics.
· The characteristic words have low repetitions. Medical records do not emphasize semantic connotations by repeating the key words, so key symptoms and signs information do not appear many times.
· Electronic medical records of patients infected with similar diseases have high overlap degree of key symptom words. For example, the medical records of patients infected with urinary tract infection always contain dysuria, urinary frequency and urgency.
· The key symptom words between different diseases are exclusive. For example, the words such as wound infection and wound inflammation appear only in the medical records of patients infected with superficial infection.
According to these three characteristics, we calculate the representativeness of features for each disease and select the best subset of features.
The notations used in this method are first summarized to give a better understanding of the proposed method. A total ofNtypes diseases,X1,X2, …,XN, respectively.Riis the number of patients inXiandWiis the sum of occurrences of words in electronic medicalrecords ofXi. For a wordwinXi,wiis the occurrence number in medical records ofXi,andriis the number of patients infected withXicontaining the wordwin the medical records, then the representativeness ofwforXican be represented as:

whererepwis the representativeness of w forXi. For the first item log(Wi/wi), this item will increase whenwidecreases which means the repetition ofwis low. For the second item (ri/Ri), this item will increase asriincreases which means the number of patients withwin the medical records ofXiis high. As the part log(Rj/rj) in third item, this part will decrease asrjdecreases which means the number of patients with w in the medical records ofXjis low. These three items in the formula correspond exactly to the three characteristics of the distribution and composition of the symptoms in the electronic medical record. After getting the representativeness of each word inXi, we rank the representativeness and select topnwords to form the feature vector for patients inXi,wherenis a parameter. We use the same method to select the symptoms of other diseases.
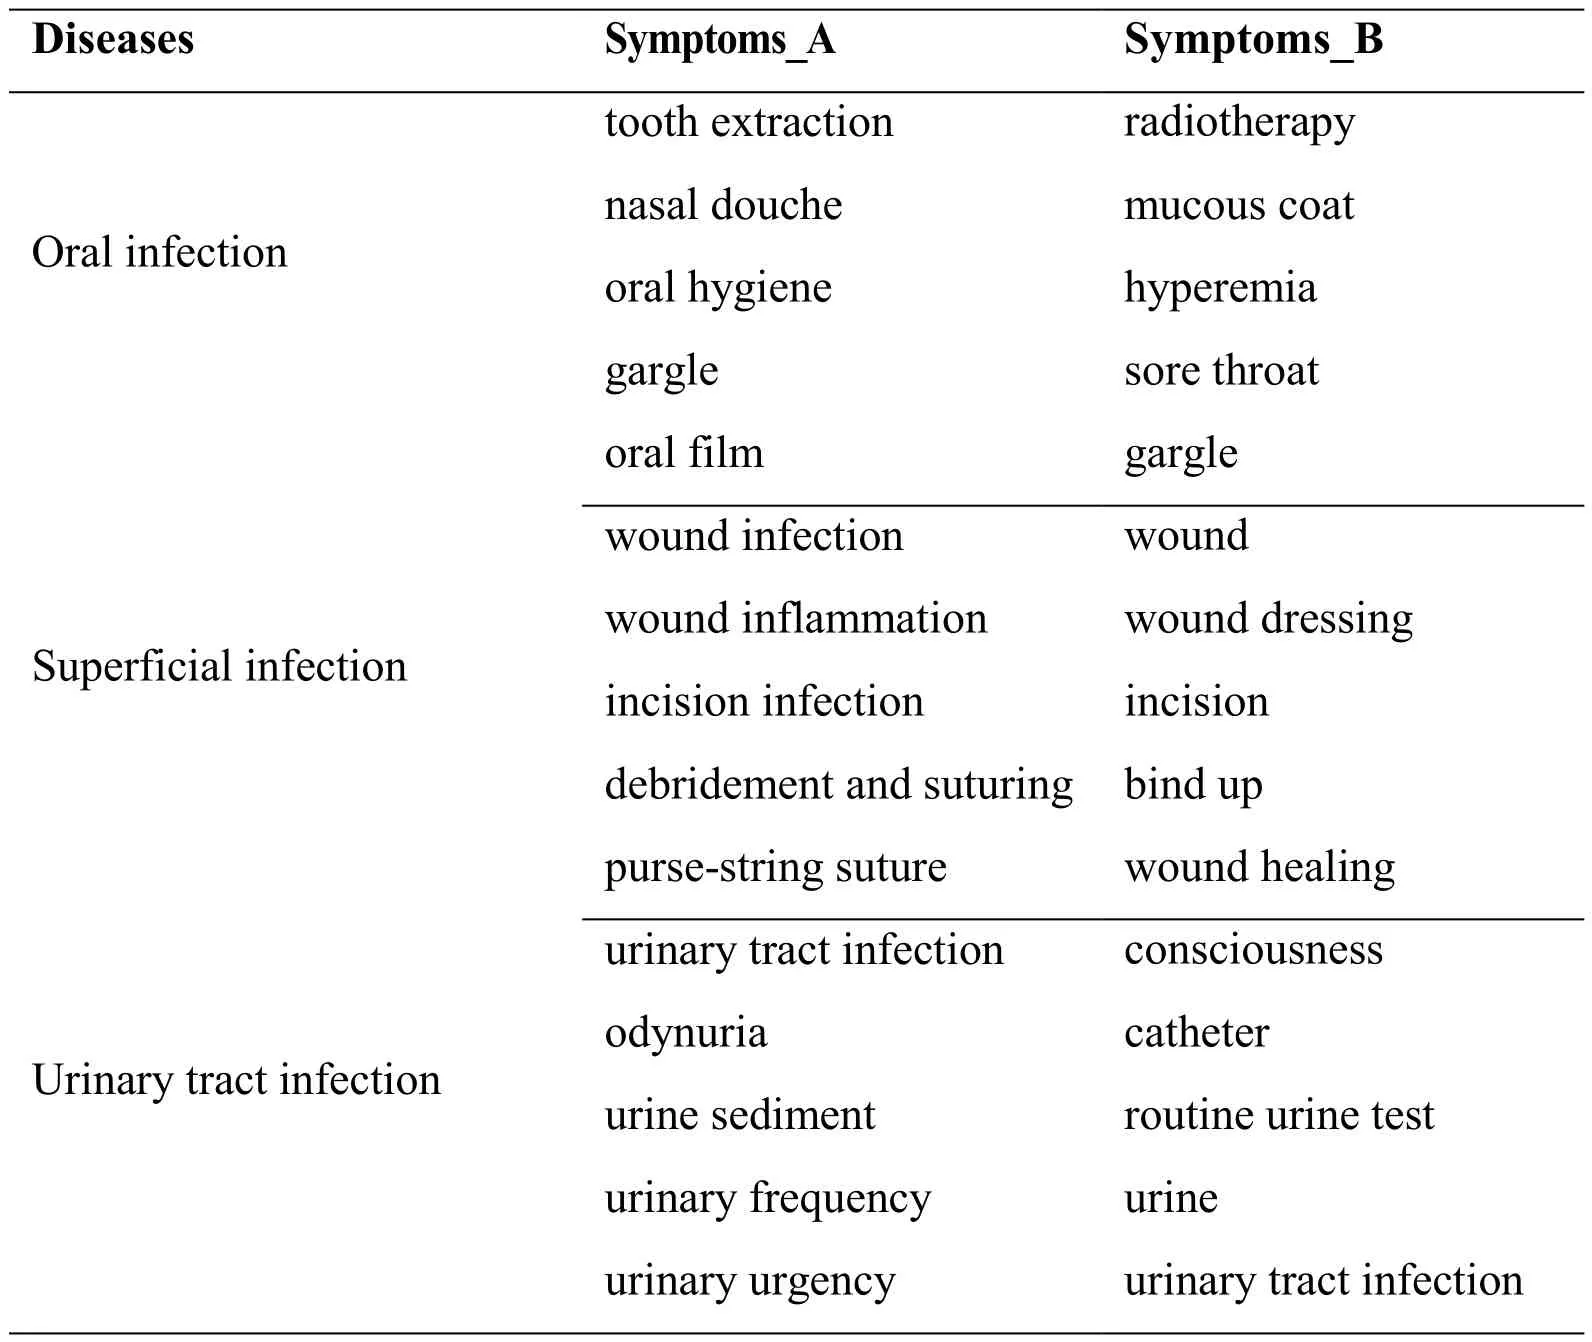
Table 4: Features selected by chi-square test and ours. Symptoms_A is selected by ours and Symptoms_B is selected by chi-square test
The representativeness of a feature calculated by the traditional feature selection methodis usually not used as the weight value of the feature. So after the feature selection, the weight value of each feature is calculated by the feature weighting method. The most commonly used feature weighting method is TF-IDF, where TF represents the term frequency and IDF represents the inverse document frequency. On the contrary, we directly use the representativeness calculated by the method proposed in this paper as the weight value of the features.
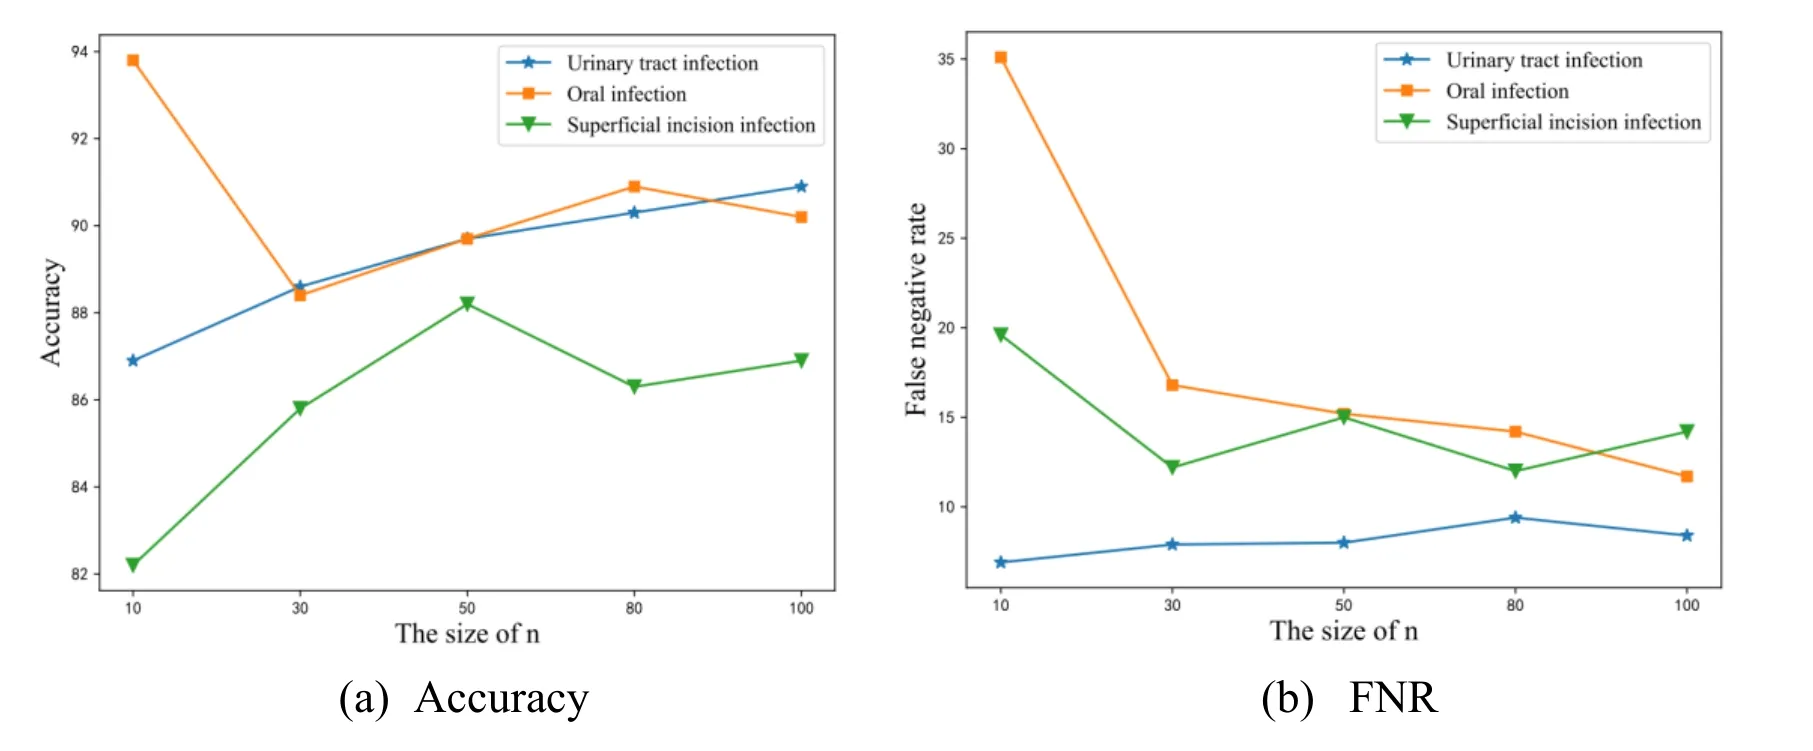
Figure 2: These results are obtained using the BR-SVM.nrepresents the dimension of the feature vector. Fig. 2a shows the accuracy of different value ofnand Fig. 2b shows the FNR of different value ofn
3.3 Classification model construction
3.3.1 Medical expert system
The medical expert system collects the medical knowledge and the experience of medical experts from the cooperative hospital to extract symptoms for different diseases and score each symptom to build a database of disease symptoms. Then, according to the database,a diagnosis tree is constructed for each disease. For diseaseXi, its diagnosis tree isTi. The leaf nodes in theTiare symptoms forXi, and each branch node includes a score threshold.We first calculate the sum of the scores of the corresponding symptoms of leaf nodes under a branch node, then compare the sum with the threshold of this branch node. If the sum less than the threshold, then the score of the branch node is the sum, otherwise it is the threshold. Detailed steps to diagnose a patient using this expert system are as follows:
· Use ‘。’, ‘ !’ and ‘?’ to cut each medical records into sentences, then use ‘,’ to cut each sentence into phrases. In the Chinese medical records, we think the words between two ‘,’ are the smallest unit of medical records.
· Delete phrases in which there are negative words belonging to the negative word list.If a phrase contains a negative word, the symptoms in the phrase should not be extracted.
· Extract the symptoms in the phrase and save these symptoms. We take out the symptoms in the database in turn and compare it with the content of the phrases.
·C reate the diagnosis trees belong to the patient. We create the diagnosis tree of diseaseXifor the patient based on the diagnosis treeTiand the extracted symptoms belonging toXi.
· Calculate the score of each disease according to the diagnosis trees for the patient,and compare the scores with a threshold. If the score of a disease is greater than the threshold, which means the patient is suffering from this disease. Note that if the sum of the score of the leaf nodes under a branch node is smaller than the threshold of this branch node, then the score of the branch node is the sum, otherwise it is the threshold. The threshold is set as 80 in this paper.
The expert system uses the knowledge and experience of medical experts to extract and score the symptoms of each disease, so the performance of the system is dependent on professional competence of the experts heavily. In order to reduce human intervention, this paper proposes a feature selection method based on the composition and distribution of symptoms in electronic medical records to extract symptoms for diseases automatically and combined with multi-label classification algorithm to construct a intelligent diagnosis system.
3.3.2 Intelligent diagnosis system based on multi-label classification
To determine whether the different diseases are related, we calculate the co-occurrence frequencies between diseases. Some notations are necessary to be explained before introducing the formula for calculating the co-occurrence frequency of two diseases. The class indicator matrix is represented asD= [d1, … , dm]T ∈ Rm*c.mis the number of training samples,cis number of diseases. di∈ {0,1}cis a c dimensional vector, if thei-th training sample belongs to thej-th disease,dijis 1, otherwisedijis 0, i ∈ {1, … , m} and j ∈ {1, … , c}. The co-occurrence frequency for diseaseXiandXjis:

wherefijis the co-occurrence frequency ofXiandXj.piisi-th column of D and D =[p1, … ,pc], sopiindicates the distribution of thei-th disease over the training data. We use cosine similarity to represent the relationships betweenXiandXj. The more correlated theXiandXjare, the higher the value offijis.
Zufferey et al. [Zufferey, Hofer, Hennebert et al. (2015)] compare different multi-label classification algorithm for chronic disease classification and point out BR-SVM, which divides the multi-label classification problem into many binary classification problems,has achieved the best performance in terms of accuracy measured by Hamming loss. In this paper, we adopt two methods, BR-SVM and multi-label (MLkNN). As for BR-SVM,we use SVM algorithm to train a classifier for each of the three diseases. For a training set which is not linearly separable in original sample space, the SVM algorithm can use the kernel function to map the original samples to a higher dimensional feature space, and pervasively utilized kernel functions include [Bao, Wang and Qiu (2014)]: Linear kernel function (Linear), radial basis kernel function (RBF), polynomial kernel function(Polynomial) and the sigmoid kernel function. In this paper, we use basis kernel function according to the number of selected features and the number of samples. When training aclassifier for a certain disease, patients infected with this disease are treated as positive samples and other patients are treated as negative samples, and the features used to train the classifier is the symptoms of this disease. Because the quantities of patients in each disease are close, this method will lead to the problem of imbalanced data. As oversampling and under-sampling can solve this problem, we adopt these two strategies and compare the performance of them.
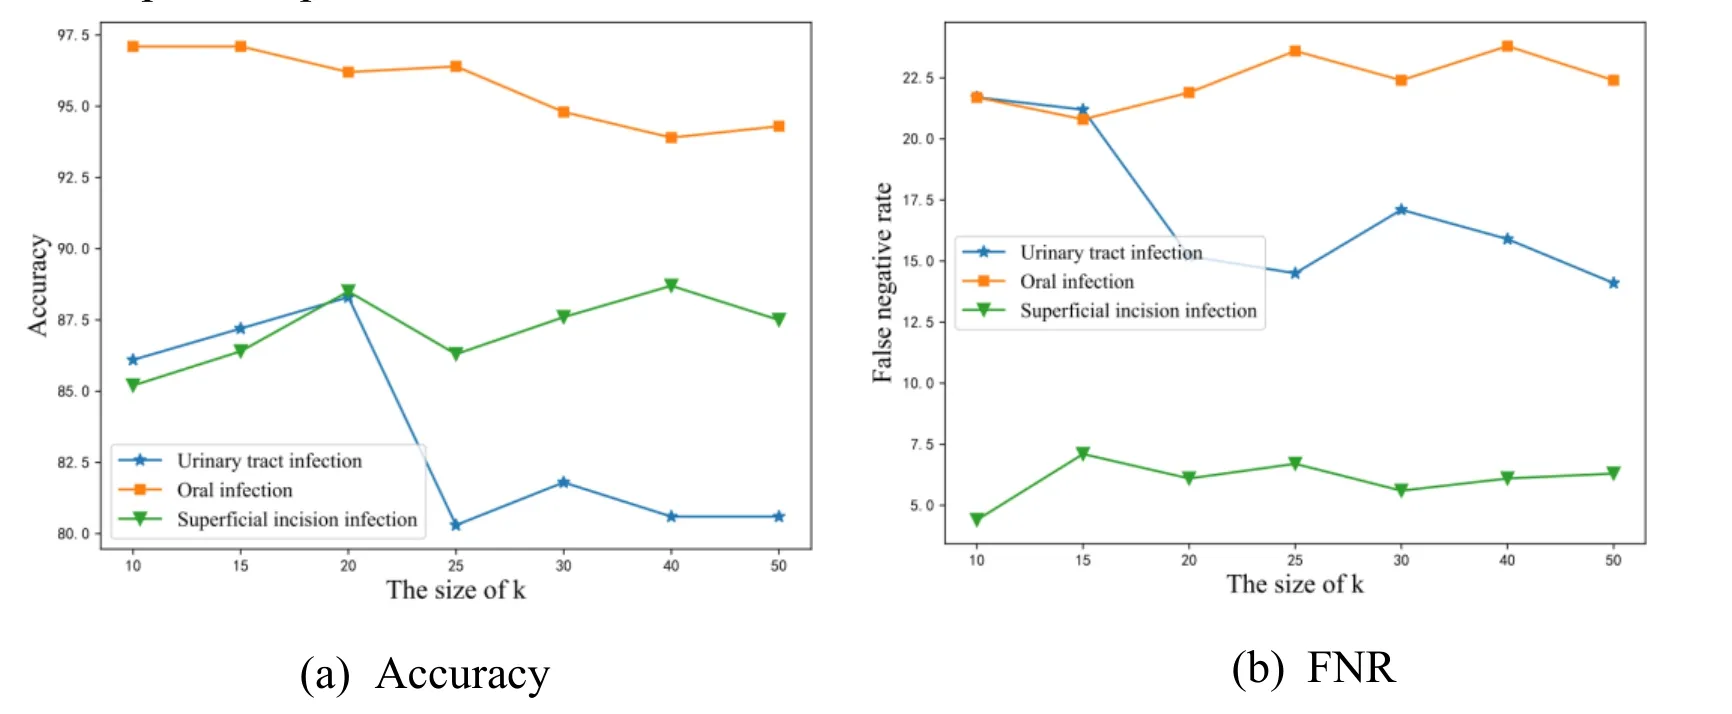
Figure 3: These results are obtained using the MLkNN.krepresents the number of nearest neighbors of samples. Fig. 3a shows the accuracy of different value ofkand Fig.b shows the FNR of different value ofk
Zhang et al. [Zhang and Zhou (2007)], they propose a multi-label lazy learning approach named MLkNN. For an unseen instance, itsknearest neighbors in the training set are firstly identified, after that, based on statistical information gained from the label sets of these neighboring instances, i.e. the number of neighboring instances belonging to each possible class, maximum a posteriori (MAP) principle is utilized to determine the label set for the unseen instance. The most important step of the framework is to find theknearest neighbors of each instance in the training set. We use a similar pipeline in Zhang et al. [Zhang and Zhou (2007)] to diagnose each patient in testing set. For patientP, in order to calculate the distance betweenPand other patients in training set, we take a patientPiout from the training set and convert the medical records ofPandPiinto two n-dimensional vectors according to the symptoms corresponding to the disease Pi infected, and then calculate the cosine distance of the two vectors. After getting the cosine distance of patients in the training set and patientP, we can select the k nearest neighbors ofP.
The training process of the intelligent diagnosis system is as follows:
· Get the training data. We obtain the patients’ Chinese electronic medical records from the cooperative hospital and each patient suffers from only one disease.
· Initialize the word segmentation tool Ansj. Ansj is a commercial off-the-shelf tool and it is open source. We use this tool to import the custom dictionary and the stop word list.
· Use Ansj to convert medical records into a list of discrete words. First, we delete thephrases containing negative words. We next utilize Ansj to segment the remaining phrases.
· Select features from the words. We use chi-square test method and the feature selection method proposed in this paper to select symptoms for different diseases.
· Construct the classification model. We use SVM and MLkNN to construct the intelligent diagnosis system.
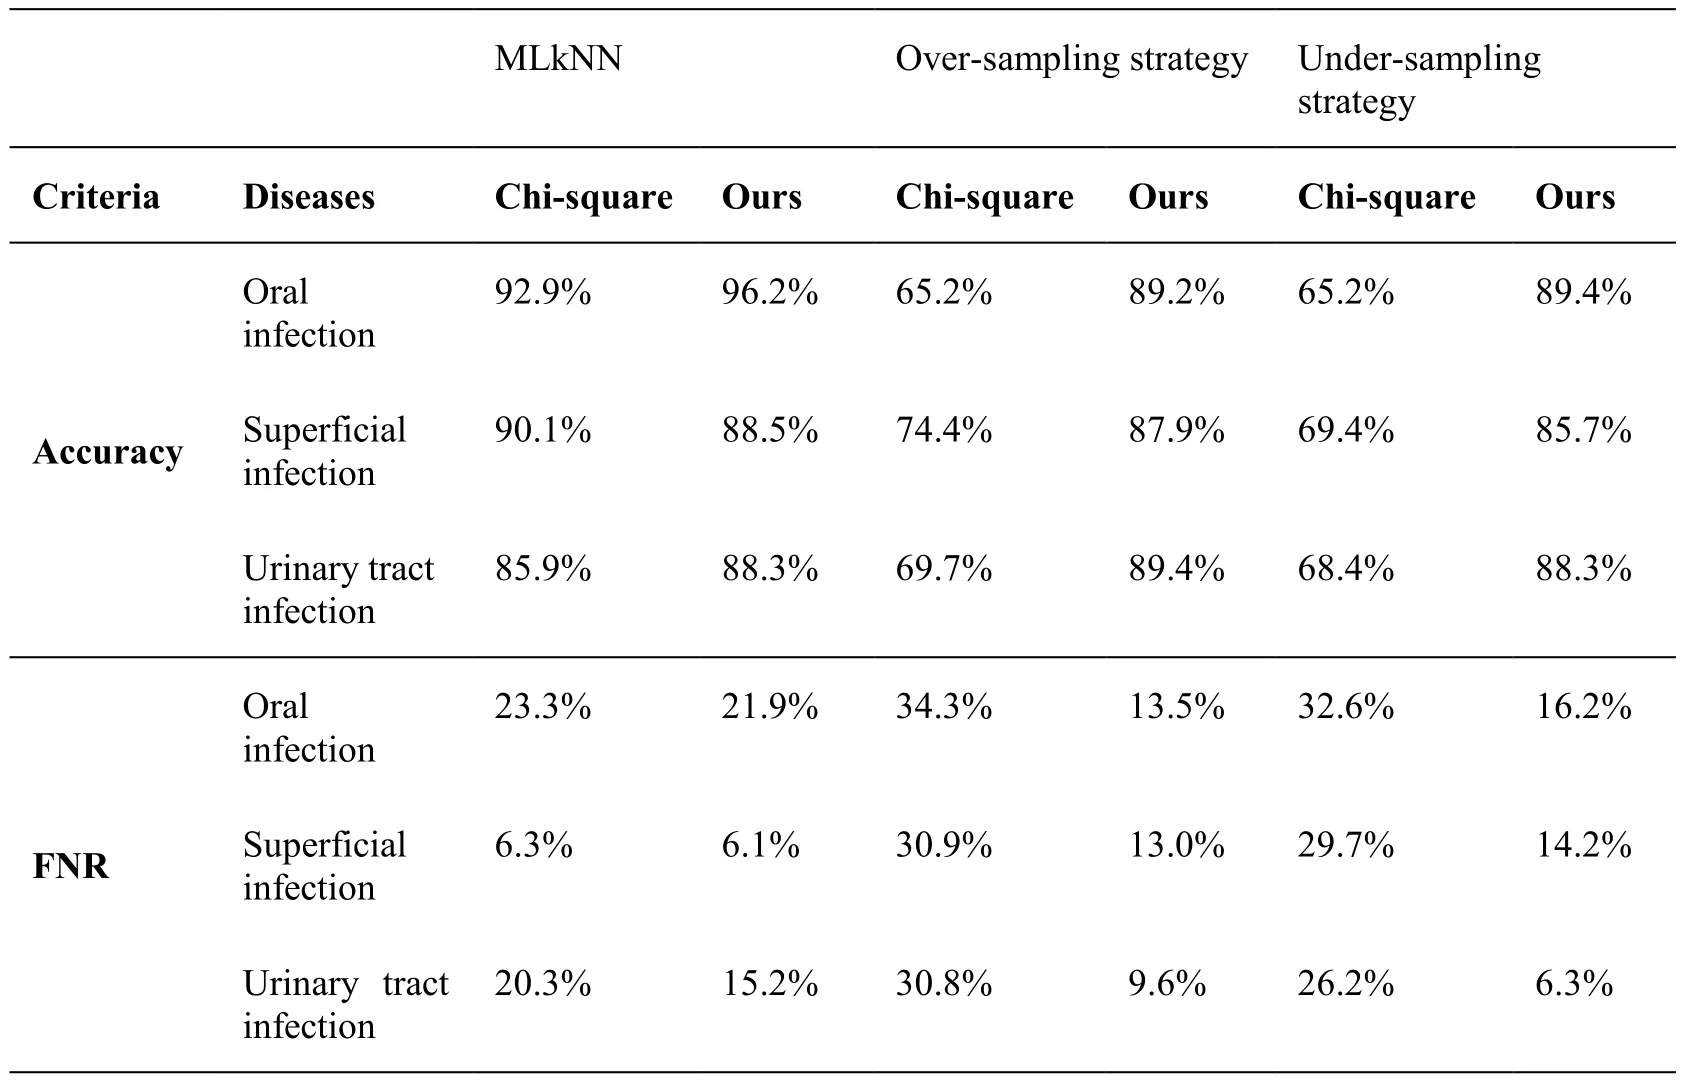
Table 5: Performance comparison between our method and chi-square using MLkNN,over-sampling strategy and under-sampling strategy. Accuracy and FNR rate are used as metric
4 Experiments
There are already many public English electronic medical record datasets, but only Chinese electronic medical records are considered in this paper. We collect 398310 Chinese electronic medical records from 9602 patients from the cooperative hospital and divide these records into 27 types. We exclude 5 types according to the hospital standards and doctors’ experience. The remaining types include admission records, chief physician rounds, first course records, ward-round records, surgery records, discharge records and so on.
Because the size of the dataset has a great effect on the classification result [Guo, Liu,Cai et al. (2018)], diseases with patient number less than 500 are ruled out. After disease filtering, we obtain three types of diseases. To train and test the multi-label classification algorithms, we split the patients in each type of disease into two parts, training set and testing set and the size of training set for each disease is close. Tab. 1 shows the data
specifications. Note that a patient may suffer from multiple diseases at the same time, but the patients in the training set suffer from only one disease.
We use the co-occurrence frequencies to evaluate the correlation between the diseases in this paper. Tab. 2 shows the co-occurrence frequencies of the 3 diseases in Tab. 1. In Tab.2, the co-occurrence frequency of any two diseases of the three diseases is very low, so we do not consider the correlation between the diseases when constructing the intelligent diagnosis system.
4.1 Evaluation criteria
To evaluate the performance, we adopt two criteria that are widely used in disease diagnosis: accuracy and FNR. For the diseaseXi, the number of patients with this disease in the classification result ishi, of which the number of patients predicted correctly ismi.
· Accuracy: The accuracy forXirefers to the ratio of mi to hi. From the definition, we can see that the larger the value of the accuracy is, the better the performance will be.
· FNR: The FNR forXirefers to the ratio of (Ri–mi) toRi. From the definition, we can see that the smaller the FNR is, the better the performance will be.
4.2 Evaluation results
Tab. 3 lists some symptoms and scores of the 3 diseases selected by the medical experts from the cooperative hospital. Tab. 4 lists the top 5 most representative features for each disease selected by the chi-square test and the feature selection method proposed in this paper.
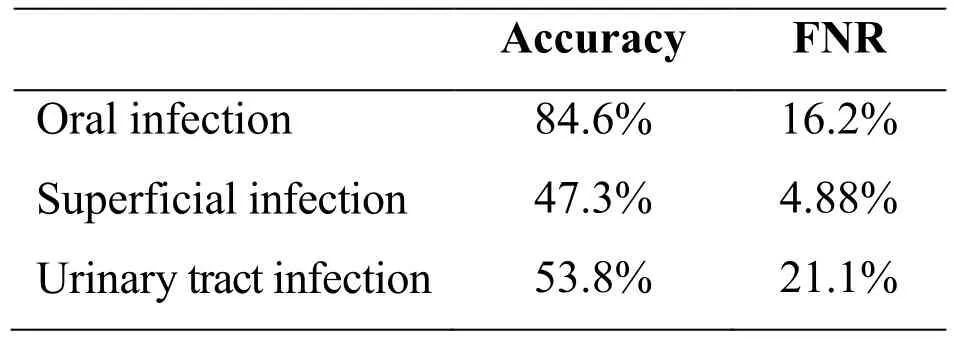
Table 6: Performance of the expert system
Since there are two parameters,nandk, in our framework, we conduct two experiments to investigate performance variations with respect to different size ofnandk.Performance variations with different size ofnare depicted in Fig. 2.nvaries in a range of {10, 30, 50, 80, 100}. Note that the bigger the accuracy value is and the smaller the FNR is, the better performance is. From the Fig. 2, we can observe that the best performance result is achieved whenn= 50. As a result, we fixn= 50 in the rest of experiments. Performance variations with different size ofkare depicted in Fig. 3.kvaries in a range of {10, 15, 20, 25, 30, 40, 50}. From the Fig. 3, we can observe that the best performance result is identified whenk= 20. As a result, we fixk= 20 in the rest of experiments. To consider the effectiveness of the feature selection method proposed in this paper, we compare it with the chi-square test method and report the results of the two types of features in Tab. 5. The representativeness of features calculated by the chisquare test is not used as the weight value of the features so we use the TF-IDF method to calculate the weight of the words selected by the chi-square test. From the table, we makethe following observations: For the MLkNN, the accuracy and FNR of chi-square and our method are similar. But irrespective of the type of strategies used for SVM, our proposed method performs better than chi-square test. The accuracies of the three diseases are all close to 90% and FNR are all less than 20% obtained by our method. To verify the performance of the multi-label classification algorithm applied to the medical field, we compare it with the expert system. From the Tab. 5 and Tab. 6, we can observe that the intelligent diagnosis system based on multi-label classification performs much better than the expert system. The FNR of the expert system is close to the intelligent diagnosis system, but the accuracy is much worse.
5 Conclusion
The aim of this paper is to select the most representative features of different diseases,and then use these features to train classifiers to diagnose patients automatically. We obtain electronic medical records from the cooperative hospitals. The Chinese names of medicines are crawled from the official website of the State Food and Drug Administration and the Chinese names of diseases are extracted from ICD-10 disease code to build a dictionary. To solve the problem of data imbalance problem, we adopt the over-sampling and under-sampling strategies. With the goal of achieving acceptable accuracy and FNR for each disease, we propose a feature selection method based on intra class distribution and inter class distribution of symptoms. To verify the performance of the text classification algorithm applied to the medical field, we construct an expert system. Extensive experiments demonstrate that the proposed method selects feature of diseases more effectively than the traditional feature selection method and the performance of the intelligent diagnosis system based on multi-label classification performs much better than the expert system.
In future work, we would like to get the medical records of more types of diseases and consider the relationships between diseases when designing the feature selection method.
Acknowledgement:The authors would like to acknowledge the financial support from the National Natural Science Foundation of China (No. 61379145) and the Joint Funds of CETC (Grant No. 20166141B08020101).
杂志排行
Computers Materials&Continua的其它文章
- Biodegradation of Medicinal Plants Waste in an Anaerobic Digestion Reactor for Biogas Production
- Molecular Structure and Electronic Spectra of CoS under the Radiation Fields
- A Spark Scheduling Strategy for Heterogeneous Cluster
- Rare Bird Sparse Recognition via Part-Based Gist Feature Fusion and Regularized Intraclass Dictionary Learning
- Event-Based Anomaly Detection for Non-Public Industrial Communication Protocols in SDN-Based Control Systems
- Inverted XML Access Control Model Based on Ontology Semantic Dependency
