Observations of near-inertial waves induced by parametric subharmonic instability*
2018-07-11LIBingtian李秉天CAOAnzhou曹安州Xianqing吕咸青
LI Bingtian (李秉天) CAO Anzhou (曹安州) LÜ Xianqing (吕咸青)
1Physical Oceanography Laboratory/CIMST,Ocean University of China and Qingdao National Laboratory for Marine Science and Technology,Qingdao 266200,China
2Ocean College,Zhejiang University,Ministry of Education,Zhoushan 316021,China
AbstractNear-inertial waves (NIWs), which can be generated by wind or the parametric subharmonic instability (PSI) ofinternal tides, are common in the South China Sea (SCS). Moored current observations from the northern SCS have revealed that the PSI of semidiurnal (D2) internal tides is another source of NIWs. The objective of this study was to examine the energy variance in the PSI of D2tides. The PSI of D2internal tides generated NIWs and waves with frequencies around the difference frequency of D2and f. The observed NIWs induced by PSI could be distinguished clearly from those elicited by typhoon Krosa. Shortly after Krosa entered the SCS, NIWs began to intensify on the surface and they propagated downward over subsequent days. The near-inertial currents were damped quickly and they became relatively weak before the waves were reinforced beneath the mixed layer when wind stress was relatively weak. Rotation spectra indicated an energy peak at exactly the difference frequency D2-f of the NIWs and D2, indicating nonlinear wave-wave interaction among D2, f, and D2-f. Depth-time maps of band-pass fi ltered velocities of D2-f showed the waves amplified when the NIWs were reinforced, and they intensified at depths with strong D2tides. The energies of the NIWs and D2-f had high correlation with the D2tides. The PSI transferred energy of low-mode D2internal tides to high-mode NIWs and D2- f waves. For the entire observational period, PSI reinforcement was observed only when mesoscale eddies emerged and when D2was in spring tide, revealing a close connection between mesoscale eddies and NIWs. Mesoscale eddies could increase the energy in the f-band by enhancing the PSI of D2internal tides. Thus, this represents another mechanism linking the energy of mesoscale eddies to that of NIWs.
Keyword:near inertial waves (NIWs); parametric subharmonic instability (PSI); South China Sea (SCS)
1 INTRODUCTION
Near-inertial waves (NIWs), which are a type ofinternal wave, have frequencies near the inertial frequency f, and they have been observed in stratified waters for many decades (Webster, 1968; Firing et al.,1997; Alford et al., 2013). Internal tides are another type ofinternal wave but with tidal frequencies. These are commonly considered to be generated in a stratified ocean via interaction between barotropic tidal currents and rough topography, e.g., continental shelf slopes, ridges, and sea mounts (Jan et al., 2008;Farmer et al., 2009). Internal tides and NIWs are considered two important phenomena that drive diapycnal mixing within oceans (Tian et al., 2009).
Nonlinear interactions among internal waves can effectively transfer energy to motions with different wavenumbers and frequencies (McComas and Muller, 1981; Guan et al., 2014). Parametric subharmonic instability (PSI) is a type of wave-wave nonlinear interaction that transfers energy of one low-mode internal wave to two high-mode waves with opposite wave numbers (Alford et al., 2007; Xie et al., 2008, 2011). The frequencies of two subharmonic ( ω1and ω2) waves are usually close to half the forcing frequency ( ω0). Many observations(~29°) have confi rmed that semidiurnal (D2) internal tides can transfer energy via PSI to NIWs with frequencies of two subharmonic waves (D2/2) close to the local inertial frequency (Hibiya et al., 2002;Haren, 2005; Alford, 2008; Xie et al., 2008, 2009).Furthermore, they can generate subharmonic waves with frequencies different to half the forcing frequency, when the PSI turns weak nonlinear instability into strong nonlinear instability (Korobov and Lamb, 2008). Korobov and Lamb (2008) found PSI involving ω0, 0.57 ω0, and 0.43 ω0by numerical simulation. Bourget et al. (2013) observed subharmonic waves with frequencies of 0.67 ω0and 0.33 ω0in their laboratory experiments. They suggested the frequencies of subharmonic waves depend on the frequency, wavenumber, and Reynolds number of the forcing wave. Observations in the northern South China Sea (SCS) have suggested that the PSI of D2internal tides generates NIWs as well as internal waves with frequencies around D2- f, in which the two subharmonic waves are not equal to half the forcing frequency (Xie et al., 2011). Another important source of NIWs that is observed more frequently is wind, e.g., hurricanes/typhoons. Wind forcing, containing strong inertial rotating components, applied at the sea surface can resonantly excite NIWs in the upper-ocean mixed layer (Price et al., 1981; Shay et al., 1990; Firing et al., 1997; Guan et al., 2014). Wind-induced NIWs can be either low mode or high mode vertically and they often are blue-shifted to the local inertial frequency (Garrett,2001). In comparison, the PSI of D2internal tides can only excite high-mode NIWs, which are red-shifted(McComas and Bretherton, 2004).
Mesoscale eddies, which are observed commonly in the northern SCS, play essential roles both in transporting oceanic materials and in modulating oceanic circulations (Zhang et al., 2013, 2016, 2017).An anticyclonic eddy (AE) reinforces vertical propagation of NIWs by lowering the effective inertial frequency, which traps propagating waves (Kunze,1985; Halle and Pinkel, 2003; Zhai et al., 2005).Numerical modeling studies have revealed the existence of energy cascades from low-frequency flows, including mesoscale eddies, to smaller scale motions, such as NIWs in the ocean (Arbic et al.,2013; Wright et al., 2013). Recent observational evidence has also suggested that, in addition to modulating NIW propagation, mesoscale eddies can also transfer energy to NIWs and further enhance turbulent mixing (Liang and Thurnherr, 2012).
To investigate the three-dimensional structure,generation, and dissipation of mesoscale eddies in the SCS, and their interactions with different types ofinternal wave, the SCS Mesoscale Eddy Experiment(S-MEE) was designed and conducted successfully in the northern SCS between October 2013 and June 2014 (Zhang et al., 2016, 2017; Huang et al., 2017).The remainder of this paper is organized as follows.Section 2 describes the data, typhoon, and mesoscale eddies. Section 3 presents the observations of typhoon-induced NIWs and waves generated through PSI. In Section 4, we discuss the mechanism that links mesoscale eddies to NIWs. Section 5 provides the summary and conclusions.
2 MOORED DATA, TYPHOON, AND MESOSCALE EDDIES
2.1 Moored data
During the S-MEE experiment, an array of 10 subsurface moorings was deployed in the region west of the Luzon Strait (Zhang et al., 2016). These moorings formed part of the SCS Mooring Array constructed by the Ocean University of China. The upper-layer (above 370 m) current velocity data,collected by mooring M1 at the westernmost end of the array (21.1°N, 117.9°E), were used in this study.The water depth at the mooring location is 960 m. The current velocity was measured by an upward-looking 75 kHz Acoustic Doppler Current Profi ler (ADCP)with vertical resolution and temporal interval of 16 m and 3 min, respectively. The hourly averaged data between 19 October 2013 and 27 February 2014 was analyzed in this study.
2.2 Typhoon Krosa
Typhoon Krosa developed as a tropical depression in the northwestern Pacific on 28 October 2013 and it intensified as it travelled northwestward. On 1 November, Krosa crossed the Philippines into the SCS with maximum wind speed of 38 m/s. After entering the SCS, Krosa intensified further, reaching peak intensity with maximum wind speed of 45 m/s on 2 November. Then, its intensity decreased and its path turned southwestward. Eventually, on 4 November, Krosa dissipated over the SCS. The track of Krosa, shown in Fig.1a, is based on the report of the China Typhoon Center (http://www. typhoon.gov.cn). Krosa lingered in the SCS for 4 days and the center passed the study area at 20:00 on 1 November 2013 (GMT: +08:00), i.e., with minimum distance of 220 km from the mooring.

Fig.1 Track (dots) of typhoon Krosa and the location of mooring M1 (triangle) in the SCS (a); spatial distributions of SLA and geostrophic currents at 3-day intervals during 14-29 November 2013 (b)
2.3 Mesoscale eddies
To detect mesoscale eddies, we used the gridded daily near-real-time sea level anomaly (SLA) and absolute surface geostrophic velocity data obtained from the Archiving, Validation, and Interpretation of Satellite Oceanographic data website (http://www.aviso.oceanobs.com/). The spatial resolutions of the SLA and geostrophic velocity data are both 1/4°.Based on satellite altimeter data, an AE was detected.The spatial distributions of the SLA and the geostrophic currents during 14-29 November 2013 within the mooring region are shown in Fig.1b.
3 RESULT
3.1 Near-inertial waves (NIWs)
The current velocities of the NIWs ([0.80, 1.15]f)were extracted using a fourth-order Butterworth fi lter applied in the temporal domain. The velocities of the NIWs increased significantly at the mooring location both during and after the passage of typhoon Krosa. It was notable that the enhancement of the NIWs lasted for nearly a month, much longer than observed at other times in the SCS (Guan et al., 2014; Yang et al.,2015). The near-inertial currents had an upward propagating phase, indicating downward propagation of group velocity and energy. The near-inertial kinetic energy (KE) was calculated according to

whereuandvare the eastward and northward nearinertial velocities, respectively, and ρ is the density of seawater (taken as 1 024 kg/m3in this study). On 2 November 2013, shortly after Krosa entered the SCS,NIWs began to intensify at the near surface. As the NIWs propagated downward, the energy intensity increased at depths of 110-160 m. Then, the current velocity began to decrease before 14 November. The NIWs, which had become rather weak by 14 November, decayed quickly. After 14 November, the NIWs became enhanced for a second time at depths of 150-320 m. It should be noted that only Krosa and no other typhoons passed by the mooring during the entire observed duration. Considering that wind injects energy into the ocean at the surface, windinduced NIWs should be surface-intensified; however,the maximum energy of the observed reinforced nearinertial currents was at the depths of 150-320 m.
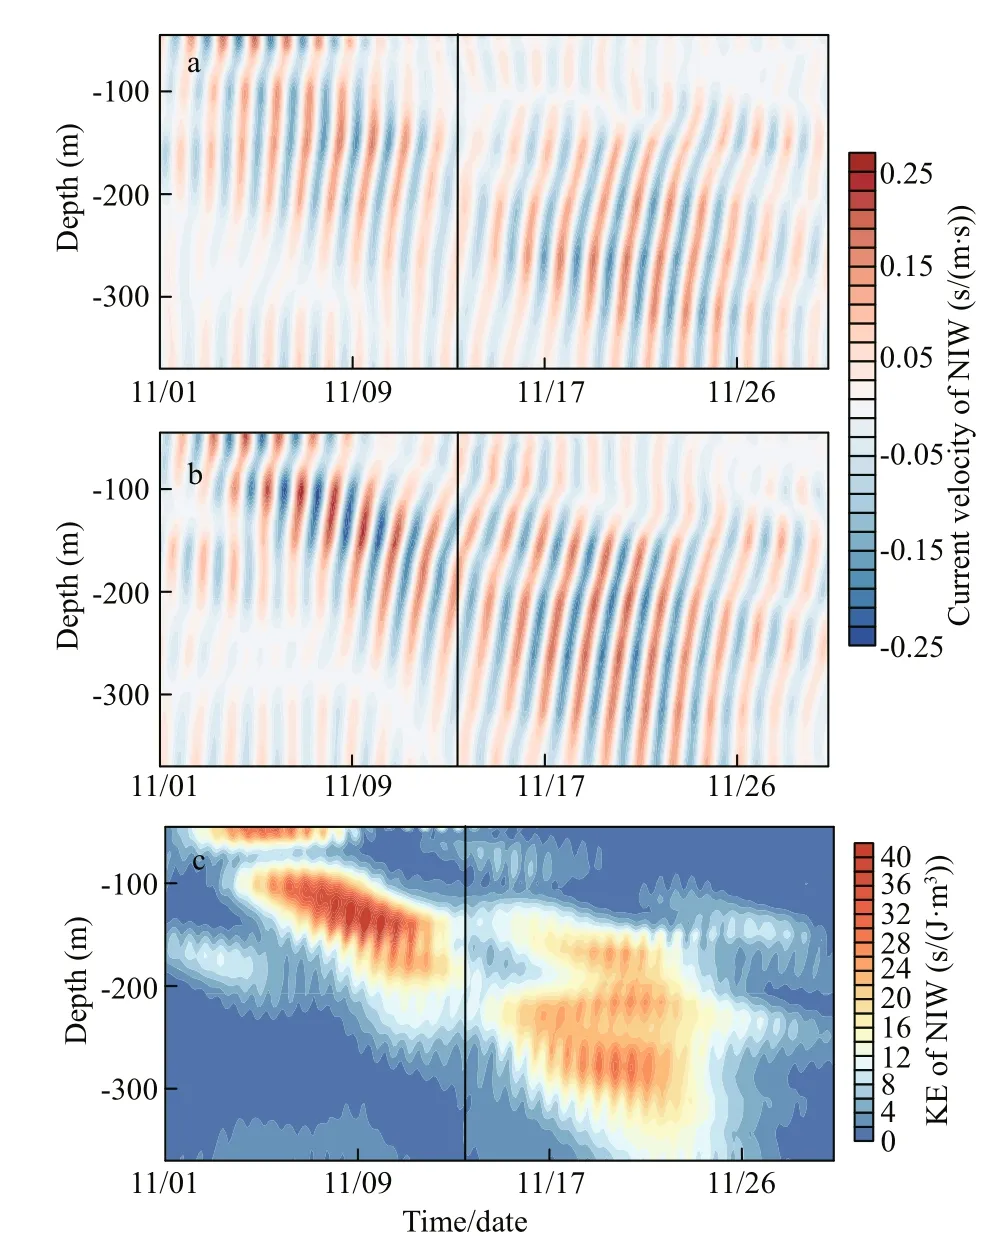
Fig.2 Depth-time maps of (a) eastward and (b) northward near-inertial velocities and (c) near-inertial KEThe black line indicates the date of 14 November 2013.
Rotation spectra of the current velocity at the depth of 100 m, where strong NIWs were observed before 14 November 2013, are shown in Fig.3a. The spectra show significant peaks in the inertial, diurnal (D1),and D2bands. The D1and D2tides were comparable;however, the NIWs were weaker than the tidal motions. The central frequency of the f band was redshifted to (0.96±0.01) f relative to the local inertial frequency. Hereafter, f1and f2denote the inertial frequencies at depths of 100 and 300 m, respectively.The NIWs mainly show a clockwise feature, indicating downward energy propagation, which is consistent with the phase of the near-inertial velocities shown in Fig.2a and 2b. The tidal motions (D1and D2) were both clockwise and anticlockwise, but the clockwise spectrum dominated the anticlockwise one. The rotation spectra of the current velocity at the depth of 300 m were also calculated. At this depth, where strong NIWs were observed mainly after 14 November, the power of the NIWs overwhelmed that of the tides. The peak frequency in the f bands (f2) was(0.93±0.01) f, which was red-shifted more obviously than f1. The NIWs were mainly clockwise, indicating downward energy propagation. At the depth of 300 m,a new spectral peak at the difference interaction frequency (D2- f2) between D2and f2appeared that dominated the anticlockwise spectrum. The D2-f2internal waves propagated upward, in the opposite direction to the NIWs. However, at the depth of 100 m, the D2- f1peak was much smaller. Considering there was no external forcing at the D2-f frequency,this result suggests that a triad nonlinear wave-wave interaction might occur among the NIWs, D2internal tides, and D2-f waves. Earlier observations have suggested that in the SCS, the PSI of D2internal tides could generate NIWs accompanied by internal waves of frequencies around D2-f (Xie et al., 2011).Therefore, the strong NIWs observed after 14 November were probably connected with the PSI of D2internal tides.
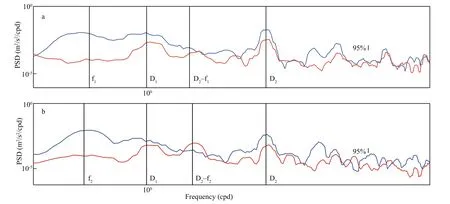
Fig.3 Rotation spectra for clockwise (blue) and anticlockwise (red) components of raw velocity a. 100-m depth; b. 300-m depth.

Fig.4 Kinetic spectra of depth-averaged vertical shear of u at 300 m (5-m shear) (a); vertical profi les of top two EOF modes:period I (b) and period II (c)
Figure 4a shows the spectra of the 5-m vertical shear ofuat 300-m depth. The sheared velocity spectra of thevcomponent were similar to those of the u component and they are not shown. The strongest peak appeared in the f bands, although peaks of D1and D2-f were also obvious. Although D2had strong signals in the rotation spectra, it was rather weak in vertical shear, indicating that D2energy was dominated by low mode.
The empirical orthogonal function (EOF)decomposition method was applied to the velocity of the NIWs for the periods 1-13 November (period I)and 14-30 November (period II). The results corresponding to the eastward velocity of the NIWs are shown in Fig.4b and 4c. The results of thevcomponent were similar and they are not shown.During period I, the vertical structures of the top two EOF modes corresponded to the second and third baroclinic vertical normal modes with variance contributions of 43% and 26%, respectively. During period II, the top two EOF modes were the third and fourth baroclinic vertical modes that contributed 49%and 42% of the variance, respectively. The NIWs during period II had higher modes than those related to Krosa. The NIWs generated by the PSI mechanism could only be high mode, whereas wind-induced NIWs were either low mode or high mode. This indicates that the NIWs observed during period II probably originated from the PSI of D2internal tides.
3.2 D2-f waves
Depth-time plots of band-pass fi ltered ([0.96,1.13]) D2-f velocities are shown in Fig.5a and 5b. The D2- f currents increased greatly between the depths of 130 and 320 m during 14-23 November, which agrees well with characteristics of the NIWs during the same period. The D2-f phase velocities propagated downward, indicating upward energy propagation,consistent with the rotation spectra analysis. It agrees well with PSI theory that two subharmonic waves have opposite vertical wavenumbers. Figure 5c shows the KE of the D2-finternal wave. Similar to the NIWs,the reinforcement of the D2-f waves occurred at the depths of 130-320 m after 14 November, simultaneously. It is remarkable that the D2-f KE increased greatly at the depths around 145, 205, 250, and 310 m,where the corresponding intensities of ([0.9, 1.1]) D2internal tides were evident. The results of thevcomponent were similar and they are not shown. The results suggest that the energies of the D2-finternal waves and the NIWs were provided by the D2internal tides. The energy was transferred from low-mode D2internal tides to high-mode NIWs and D2-finternal waves.

Fig.5 Depth-time maps of eastward (a) and northward (b)D2-f velocities, and D2-f KE (c) and eastward (d) D2velocity
It is notable that the D2- f waves had already occurred during 1-13 November and that the velocities were enhanced when Krosa affected the mooring. The D2-f currents intensified immediately in the upper 100 m after the passage of Krosa, consistent with the development of NIWs. Enhancement of D2-f occurred at depths below 100 m as the NIWs propagated with depth. This suggests that the D2-f waves were strongly correlated with typhoon activity.However, wind forcing at the sea surface can only resonantly excite NIWs in the mixed layer; thus, it would not induce D2-finternal waves beneath the mixed layer. The origin of the D2- f waves was the PSI of the D2internal tides. In addition, it is obvious that the D2velocity was strong during that period.Therefore, the intensity of D2tides might relate to the extent of the enhancement of the nonlinear wavewave interaction, resulting in reinforcement of the D2-f waves.
4 DISCUSSION
As shown in Sections 3.1 and 3.2, the enhancement of the energy of the NIWs was related not only to the passage of Krosa but also to the PSI of the D2internal tides. The energy of the intensified NIWs, during 14-30 November 2013, came from the waves of D2frequency. Figure 6a and 6b shows the wavelet power spectra of the eastward and northward velocities at the depth of 300 m, respectively. In the entire period of observation, from 19 October 2013 to 27 February 2014, we noticed that amplifi cation of NIWs was evident in the periods 15-27 November 2013 and 2-23 February 2014 at the depth of 300 m. Each enhancement was accompanied by an impulse of D2-f energy, especially in the northward direction. The energies of both the NIWs and the D2-finternal waves enhanced several times for short periods during the remainder of the observational period, indicating the occurrence of PSI of the D2tides throughout the entire period.
Using numerical simulations, Gayen and Sarkar(2013) investigated the interactions ofinternal tide beams with an upper-ocean pycnocline. Their study suggested that interaction of the D2internal tides with an upper-ocean pycnocline enhanced PSI and weakened the beams of D2internal tides. The frequency of the subharmonic waves was associated with the ratio of the forcing wave frequency to the buoyancy frequency and the Reynolds number. They found that when the background buoyancy frequency was set to N1=2.8152×10⁻⁴rad/s, the frequencies of the two subharmonic waves were 0.7 M2and 0.3 M2,respectively. Furthermore, when the background buoyancy frequency was set to N2=1.155×10⁻³rad/s,the frequencies of the two subharmonic waves were 0.5 M2. The generation of subharmonics with unequal frequencies via PSI was related to the reduction of stratifi cation. Satellite altimeter data revealed an AE from 14-30 November within the mooring region.Zhang et al. (2013) found that the AE could increase the mixed-layer depth and thus, decrease the stratifi cation of the upper layer. This could have caused or enhanced the PSI of the D2tides and thus,generated the NIWs (0.43 M2) and D2- f waves (0.57 M2) in period II.
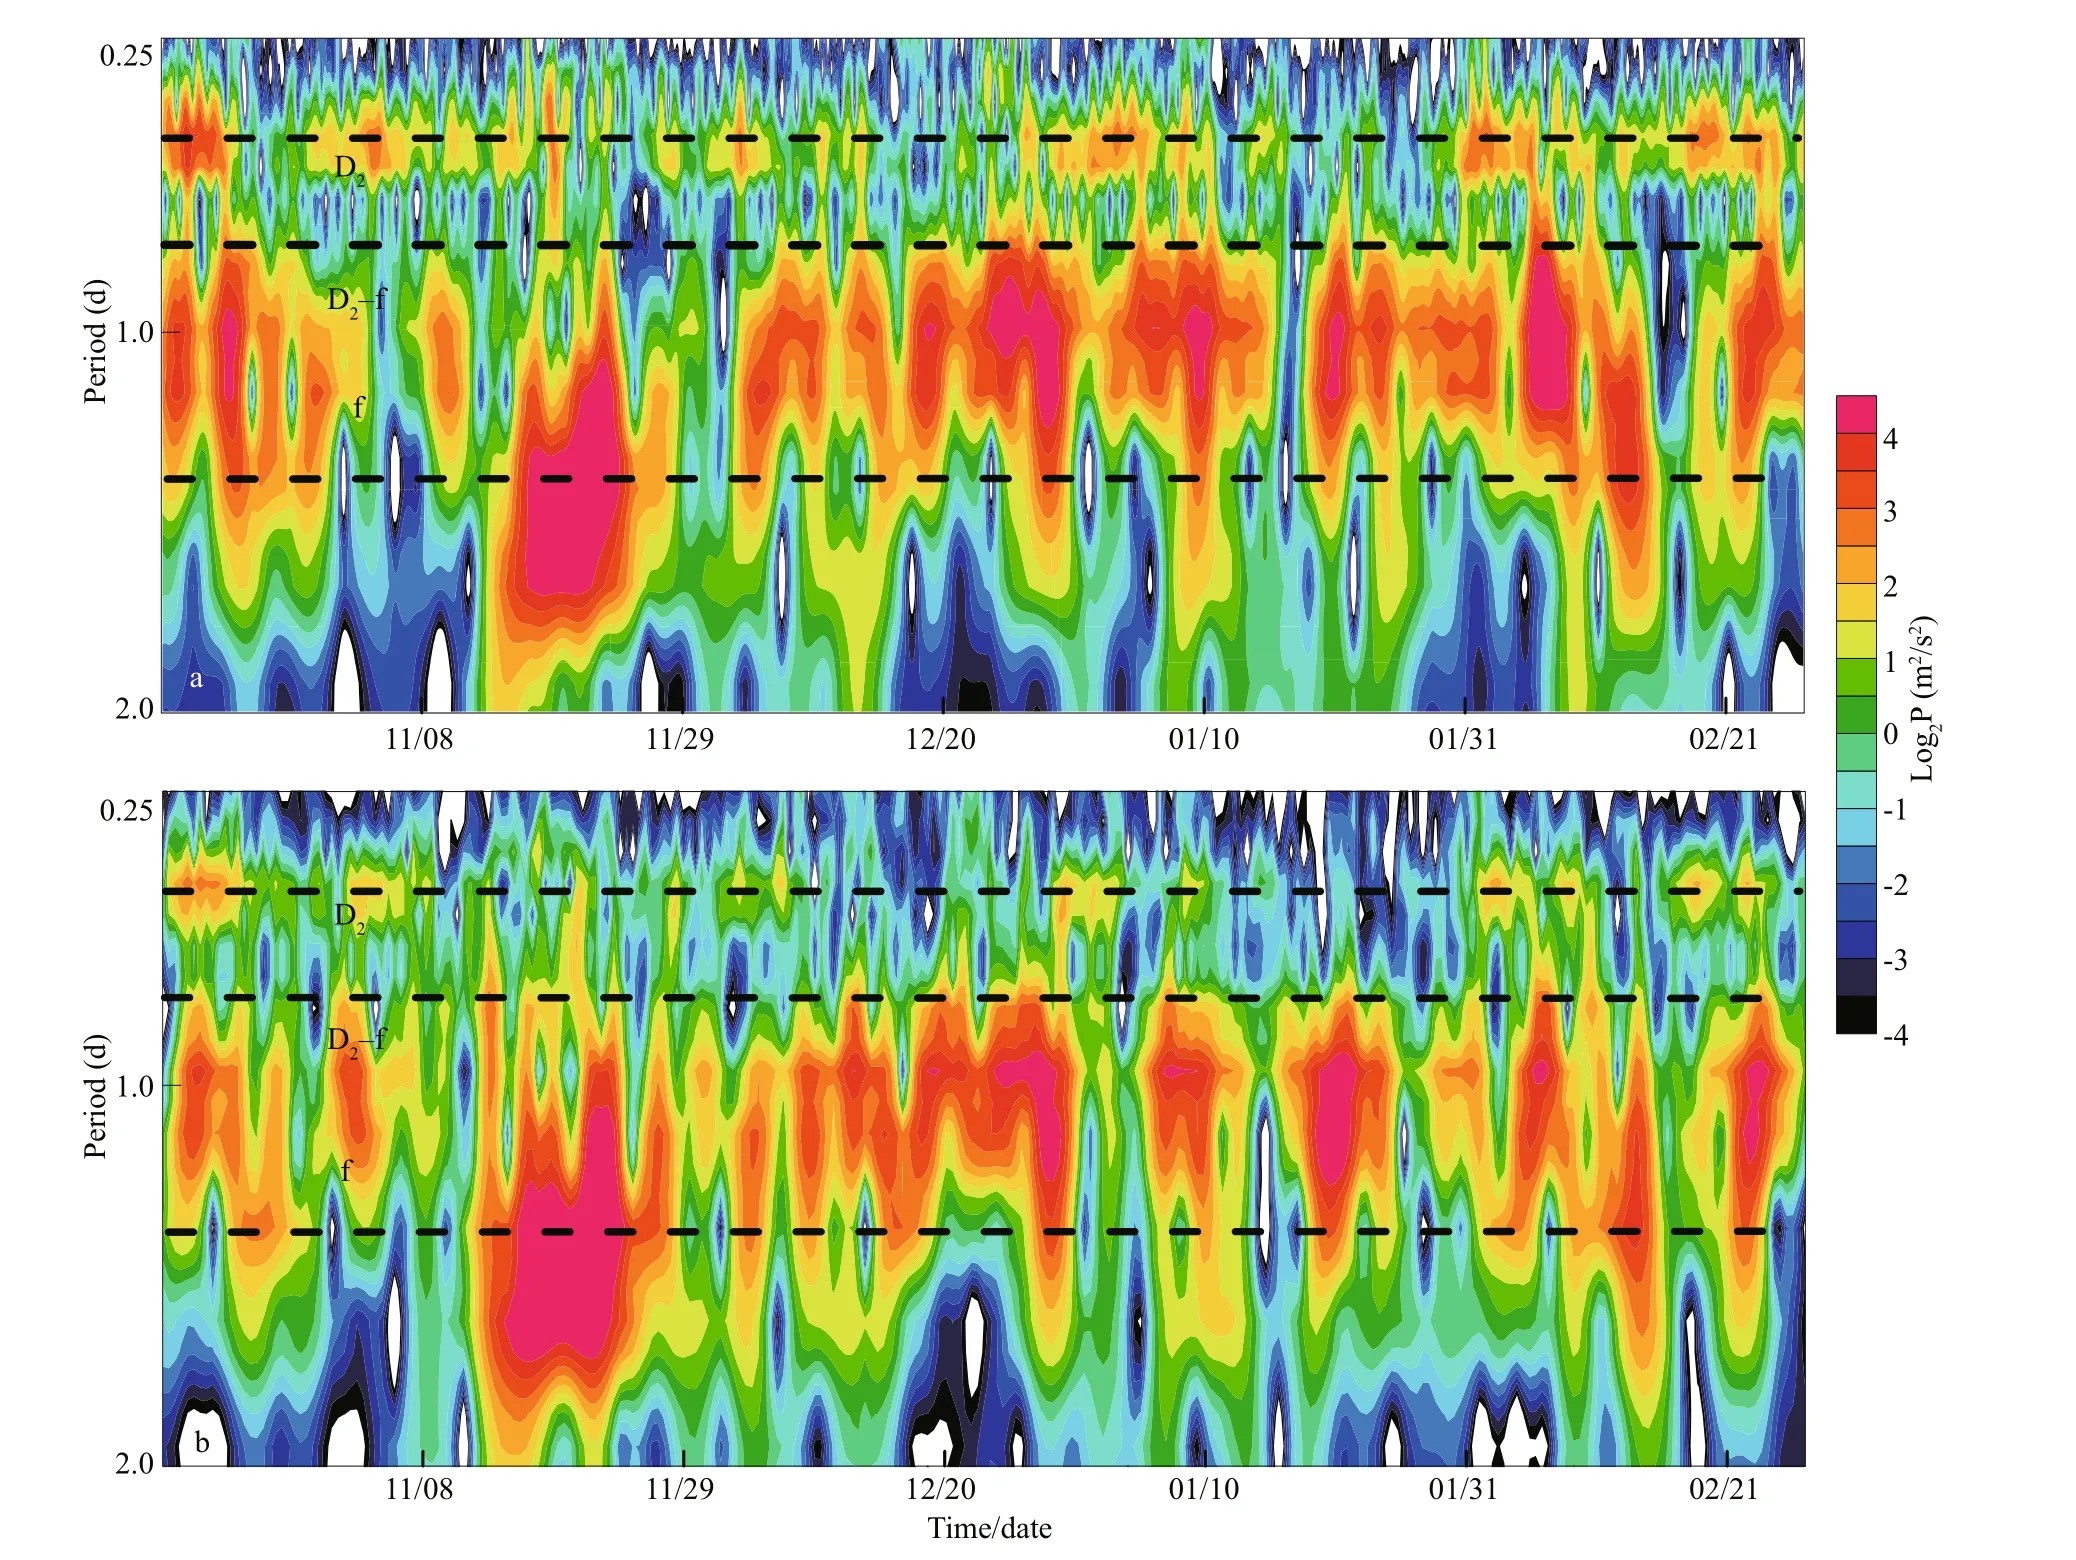
Fig.6 Wavelet power spectra of eastward (a) and northward (b) velocities at 300 m
The depth-averaged KEs of the NIWs and D2-f waves are shown in Fig.7a and 7b. For the entire observational period, no typhoon other than Krosa passed by. The velocities of the mesoscale currents were estimated from the moored data based on lowpass fi ltering with a cutoff frequency of 96 hours. The variances of the currents were computed asThe depth-averaged Vars of the mesoscale currents and the D2internal tides are shown in Fig.7c and 7d.The KEs of the D2-f waves are highly correlated temporally with the NIWs. The NIWs and D2-f waves were both stronger before 29 November 2013 and after 31 January 2014, i.e., when the D2tides were evident, than at times when the D2tides remained rather weak and much more stable. This suggests that the NIWs and D2-f waves were closely correlated with the D2internal tides and that most of their energy was supplied by the D2tides. It is notable that each of the large peaks in KE of the NIWs was associated with a corresponding pulse in the Var of the mesoscale flows, e.g., the peaks around 8 and 19 November 2013 and 12 and 21 February 2014; however, the converse was not true. This suggests strongly that the PSI was modulated by mesoscale eddies. The AE increased the PSI by lowering the background stratifi cation within the upper ocean. However, the emergence of mesoscale eddies induced the enhancement of PSI only during periods of strong D2tides. Thus, PSI, which is a type of wave-wave nonlinear interaction, was not obvious in the period 29 November 2013 to 31 January 2014, although mesoscale flows were apparently strong. The PSI could effciently weaken the KE of D2tides and enhance that of the subharmonics. In that period, the D2tides were rather weak and little energy was available for transfer to the NIWS and the D2-f waves.This explains why we were unable to observe enhanced NIWs or D2-f waves during that period.
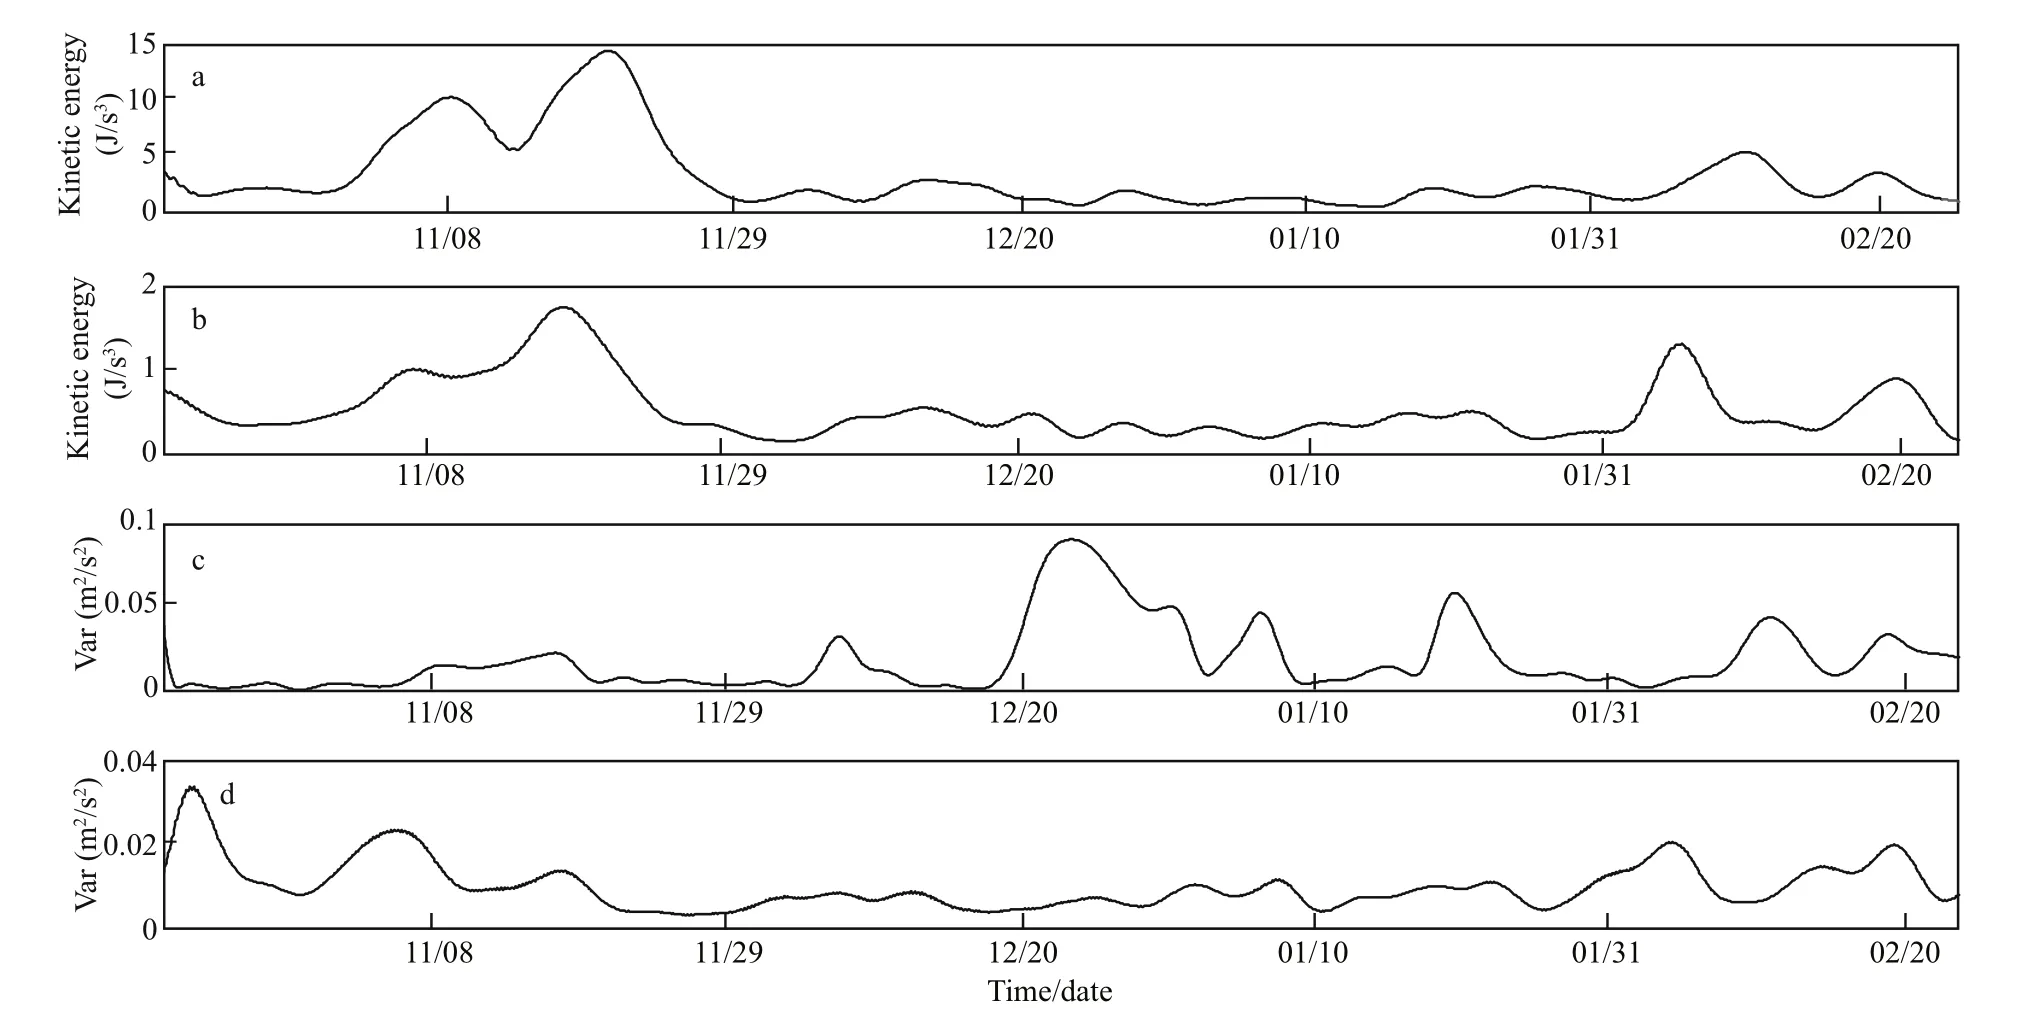
Fig.7 Upper two graphs show depth-averaged KE of NIWs (a) and D2-f waves (b); lower two graphs show depth-averaged Var of mesoscale flows (c) and D2internal tides (d)
The density at mooring M1 was calculated based on temperature and salinity from WOA05. Figure 8 shows the density at M1 decreased considerably at depths below 200 m. We noticed that the KE of the D2-f waves was greatest at depths around 150 m(Fig.5c). This might be because the pycnocline interacted intensively with the D2internal tides at that depth, enhancing the D2-f waves. We also noticed that the PSI of the D2tides was strong in the period 2-14 November 2013. This might be because the disturbance associated with Krosa reduced the upperocean temperature. Krosa and the AE weakened the oceanic stratifi cation, and the lowering of the background buoyancy frequency caused the PSI.
5 SUMMARY AND CONCLUSION
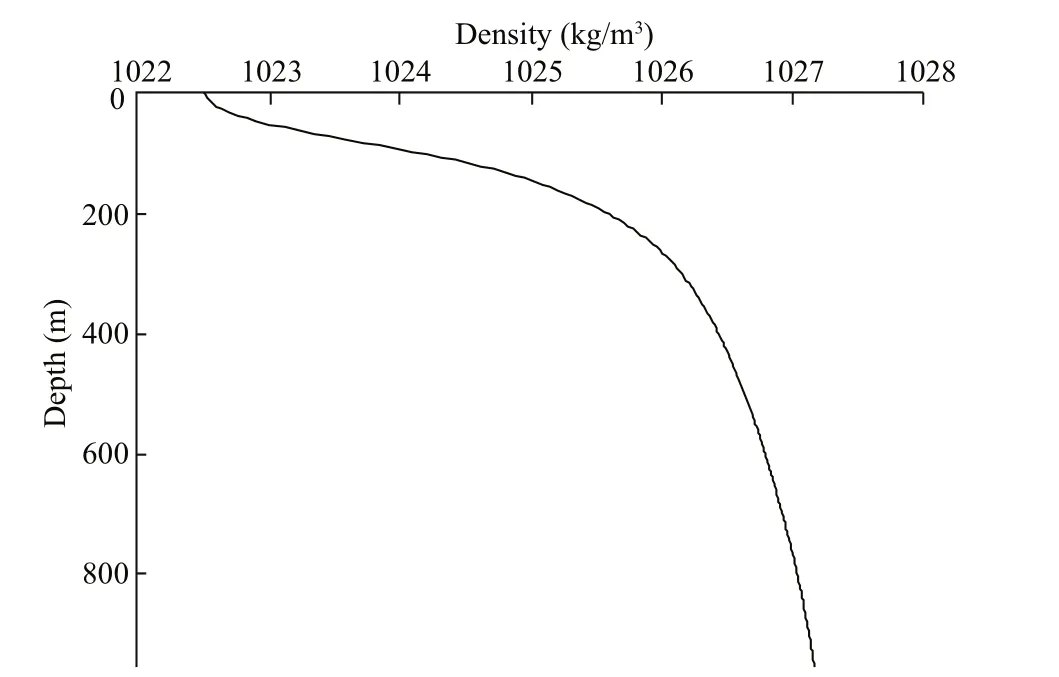
Fig.8 Density distribution with depth at mooring M1
Current profi les from a set of 131-day moored ADCP data in the northern SCS were presented revealing that NIWs were generated by wind and PSI.The near-surface ocean responded to typhoon Krosa,which excited NIWs in the upper-ocean mixed layer shortly after it passed by. The enhancement of NIWs lasted nearly one month, much longer than observed previously in the SCS. Furthermore, the NIWs that emerged after 14 November 2013 were distinct from those evident before that date. From 2-13 November,NIWs were surface-intensified and their intensity decreased with depth, whereas NIWs were enhanced simultaneously a second time at depths below 150 m after 14 November 2013. An EOF analysis showed the near-inertial currents that emerged after 14 November had higher vertical modes. Rotation spectra of the current velocity showed that the D2-f currents that propagated upward, in direction opposite to the NIWs, dominated the anticlockwise spectrum.The PSI of the D2internal tides generated NIWs and D2-f waves. The PSI effectively transferred the energy of the low-mode D2tides to the two high-mode subharmonics of NIWs and D2-f waves. The occurrence of PSI was not occasional, for subharmonic waves were strengthened at depths with amplified D2energy. Wavelet power spectra showed that PSI happened throughout the entire observational period.
Based on numerical simulation, Gayen and Sarkar(2013) suggested that interaction of D2internal tides with the upper-ocean pycnocline enhanced PSI and weakened the beams of the D2internal tides. The frequency of the subharmonic waves was associated with the ratio of the forcing wave frequency to the buoyancy frequency and the Reynolds number. Our observations confi rmed the fi ndings of their study.The inf l uence of mesoscale eddies and typhoon activity could effectively decrease the background buoyancy frequency in the upper ocean and thus cause the PSI of the D2tides, generating subharmonic waves with unequal frequencies. Enhancement of PSI was only observed during periods of strong D2tides.In the vertical, the strongest PSI emerged at depths of 150 m, which suggested the D2internal wave beams interacted intensively with the pycnocline. In addition to transferring energy directly to the NIWs, mesoscale eddies could amplify the energy in the f band by enhancing the PSI of D2internal tides. This represents another mechanism linking the energy of mesoscale eddies to that of NIWs. When D2internal tides were strong and background stratifi cation was lowered, the Specific PSI could occur. Energy was transferred from the D2internal tides to the NIWs and the D2-f waves.
6 ACKNOWLEDGEMENT
The mooring data used in this paper were obtained by the South China Sea Mooring Array constructed by the Ocean University of China. We are grateful to Professor TIAN Jiwei and ZHAO Wei for providing the mooring data that made the present study possible.
猜你喜欢
杂志排行

Journal of Oceanology and Limnology的其它文章
- Editorial Statement
- The post-larval and juvenile fi sh assemblage in the Sukhothai Floodplain, Thailand*
- Effects of probiotic on microf l oral structure of live feed used in larval breeding of turbotScophthalmus maximus*
- Comparison ofintestinal microbiota and activities of digestive and immune-related enzymes of sea cucumberApostichopus japonicusin two habitats*
- Otolith shape analysis for stock discrimination of twoCollichthysgenus croaker (Pieces: Sciaenidae,) from the northern Chinese coast*
- The impact of spatial autocorrelation on CPUE standardization between two different fi sheries*