Amphibian Species Contribute Similarly to Taxonomic, but not Functional and Phylogenetic Diversity: Inferences from Amphibian Biodiversity on Emei Mountain
2018-06-28TianZHAOBinWANGGuochengSHUChengLIandJianpingJIANG
Tian ZHAO, Bin WANG, Guocheng SHU, Cheng LI and Jianping JIANG
CAS Key Laboratory of Mountain Ecological Restoration and Bioresource Utilization, and Ecological Restoration Biodiversity Conservation Key Laboratory of Sichuan Province, Chengdu Institute of Biology, Chinese Academy of Sciences, Chengdu 610041, China
1. Introduction
Biological diversity plays an important role in supporting ecosystem functioning and provides key ecosystem services to human beings (Balvaneraet al., 2006;Cardinaleet al., 2006). Unfortunately, with the expansion of human populations and urbanization, human-induced perturbations (e.g., habitat degradation, biological invasions, climate change, and pollution) have caused widespread loss of biodiversity at both local and global scales (Dunneet al., 2002; Cardinaleet al., 2012).Given that the loss of biodiversity may induce various ecological and economic consequences, conservationists have devoted much attention to biodiversity. Most previous conservation studies focused primarily on species richness (i.e., taxonomic diversity), based on the assumption that species can be treated as ecological equivalents within communities (Perringset al., 1995).In recent decades, however, a growing number of studies indicate that species richness represents only one measure of biodiversity, thus demanding more comprehensive approaches (Naeemet al., 2012; Poolet al., 2014). It is now recognized that in addition to taxonomic diversity,species-specific functional traits and genetic relatedness,mediate the stability and resilience of ecosystems(Villégeret al., 2010; Rudolfet al., 2014). Therefore,biodiversity conservation strategies should also include functional diversity (i.e., the range of species traits within a community; Poolet al., 2014) and phylogenetic history(i.e., evolutionary relationships among species; Faith,1992) of communities.
This is especially true for communities under multiple disturbances in a changing world. The rapid and consistent response of functional diversity can provide advance warning of disturbances to ecosystems.Moreover, phylogenetic diversity has been proposed as a measure to predict how evolutionary plasticity within communities will respond to disturbances in the future (Faith, 1992), and to better explain ecosystem productivity (Cadotteet al., 2009). Incorporating multiple facets of biodiversity in conservation strategies can thus provide unique opportunities to better understand community structures and dynamics (Webbet al., 2002;Graham and Fine, 2008), to ensure the provision of goods and services (Díazet al., 2007), and to identify species of conservation interest (Mace, 2003; Knappet al., 2008).
Theoretical studies suggest that the best way to conserve biodiversity is to protect individual species that preserve different biodiversity components (Devictoret al., 2010). Indeed, this policy is unfeasible because of limited resources. Instead, current conservation activities have focused on species that are rare, endemic,distinctive, or at risk of extinction (Myerset al., 2000;Kieret al., 2009). However, do these species of high conservation value contribute more to biodiversity, and therefore potentially induce stronger cascading effects on ecosystem functioning, than other species? Or do individual species that contribute equally to multiple facets of biodiversity still relatively uncommon (but see Devictoret al., 2010; Poolet al., 2014), especially for amphibian species that play a key functional role in the link between aquatic and terrestrial ecosystems.
The aim of the present study is to assess the contribution of individual amphibian species to different aspects of biodiversity. We predict that amphibian species will contribute in different ways to taxonomic, functional and phylogenetic diversity. Specifically, we first explored the role of individual species in taxonomic, functional and phylogenetic diversity, which allowed us to identify the ecological and evolutionary importance of each species. Then, we tested whether species listed by the IUCN as being of conservation interest (i.e. endangered,vulnerable and near threatened species) contribute more to taxonomic, functional and phylogenetic diversity than species without elevated conservation status (i.e.,species of least concern). This can help us to recognize the conservation value of species for different facets of biodiversity that are not traditionally considered in conservation activities.
2. Materials and Methods
2.1. Study area and field surveysThe study area, Emei Mountain, is located in southwest Sichuan Province,China. This mountain is a series of ranges spread over 1100km2. In total, 104 nocturnal surveys were conducted along 52 transects (200 m × 2 m) from April to October in 2013 and 2014, using the same combination of distance sampling and quadrat sampling methods, with four transects sampled per night. Distance sampling is considered as a positive and effective method for anurans(Fogarty and Vilella, 2001; Funket al., 2003), and quadrat sampling is effective for stream amphibians (Dodd, 2010).Two persons first intensively searched the transect along the edge of stream by turning over logs, stones, and leaf litter, and hand-collected all individuals (Herbeck and Semlitsch, 2000; Naniwadekar and Vasudevan, 2006). Ten quadrats of one square meter area were then randomly selected within the stream, all the rocks were carefully removed, and individual amphibians were collected using a hand net (Dodd, 2010). All individuals were identified to species, measured (snout-vent length to the nearest mm), photographed, toe-clipped, and then released at the site of capture.
These transects, at elevations from 476–3000m, have a gradient of environmental conditions. Specifically, lower transects are close to lentic aquatic ecosystems (e.g.,swamps and ponds), and are dominated by evergreen broad-leaved forest. Transects in middle and higher elevations are located along slowly flowing pools and stream tributaries, respectively, with evergreen and deciduous broad-leaved forests gradually replaced by coniferous and mixed forests. Transects were selected at random, but include all suitable habitats for amphibian species.
2.2. Selection of functional traitsBased on published literatures, a set of 11 functional traits reflecting morphology, resource use, and life history strategy were selected (Trochetet al., 2014; Tsianou and Kallimanis,2016; Table 1). These traits described the unique relationship between each species and the environment,and importantly, reflected the ecological function of species in those ecosystems. Qualitative and quantitativemeasurements were made using digital calipers and visual observation; values of some traits were derived from Feiet al. (2009). These functional traits were snout vent length (SVL; cm), sexual maturity (SM; 1 year, 1-3 years,or >3 years), clutch position (=oviposition site) (CP;ground, lotic habitat, lentic habitat, or arboreal), number of eggs per clutch (NEC), egg size (diameter) (ES;mm), duration of breeding activity (DBA; prolonged,or explosive), spawning site (SS; aquatic, or terrestrial),life history habit (LHH; aquatic, or terrestrial), time partitioning (diel activity) (TP; nocturnal, or diurnal), diet[DI; carnivorous (i.e., all salamander species), mainly feeding on pests, mainly feeding on other insects] and mobility mode (mode of locomotion) (MM; jumper,walker, runner, climber, or swimmer). Considering the deficiency of data on amphibian species traits (reviewed in Trochetet al., 2014), selection of functional traits was also based on the availability of complete trait data.
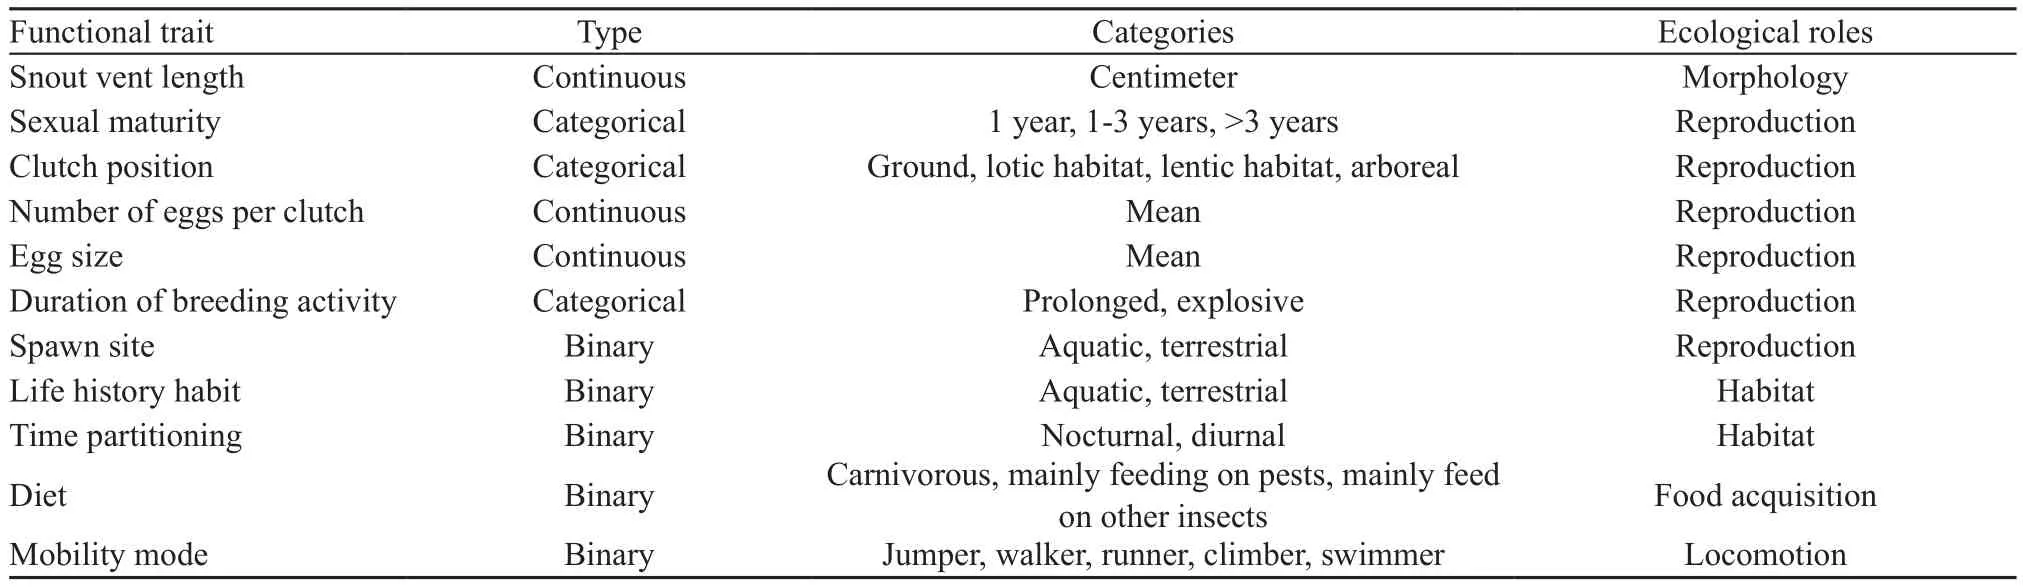
Table 1 Eleven functional traits associated with morphology, reproduction, habitat, food acquisition, and locomotion (adapted from Tsianou and Kallimanis, 2016).
2.3. Phylogenetic analysesSequence data were obtained from GenBank. Sequences were edited manually in BioEdit v7.0.5, aligned in Mega 6.0 using the ClustalW algorithm with default parameters (Tamuraet al., 2013),and were checked by eye for ambiguous alignments.We used Bayesian inference (BI; performed in MrBayes 3.1.2; Ronquist and Huelsenbeck, 2003) and Maximumlikelihood (ML; performed under the GTRGAMMA model using RAxML Web Server; Stamatakis, 2006)to reconstruct a mitochondrial gene tree using partial fragments of the 12S and 16S ribosomal genes, and the complete t-RNAvaline. The best- fitting model, GTR+G, was developed using ModelTest 3.7 (Posada and Crandall,1998). For the bayesian analysis, we ran four concurrent Markov Chains for five million generations, sampling every 100 generations . The first 25% sampled trees were discarded as burn in. The resulting trees were combined to calculate posterior probabilities for each node in a 50% majority-rule consensus tree. Branch support in the maximum likelihood analysis was assessed using 1000 nonparametric bootstrap replicates. Nodes in the trees were considered well supported when Bayesian posterior probabilities were ≥0.95 and ML bootstrap support was≥70% (Hillis and Bull, 1993).
2.4. Statistical analysesAll sampled species were considered to be the regional species pool. Species were then classified into three categories based on their IUCN conservation status. EN: critically endangered or endangered; VU/NT: vulnerable and near threatened; and LC: least concern. Species in the vulnerable and nearthreatened categories were pooled to ensure a sufficient sample size for statistical analysis. Since the functional traits data were measured on both discrete and continuous scales, we first used Gower’s coefficient to construct a dissimilarity matrix of all functional traits (Pavoineet al., 2009). We then used a principal coordinates analysis (PCoA) to build a multidimensional functional space following Villégeret al. (2008), to define the position of each species in functional space. Functional distances using Gower’s metric were significantly correlated with the Euclidean distances between species pairs in functional space (Mantel test,r2= 0.776,P<0.001), providing evidence that functional diversity can effectively capture community trait diversity (Poolet al., 2014). Following Maireet al. (2015), the first four synthetic principal components of the PCoA analysis were retained to describe the functional space, as they produced a mean-squared deviation index of 0.002,demonstrating that these components can sufficiently describe interspecific distances. The four axes accounted for 68.83% (PC1 = 24.73%, PC2 = 20.53%, PC3 =12.47% and PC4 = 11.10%; Figure 1 and Table 2) of theinitial inertia in trait values. Each species had a distinctive position in functional space, which was used below to calculate the contribution of individual species to overall aspects of biodiversity.
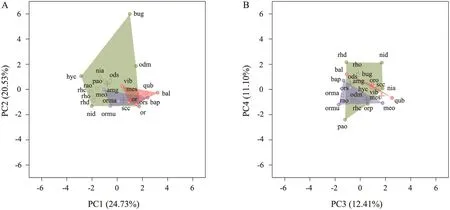
Figure 1 Distribution of all species in the functional space defined by the regional species pool, based on the four first PCA axes. (A) PC1 and PC2 of the functional space, (B) PC3 and PC4 of the functional space. EN (critically endangered or endangered), VU/NT (vulnerable and near threatened) and LC (least concerned) species were plotted in red, blue, and green, respectively. Colored surfaces correspond to the functional space occupied by each category, and crosses to the center of gravity of the convex hulls. Species codes are in Table 3.
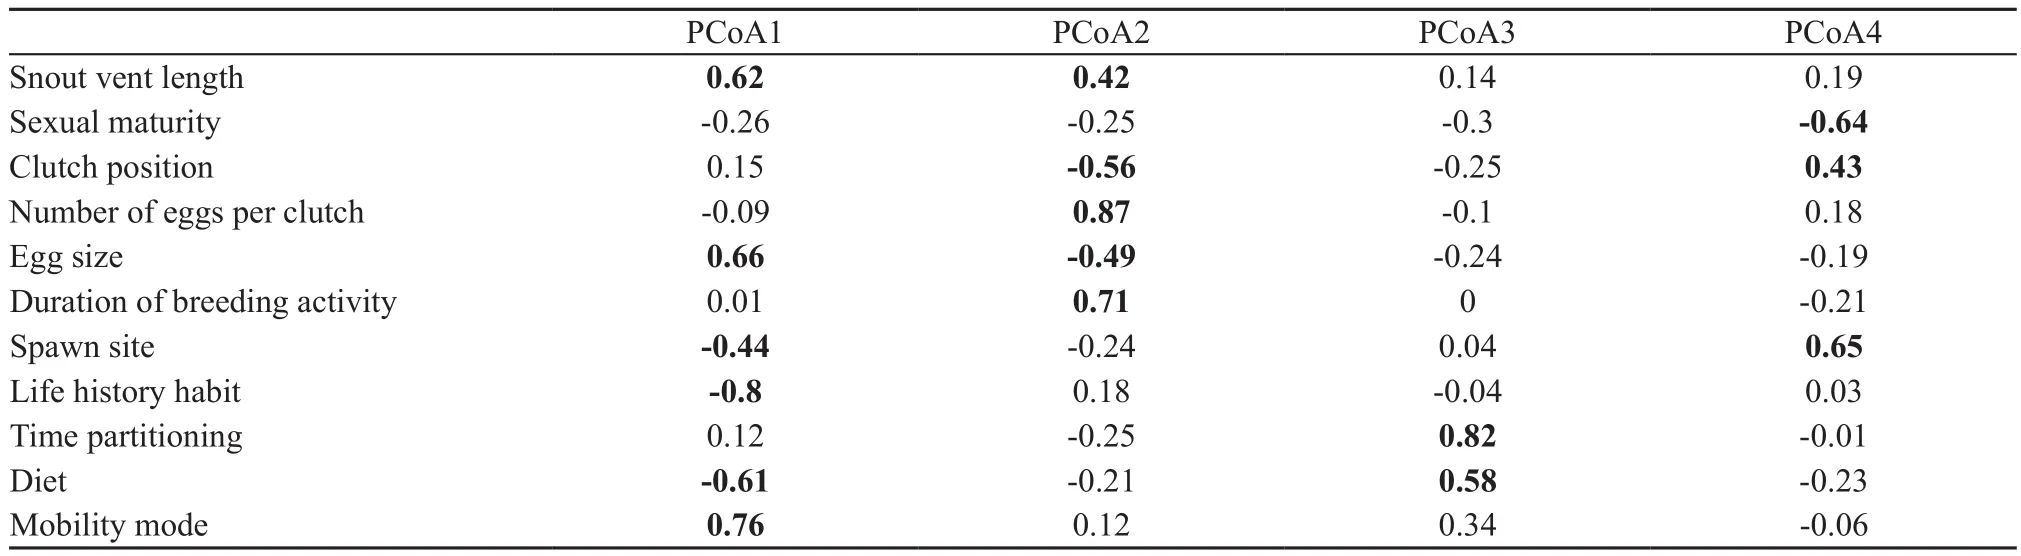
Table 2 Pearson correlation coefficients between the first four synthetic principal components of the PCoA analysis axes and the 11 functional traits. Statistically significant correlation coefficients are in bold.
Contribution of individual species to multiple facets of biodiversityTaxonomic diversity was represented by the number of species, functional diversity by functional richness index, and phylogenetic diversity by the total branch length of species within the community(Poolet al., 2014). We simulated randomly assembled communities to identify the contribution of individual amphibian species to different facets of biodiversity because (1) it was easy to obtain a large number of communities, which produced a gradient in species richness; (2) the local stochastic processes involved in community assembly can be mimicked by random sampling from a regional species pool (Loreau, 2001);and (3) simulations allow for control of concurrent changes in species richness and random extinctions of species (Larsenet al., 2005). Based on the fourdimension functional space, random communities should contain more than four species to allow calculation of functional richness. Therefore, five species were first selected randomly from the regional species pool using a bootstrap procedure with 1000 repetitions (i.e., a set of 1000 random communities, each with five species, was obtained). Since we assumed that the regional species pool containedSspecies in total, the same protocols were then performed to obtain a set of 1000 random communities with six species, a set of 1000 random communities with seven species, and so on, up to a set of 1000 random communities with (S– 1) species. In total,(S– 5) × 1000 random communities were simulated. The abundance of each species was not considered as it did not affect the taxonomic, functional, and phylogenetic diversity indices we used.
The contribution of each species to different aspects of biodiversity was quantified as follows: the taxonomic,functional, and phylogenetic diversity of each random community were calculated firstly, and then all the diversity indices were recalculated by removing each species. The differences in diversity values before and after species removal were computed. The relative contribution of each species was assessed by calculating the mean percentage of diversity change within each random communities.
Contribution of conservation status to facets biodiversityThe mean relative contribution to biodiversity of species of the same conservation status was calculated to explore whether species of conservation interest (i.e., EN and VU/NT species) contribute more to taxonomic, functional and phylogenetic diversity than species without elevated conservation status (i.e., LC species) do. Since the three groups have different number of species, we used Nemenyi–Damico–Wolfe–Dunn tests(Nemenyi, 1963) (a nonparametric Tukey-type, multiple comparisonpost hoctest) to compare the difference of biodiversity contribution between pairwise categories,All statistical analyses were conducted in R 3.3.2 (R development Core Team, 2017).
3. Results
A total of 24 amphibian species were detected in the regional species pool, with 5 EN species, 5 VU/NT species, and 14 LC species. The number of individual animals of each species ranged from 1 to 10, with a mean of 4.2 ± 3.2 SD. The most abundant amphibian species were Spiny-bellied frog (Quasipaa boulengeri) and Baoxing treefrog (Rhacophorus dugritei), which made up 31.75% of the total individuals. The rarest species was Longdong stream salamander (Batrachuperus londongensis), with only one individual found.
3.1. Contribution of individual species to biodiversityAll 24 species contributed similarly to taxonomic diversity, but differently to functional and phylogenetic diversity of simulated random communities (Table 3).Specifically, the Asiatic toad (Bufo gargarizans), the Omei music frog (Nidirana daunchina) and the Spinybellied frog (Quasipaa boulengeri) were the speciesthat contributed the most to functional diversity (i.e.35.76% ± 0.16% SE, 21.27% ± 0.11% SE, and 16.85%± 0.09% SE; respectively). Species that contributed the least to functional diversity were the Shaping horned toad(Megophrys shapingensis; 1.09% ± 0.03% SE), the Omei mustache toad (Vibrissaphora boringii; 1.47% ± 0.04%SE) and the Jinding odontoid toad (Scutiger chintingensis;1.57% ± 0.04% SE). In terms of phylogenetic diversity,the Sichuan sucker frog (Amolops granulosus), the Omei tooth toad (Oreolalax omeimontis) and the Green odorous frog (Odorrana margaretae) were the substantial contributors (i.e. 10.83% ± 0.06% SE, 10.34% ± 0.05%SE, 10.26% ± 0.06% SE; respectively), while the Jinding odontoid toad (Scutiger chintingensis), the Oshan metacarpal-tubercled toad (Paramegophrys oshanensis)and the Omei horned toad (Megophrys omeimontis)contributed less (6.06% ± 0.04% SE, 6.47% ± 0.04%SE, 6.86% ± 0.04% SE; respectively) than other species(Table 3).
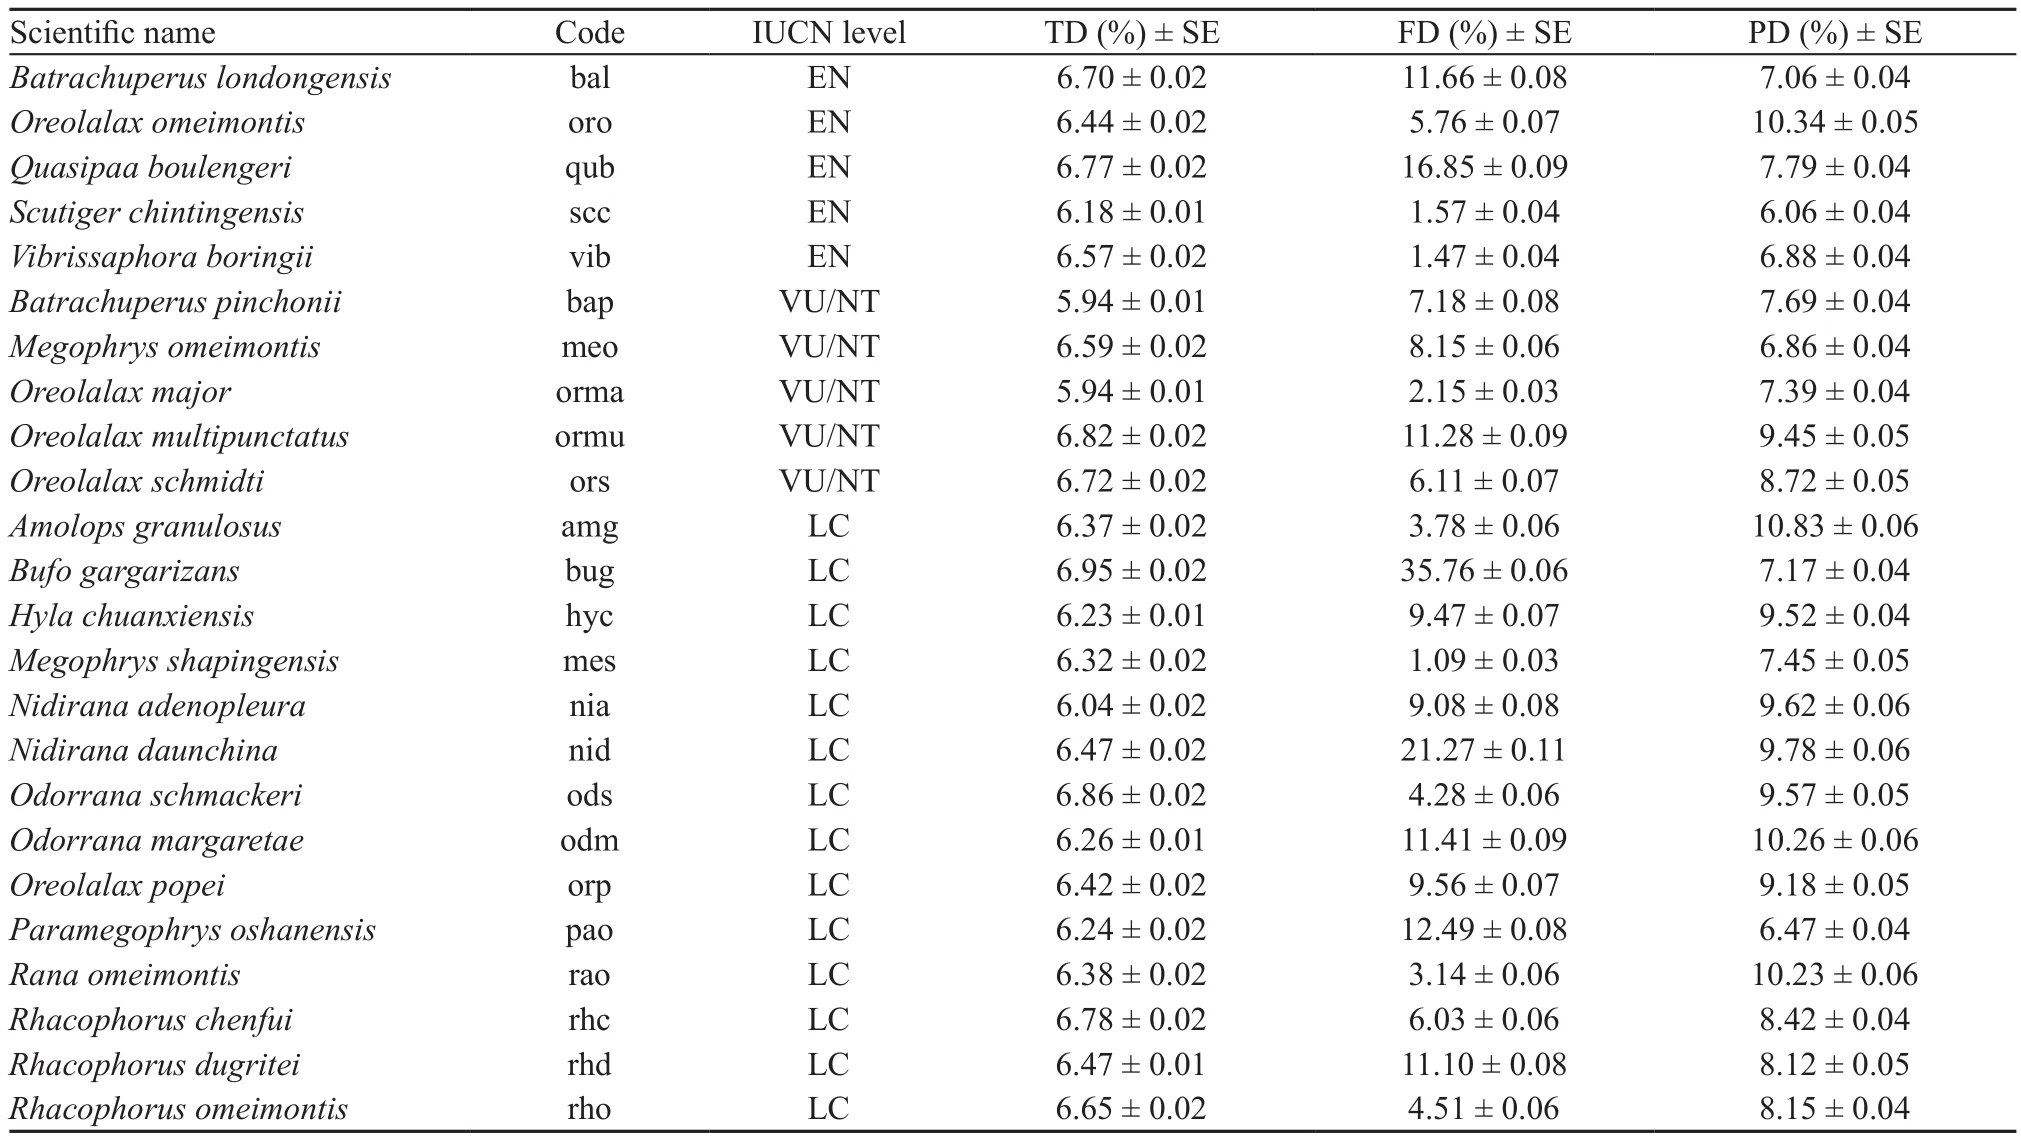
Table 3 Contribution of individual species to different components of biodiversity (TD: taxonomic diversity; FD: functional diversity; PD:phylogenetic diversity).
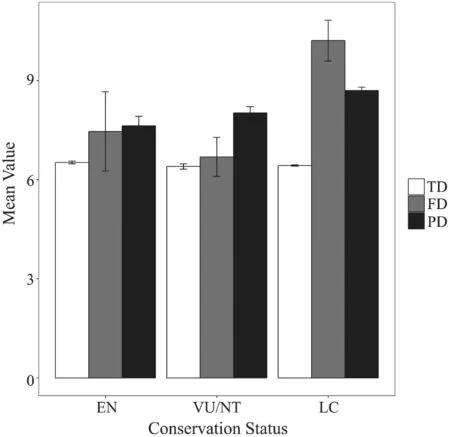
Figure 2 Box plots of each IUCN conservation status’ (EN:critically endangered or endangered; VU/NT: vulnerable and near threatened; and LC: least concern) contribution to different components of biodiversity (TD: taxonomic diversity; FD:functional diversity; and PD: phylogenetic diversity). Error bars indicate the standard error.
3.2. Contribution of conservation status to biodiversityThe relative contributions of EN species to taxonomic,functional and phylogenetic diversity were 6.52% ±0.04% SE, 7.46% ± 1.20% SE, 7.63% ± 0.29% SE;respectively. The relative contributions of VU/NT species to taxonomic, functional and phylogenetic diversity were 6.40% ± 0.08% SE, 6.69% ± 0.59%SE, 8.02% ± 0.19% SE; respectively. For LC species,the relative contributions to taxonomic, functional and phylogenetic diversity were 6.43% ± 0.02% SE, 10.21%± 0.62% SE, 8.70% ± 0.10% SE; respectively. Nemenyi–Damico–Wolfe–Dunn multiple comparisonpost hoctests indicated that there were no signi fi cant differences between pairwise categories of conservation status of the relative contribution to taxonomic diversity (EN - VU/NT:P= 0.88, EN - LC:P= 0.76, VU/NT - LC:P= 0.94;respectively), functional diversity (EN - VU/NT:P= 1.00,EN - LC:P= 0.83, VU/NT - LC:P= 0.86; respectively)and phylogenetic diversity (EN - VU/NT:P= 0.94, EN- LC:P= 0.31, VU/NT - LC:P= 0.48; respectively)(Figure 2).
4. Discussion
Our results revealed that amphibian species contributed similarly to taxonomic diversity, but differently to functional and phylogenetic diversity. This was primarily driven by the diverse functional attributes of individual species present in the functional space, and the phylogenetic relationships between species.
Traditional conservation theories suggested that the maximum protection of taxonomic diversity (species richness) can preserve multiple facets of biodiversity simultaneously (Devictoret al., 2010). However, it is impossible to protect all the species simultaneously, and it has been suggested that endemic and distinctive species be given conservation priority (Myerset al., 2000; Kieret al., 2009). Given that not all endemic and distinctive species contributed substantially to taxonomic, functional and phylogenetic diversity in the present study, we argue that effective conservation strategies should not only focus on speciesper se, but that such strategies need a comprehensive method that includes species richness,functional traits, and their evolutionary relationships(Brooks, 2006; Lee and Jetz, 2008).
In fact, one of the important research areas in conservation ecology was the unraveling of linkages between species traits, genetic relatedness, and extinction risk, which were critical criteria for prioritizing conservation efforts (Murray and Hose, 2005). Our results showed that amphibian species that contributed the most to functional diversity usually exhibited specific functional attributes (e.g., the Omei music frog and Spiny-bellied frog), demonstrating that these species may play distinct functional roles in ecosystems. These species displayed larger body size, smaller number of eggs per clutch, larger egg size, and shorter breeding period. More importantly, these traits may lead to higher vulnerability when species are under various types of disturbances.This can be explained by the fact that species with larger body size generally have a longer life cycle (Cardillo,2005), and species with low fecundity have a slower population turnover, thus impeding rapid population restoration after historical contractions or catastrophic population crashes (Williams and Hero, 1998; Heroet al., 2005; Sodhiet al., 2008). Moreover, these species are mainly carnivorous, with poor capacity for locomotion,leading to high predation risk and over-exploitation by humans (Collins and Crump, 2009; Chanet al., 2014). In addition, our findings were also consistent with Lipset al.(2003), showing that riparian amphibians were generally more easily affected than terrestrial species, probably because many potential causal factors of population decline are stream-borne, such as disease and pollution(Williams and Hero, 1998). Similarly, species that contributed the most to phylogenetic diversity usually showed distinctive evolutionary relationships (e.g.,the Sichuan sucker frog and Omei tooth toad). These“phylogenetically rare” species should be considered to have priority for protection as their extinction will cause larger loss of evolutionary information within the community (Winteret al., 2013). Interestingly, we found that the degree of relative contribution of a species to functional and phylogenetic diversity were not similar.This result indicated that species within a community may have redundant functional traits, but show a unique position in the phylogeny (e.g.Amolops granulosusandRana omeimontis), or species with distinct functional traits may represent phylogenetic conservatism within a community (e.g.,Bufo gargarizansandParamegophrys oshanensis; Poolet al., 2014). All of these observations demonstrated that the conservation importance of species was affected by both their functional and phylogenetic attributes (Faith, 1992; Díaz and Cabido, 2001). And importantly, our results may give potential conservation priority for each species, with higher priority given to the conservation of species contributing most to functional and/or phylogenetic diversity in a given region.
Species in categories of conservation interest did not display a significantly higher contribution to any aspect of biodiversity in our study area. Indeed, the local extirpation of either endangered or least concern species can result in dramatic loss in specific facet of community biodiversity. For instance,Quasipaa boulengeri(EN)andBufo gargarizans(LC) contributed substantially to functional diversity, whileOreolalax omeimontis(EN)andAmolops granulosus(LC) contributed substantially to phylogenetic diversity. Therefore, a set of species assemblages that include diverse threatened and common species should be protected to maintain a variety of biodiversity facets (Poolet al., 2014).
In conclusion, the present study revealed the contribution of individual species to multiple biodiversity facets. Our results suggested that species of conservation interest were not always the greatest contributors to taxonomic, functional, and phylogenetic diversity.Moreover, our results suggest that the integrated diversity components of threatened and common species within a community may help preserve community biodiversity.In turn this can allow conservationists to optimize conservation strategies and protect biodiversity effectively(de Carvalho and Tejerina-Garro, 2015). Given that this study was constrained to a limited area (i.e., local scale),and biodiversity crisis is a global problem in space/time,how to maintain biodiversity across larger temporal and spatial scales in a changing world should be further studied (Geringet al., 2003).
AcknowledgementsWe are grateful to Dengwei YANG and Jiongyu LIU for their help in the field. We thank David CANNATELLA and Jianwei GUO for editing the English. Tian ZHAO was supported by China Scholarship Council (CSC). This work was supported by the National Natural Science Foundation of China (31700353), the National Key Research and Development Program of China (2017YFC0505202), the West Light Foundation of Chinese Academy of Sciences (2016XBZG_XBQNXZ_B_007), and China Biodiversity Observation Networks(Sino BON).
Reference
Balvanera P., Pfisterer A. B., Buchmann N., He J. S.,Nakashizuka T., Raffaelli D., Schmid B. 2006. Quantifying the evidence for biodiversity effects on ecosystem functioning and services. Ecol Lett, 9: 1146–1156
Brooks T. M. 2006. Global biodiversity conservation priorities.Science, 313: 58–61
Cadotte M. W., Cavender-Bares J., Tilman D., Oakley T. H.2009. Using phylogenetic, functional and trait diversity to understand patterns of plant community productivity. PLoS ONE, 4:e5695
Cardillo M. 2005. Multiple causes of high extinction risk in large mammal species. Science, 309: 1239–1241
Cardinale B. J., Duffy J. E., Gonzalez A., Hooper D. U.,Perrings C., Venail P., Narwani A., Mace G. M., Tilman D.,Wardle D. A., Kinzig A. P., Daily G. C., Loreau M., Grace J. B., Larigauderie A., Srivastava D. S., Naeem S. 2012.Biodiversity loss and its impact on humanity. Nature, 486: 59–67
Cardinale B. J., Srivastava D. S., Emmett Duffy J, Wright J.P., Downing A. L., Sankaran M., Jouseau C. 2006. Effects of biodiversity on the functioning of trophic groups and ecosystems. Nature, 443: 989–992
de Carvalho R. A., Tejerina-Garro F. L. 2015. Relationships between taxonomic and functional components of diversity:Implications for conservation of tropical freshwater fishes.Freshw Biol, 60: 1854–1862
Chan H. K., Shoemaker K. T., Karraker N. E. 2014. Demography of Quasipaa frogs in China reveals high vulnerability to widespread harvest pressure. Biol Conserv, 170: 3–9
Collins J. P., Crump M. L. 2009. Extinction in our times: global amphibian decline. New York: Oxford University Press.
Devictor V., Mouillot D., Meynard C., Jiguet F., Thuiller W.,Mouquet N. 2010. Spatial mismatch and congruence between taxonomic, phylogenetic and functional diversity: The need for integrative conservation strategies in a changing world. Ecol Lett, 13: 1030–1040
Díaz S., Cabido M. 2001. Vive la différence: Plant functional diversity matters to ecosystem processes. Trends Ecol Evol, 16:646–655
Díaz S., Lavorel S., de Bello F., Quetier F., Grigulis K., Robson T. M. 2007. Incorporating plant functional diversity effects in ecosystem service assessments. Proc Natl Acad Sci, 104: 20684–20689
Dodd C. K. 2010. Amphibian ecology and conservation: A handbook of techniques. New York: Oxford University Press
Dunne J. A., Williams R. J., Martinez N. D. 2002. Network structure and biodiversity loss in food webs: Robustness increases with connectance. Ecol Lett, 5: 558–567
Faith D. P. 1992. Conservation evaluation and phylogenetic diversity. Biol Conserv, 61: 1–10
Fei L., Hu S., Ye C., Tian W., Jiang J., Wu G., Li J., Wang Y.2009. Fauna Sinica, Amphibia, Vol.2, Anura. Beijing, China:Science Press (In Chinese)
Fogarty J. H., Vilella F. J. 2001. Evaluating methodologies to survey eleutherodactylus frogs in Montane forests of Puerto Rico. Wildl Soc Bull, 29: 948–955
Funk W. C., Almeida-Reinoso D., Nogales-Sornosa F.,Bustamante M. R. 2003. Monitoring population trends of eleutherodactylus frogs. J Herpetol, 37: 245–256
Gering J. C., Crist T. O., Veech J. A. 2003. Additive partitioning of species diversity across multiple spatial scales: Implications for regional conservation of biodiversity. Conserv Biol, 17:488–499
Graham C. H., Fine P. V. A. 2008. Phylogenetic beta diversity:Linking ecological and evolutionary processes across space in time. Ecol Lett, 11: 1265–1277
Herbeck L. A., Semlitsch R. D. 2000. Life history and ecology of the southern redback salamander,Plethodon serratus, in Missouri. J Herpetol, 34: 341–347
Hero J. M., Williams S. E., Magnusson W. E. 2005. Ecological traits of declining amphibians in upland areas of eastern Australia. J Zool, 267: 221–232
Hillis D. M., Bull J. J. 1993. An empirical test of bootstrapping as a method for assessing confidence in phylogenetic analysis. Syst Biol, 42: 182–192
Kier G., Kreft H., Lee T. M., Jetz W., Ibisch P. L., Nowicki C.,Mutke J., Barthlott W. 2009. A global assessment of endemism and species richness across island and mainland regions. Proc Natl Acad Sci, 106: 9322–9327
Knapp S., Kühn I., Schweiger O., Klotz S. 2008. Challenging urban species diversity: Contrasting phylogenetic patterns across plant functional groups in Germany. Ecol Lett, 11: 1054–1064
Larsen T. H., Williams N. M., Kremen C. 2005. Extinction order and altered community structure rapidly disrupt ecosystem functioning: Altered community structure disrupts function. Ecol Lett, 8: 538–547
Lee T. M., Jetz W. 2008. Future battlegrounds for conservation under global change. Proc R Soc B Biol Sci, 275: 1261–1270
Lips K. R., Reeve J. D., Witters L. R. 2003. Ecological traits predicting amphibian population declines in central America.Conserv Biol, 17: 1078–1088
Loreau M. 2001. Biodiversity and ecosystem functioning: Current knowledge and future challenges. Science, 294: 804–808
Mace G. M. 2003. Preserving the tree of life. Science, 300: 1707–1709
Maire E., Grenouillet G, Brosse S, Villéger S. 2015. How many dimensions are needed to accurately assess functional diversity?A pragmatic approach for assessing the quality of functional spaces: Assessing functional space quality. Glob Ecol Biogeogr.24:728–740.
Murray BR, Hose GC. 2005. Life-history and ecological correlates of decline and extinction in the endemic Australian frog fauna.Austral Ecol, 30: 564–571
Myers N., Mittermeier R. A., Mittermeier C. G., da Fonseca G. A., Kent J. 2000. Biodiversity hotspots for conservation priorities. Nature, 403: 853–858
Naeem S., Duffy J. E., Zavaleta E. 2012. The functions of biological diversity in an age of extinction. Science, 336: 1401–1406
Naniwadekar R., Vasudevan K. 2006. Patterns in diversity of anurans along an elevational gradient in the Western Ghats,South India: Patterns in diversity of anurans. J Biogeogr, 34:842–853
Nemenyi P. B. 1963. Distribution-free multiple comparisons. Ph.D.Thesis. Princeton University
Pavoine S., Vallet J., Dufour A. B., Gachet S., Daniel H. 2009. On the challenge of treating various types of variables: Application for improving the measurement of functional diversity. Oikos,118: 391–402
Perrings C. A , Mäler K. G., Folke C., Holling C. S., Jansson B. O. 1995. Biodiversity conservation: problems and policies.Dordrecht, The Netherlands: Kluwer Academic Publishers.
Pool T. K., Grenouillet G, Villéger S. 2014. Species contribute differently to the taxonomic, functional, and phylogenetic alpha and beta diversity of freshwater fish communities. Divers Distrib, 20: 1235–1244
Posada D., Crandall K. A. 1998. MODELTEST: Testing the model of DNA substitution. Bioinformatics, 14: 817–818
R development Core Team. 2017. R: A language and environment for statistical computing. R Foundation for Statistical Computing, Vienna, Austria. http://www.R-project.org/
Ronquist F., Huelsenbeck J. P. 2003. MrBayes 3: Bayesian phylogenetic inference under mixed models. Bioinformatics, 19:1572–1574
Rudolf V. H. W., Rasmussen N. L., Dibble C. J., Van Allen B.G. 2014. Resolving the roles of body size and species identity in driving functional diversity. Proc R Soc B Biol Sci, 281:20133203–20133203
Sodhi N. S., Bickford D., Diesmos A. C., Lee T. M., Koh L. P.,Brook B. W., Sekercioglu C. H., Bradshaw C. J. A. 2008.Measuring the meltdown: drivers of global amphibian extinction and decline. PLoS ONE, 3: e1636
Stamatakis A. 2006. RAxML-VI-HPC: Maximum likelihood-based phylogenetic analyses with thousands of taxa and mixed models.Bioinformatics, 22: 2688–2690
Tamura K., Stecher G., Peterson D., Filipski A., Kumar S. 2013.MEGA6: Molecular evolutionary genetics analysis version 6.0.Mol Biol Evol, 30: 2725–2729
Trochet A., Moulherat S., Calvez O., Stevens V., Clobert J.,Schmeller D. 2014. A database of life-history traits of European amphibians. Biodivers Data J, 2: e4123
Tsianou M. A., Kallimanis A. S. 2016. Different species traits produce diverse spatial functional diversity patterns of amphibians. Biodivers Conserv, 25: 117–132
Villéger S., Mason N. W. H., Mouillot D. 2008. New multidimensional functional diversity indices for a multifaced framework in functional ecology. Ecology, 89: 2290–2301
Villéger S., Miranda J. R., Hernández D. F., Mouillot D. 2010.Contrasting changes in taxonomic vs. functional diversity of tropical fish communities after habitat degradation. Ecol Appl,20: 1512–1522
Webb C. O., Ackerly D. D., McPeek M. A., Donoghue M. J.2002. Phylogenies and community ecology. Annu Rev Ecol Syst,33: 475–505
Williams S. E., Hero J. M. 1998. Rainforest frogs of the Australian Wet Tropics: Guild classification and the ecological similarity of declining species. Proc R Soc B Biol Sci, 265: 597–602
Winter M., Devictor V., Schweiger O. 2013. Phylogenetic diversity and nature conservation: where are we? Trends Ecol Evol, 28: 199–204
杂志排行

Asian Herpetological Research的其它文章
- Effects of Increased Salinity on Growth, Development and Survival in Early Life Stages of the Green Toad Bufotes variabilis (Anura:Bufonidae)
- Sexual Dimorphism, Female Reproductive Characteristics and Egg Incubation in an Oviparous Forest Skink (Sphenomorphus incognitus) from South China
- A Rapid, Non-invasive Method for Anatomical Observations of Tadpole Vertebrae in Vivo
- Three New Ranidae Mitogenomes and the Evolution of Mitochondrial Gene Rearrangements among Ranidae Species
- A New Species of Gracixalus (Anura: Rhacophoridae) from West Guangxi, China
- A New Species of the Genus Sinomicrurus Slowinski, Boundy and Lawson, 2001 (Squamata: Elapidae) from Hainan Province, China