Performance of a small AT-TPC prototype
2018-06-27JinYanXuQiTeLiYanLinYeJianGaoJiaXingHanShiWeiBaiKaHouNg
Jin-Yan Xu•Qi-Te Li•Yan-Lin Ye•Jian Gao•Jia-Xing Han•Shi-Wei Bai•Ka-Hou Ng
1 Introduction
For decades,gas-type detectors have been widely used to detect particles produced in experiments in nuclear and particle physics research,typical examples of which are the multiwire proportional chamber[1–3],resistive plate chamber[4–6],and drift chamber(DC)[7].Invented by David R.Nygren,the time projection chamber(TPC)is a new type of DC with excellent imaging capability[8].It provides good space-time resolution,high detection efficiency,and 4π solid-angle coverage.The TPC has been widely used for many years in high-energy physics experiments[9–12],and it has also gradually been applied with some relevant modifications,in low-energy nuclear physics experiments[13–15].
With recent progress in the production of radioactive beams,nuclear physics is expanding into a much larger area of the nuclear chart.New phenomena have been explored using nuclear reaction tools,such as resonant scattering,transfer reactions,Coulomb excitation,and the breakup reaction[16–18].Because the beam intensity is usually low for radioactive projectiles,the active target TPC(AT-TPC)has been developed to take advantage of a relatively thick target and full coverage of the detector solid angle[19,20].However,combining the target and the detector and dealing with a broad dynamic range of particle energies would require careful design and substantial new test studies.Considering the need to study the cluster structure in unstable nuclei[18],we are developing a small AT-TPC.Its initial design and performance are presented in this article.
2 Design and construction
2.1 Mechanical structure and readout GEM foils
The TPC is essentially a gas-type particle detector.When a charged particle passes through the gas- filled vessel,the deposited energy causes ionization of gas molecules along the particle track.An electric field generated by the exterior electrodes would drive the electrons(ions)to drift toward the electrodes.The drift time can be measured to determine the distance between the trackcrossing position(Z position)and the arrival electrode.On the other hand,the electron arrival position on the electrode(X–Y position)may be determined by a two-dimensional readout circuit.Therefore,the TPC serves as a three-dimensional imaging system to measure the particle track.The performance of a TPC depends on the distribution of the electric field in the vessel,the properties of the gas flow,the signal amplification and readout techniques,and so on.

Fig.1 Schematic view of the present small AT-TPC.To be transparent,only the copper strips(potential strips)on the inner surfaces of the vertical cage boards are shown,and the cathode electrode board at the top of the cage is ignored
The present AT-TPC is a simplified two-dimensional prototype that consists of a gas vessel,a field cage,and an end-cap readout detector,together with the associated electronics.This small AT-TPC is schematically illustrated in Fig.1.The volume of the field cage is 14 cm×14 cm×14 cm.The cage is surrounded by four printed circuit boards(PCBs),each having 14 copper strips(potential strips)on its inside face,and is installed between the cathode plate at the top and the readout board at the bottom.The size of the drift field is 14 cm,but the readout area is only 10 cm×10 cm,as determined by the size of the gas electron multiplier(GEM)foil[21].The TPC based on GEM readout is a new type of tracking detector that possesses good position resolution and a fast timing response.The presently adopted GEM is 50 μm in thickness and consists of a dielectric clad on both sides of a thin layer of copper.The copper layer was photolithographically etched on both sides,and a high-density array of holes was created.When a voltage of 300 to 400 V is applied to the copper layer,the electrons generated in the field cage can be amplified by two to three orders of magnitude.In the actual application,we applied two or three layers of the GEM foil,from which a gain of~105can be achieved for electron multiplication.The electrons from the GEM layer are collected by 64 copper readout strips(1 mm in width and spaced 0.562 mm apart)printed on a PCB.The method by which a high voltage(HV)is applied to the field cage and the GEM layers is demonstrated in Fig.2.Inside the field cage,the electric potential is stepped down along the drift direction by a series of resistors.A bias voltage is also applied to the GEM amplifiers using a custom-made circuit(Fig.2).The distance between adjacent GEM foils is 3 mm.The lower GEM foil is also 3 mm from the readout board.A guard ring made of copper strips with a width of 15 mm was designed and fixed between the field cage and the upper GEM layer(Fig.2).Its performance will be described below.
To facilitate quantitative studies of the TPC performance,we define a coordinate system with the Z axis along the direction of electron drift in the cage(perpendicular to the GEM layer)and the X axis in the GEM plane but perpendicular to the readout strips(Fig.2).The Z=0 position is fixed at the surface of the upper GEM foil.
2.2 Working gas mixture
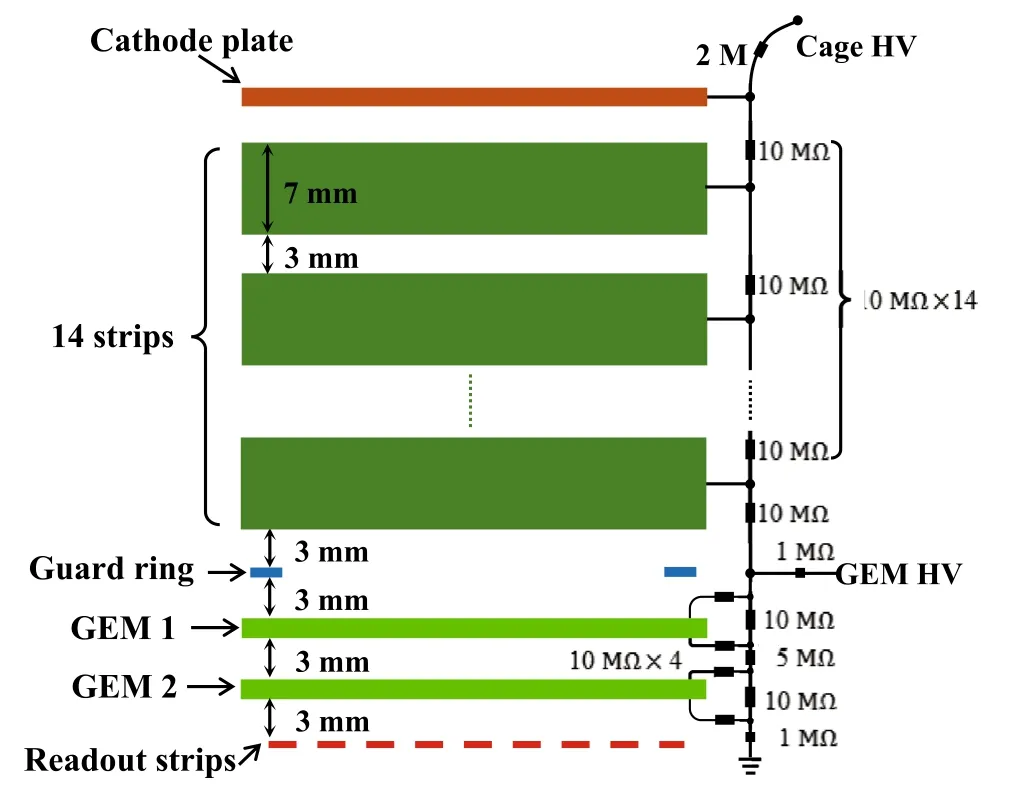
Fig.2 HV circuit for the field cage and GEM foils.The guard ring is employed to improve the field uniformity(see the text)
The working gas of a typical TPC prototype should have properties such as a low dielectric strength,small diffusion coefficient,and fast drift velocity.Some gases such as Ar,CH4,CO2,and CF4and their mixtures have been widely tested experimentally.However,for an AT-TPC,the working gas must also serve as the target material,the choice of which is very limited.In our design,which aims at detection of the cluster fragments(most likely α particles)from the decay of a resonance state in a mother nucleus,helium gas would be the best choice for the main gas component.In addition,a mixture of 4%CO2gas was also adopted on the basis of literature reports[22]and our own tests.The latter helps to stabilize the gain of the working gas.
2.3 Field cage
The main frame of the field cage is a cube with a side length of 14 cm.The cage is fixed by PCBs having high mechanical strength.The drift field is established by an electrode board at the top of the cage and a series of potential strips located inside the upright boards(Fig.1).The actual electric field is usually distorted near the edge of the field cage owing to the finite range of the electrode and the strips,which may degrade the time-position resolution of the TPC.To investigate possible improvement of the field uniformity,we performed simulation calculations based on the Gar field code[23].The electrodes,strips,and resistors between the strips were specified in the code according to the parameters of the real setup(Fig.2).Methods of tuning the field uniformity include the application of mirror strips or a guard ring[12,24].In the present work,the latter method is employed.The ring is located 3.0 mm above the first GEM foil,as can be seen in Fig.2.HVs of-2700 and-880 V are assumed at the cathode and the GEM foil,respectively.The guard ring is not connected to the resistor chain,and its HV is supplied independently.The electric field intensity distributions in a plane parallel to the GEM foil are plotted in Fig.3.As an example,the Z position of this plane is chosen to be 6.5 mm.The voltage applied to the guard ring is varied and is labeled in the figure.It can be seen that the field intensity at the edge of the cage changes quite sensitively with the guard-ring voltage.The most uniform field intensity can be obtained for a voltage of 900 V on the guard ring.
3 Test results and discussion
3.1 Experimental setup

Fig.3 Example to illustrate the effect of the guard ring.The electric field intensities(Ez)in a plane parallel to and 0.65 cm above the upper GEM foil are plotted as a function of the in-plane X coordinates for the entire cage size from-20 to+120 mm.The voltage written above each spectrum is the HV applied to the guard ring

Fig.4 Diagram of the experimental setup and signal processing circuit
A diagram of the experimental setup and signal processing circuit is presented in Fig.4.The small AT-TPC prototype described above was installed in a sealed chamber.A gas flow composed of helium and CO2(96:4)was supplied to the chamber at an inside gas pressure of 800 mbar.An241Am radioactive source(α,5.49 MeV)was placed on one side of the cage.A small home-made gas detector was placed on the opposite side of the cage to detect the α particles and to trigger the data acquisition system(DAQ).A collimation hole(2 mm in diameter and approximately 70 mm above the GEM foil)was made in front of the detector.HVs of-2700 and-880 V were applied to the cathode board and GEM foil,respectively,as in the simulation calculation.
The PKU preamplifier is a type of charge-sensitive preamplifier designed in the subatomic particle detection laboratory at Peking University.It has been successfully used in several nuclear physics experiments[25,26].Figure 5a shows the signals read out from some of the TPC strips(nos.14,15,and 16)and amplified by the PKU preamplifiers.The small home-made gas detector is a proportional counter.In another test experiment,two detectors of this type were located at a fixed distance,and their output was collected by VT120 preamplifiers.Figure 5b shows the signals produced by an α particle traversing these two detectors.The time resolution of these detector-preamplifier combinations will be investigated below.
3.2 Observed tracks

Fig.5 Top:Signals read out from TPC strips(nos.14,15,and 16)and amplified by PKU preamplifiers.Bottom:signals detected by two home-made gas detectors and sent to VT120 preamplifiers for an α particle traversing both detectors
The measured Z position of a track is deduced from the drift time of the ionized electrons,which is measured as the time difference between a start signal from the small αparticle detector and some associated stop signals from the readout strips(Fig.4).Distance/time calibration was realized by making a series of small collimation holes on the cage along the vertical(Z)direction and on the opposite side of the radiation source.The observed tracks with some measured timing separations therefore correspond to the hole separation distances,resulting in a distance/time calibration factor of 8.3 mm/μs under the optimal condition.Figure 6 shows one of the measured track positions in the Z direction.It can be seen that the initial track positions are biased near the edges of the field cage(Fig.6,solid squares).This should be attributed to the field distortion in those areas,as already demonstrated by the simulation calculations.This track shift problem may be solved to a large extent by applying a voltage to the guard ring.The best result can be obtained by using a voltage of-950 V,as shown in Fig.6 by the solid circles.Figure 7 shows the charges collected[analog-to-digital converter(ADC)values]by the readout strips during the passage of an α particle in the cage.It also reflects the distortion of the initial electric field and the effect of field correction by the guardring voltage.It is evident that a guard ring with an appropriate voltage can improve the performance of the AT-TPC.These observed timing and charge collection effects are confirmed by the corresponding simulations.
It is worth noting that the best guard-ring voltage(-950 V)deviates slightly from that used in the simulation(-900 V).The reason is the additional resistors used at the input/output ends of the real HV circuit,which may share some HVs.
3.3 Overall performance of the small AT-TPC prototype

Fig.6 Measured tracks of α particles in the X–Z plane,where solid squares and solid circles correspond to guard-ring voltages of 0 and-950 V,respectively

Fig.7 Quantity of electric charge(ADC value)collected by the readout strips
The performance of the present small AT-TPC prototype modified with a guard ring was studied using the experimental setup described above.The spatial resolution along the Z axis was deduced from 100 α particle tracks.Each track was fitted by a straight-line function.For the ith readout strip(i=1–64),a residual value,can be defined to represent the deviation between the straight-line Z position ZFand the detected Z position ZDof each track[27].For 100 tracks,the residual Rifollows an approximately Gaussian distribution.The residual Ridistributions of three typical strips(strip nos.1,32,and 64)with Gaussian function fittings are displayed in Fig.8.The associated standard deviation σiis a good indicator of the spatial resolution along the Z axis[27].The obtained σifor all the strips is plotted in Fig.9 and varies from 0.06 to 0.17 mm,indicating excellent position resolution along the Z direction.According to the calibration factor indicated above,the corresponding time resolution is 7–20 ns,depending on the readout strip.Of course,this resolution reflects the combined effects of the electron drift time fluctuation,the readout detector(including the GEM foil and the strip)resolution,the preamplifier properties,and so on.
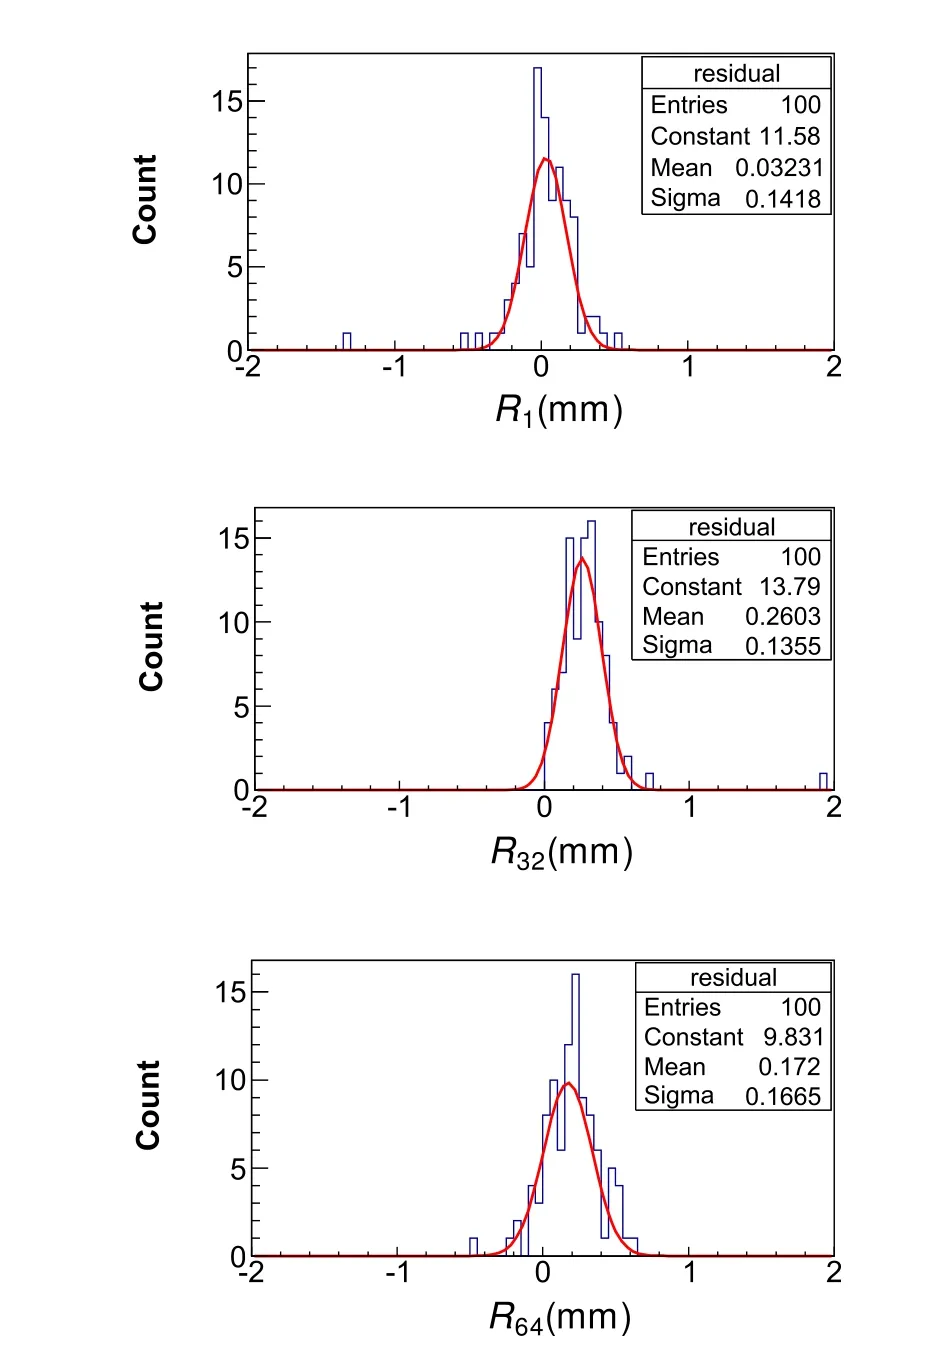
Fig.8 Residual Ridistributions for three typical strips(strip nos.1,32,and 64)together with the Gaussian function fits
The uncertainty of the X position caused by the readout strips can be deduced as σx=1.56(mm)/sqrt(12)=0.45(mm)[28,29],where 1.56 mm is the spatial coverage of one strip.
To estimate the energy resolution,the energies deposited along the track were calculated by the standard LISE code[30]and were used to calibrate the ADC values strip by strip.The measured energies are presented in Fig.10 for 100 tracks.For the first strip,the extracted energy resolution(σ)is approximately 3.6 keV at an average deposited energy of approximately 18 keV.For the last strip,these values are 4.0 and 21 keV,respectively.Using the present setup of the small AT-TPC,we were able to observe real images of α+ α elastic scattering events,one of which is displayed in Fig.11.
4 Conclusion
A small AT-TPC was designed and implemented.Its performance was greatly improved by inserting a guard ring just above the first GEM foil.The behavior of this guard ring was systematically studied by simulation calculations and also by experimental tests.A time resolution of less than 20 ns and a spatial resolution(standard deviation)of less than 0.2 mm along the Z direction were obtained.The uncertainty of the X position,which depends on the readout strip width,was deduced to be approximately 0.45 mm.An energy resolution(σ)of 3.6–4.0 keV can be achieved for deposited energies of 18–21 keV,respectively,as determined from each strip.Thanks to all of these good performance parameters,images of α+ α elastic scattering can be clearly observed.It was demonstrated that the present technology meets the requirements for experimental investigation of cluster decay from some nuclear resonant states.The present work focused on a two dimensional demonstration,but the AT-TPC could easily be extended to a three-dimensional detector by using just the pixel-type readout board.

Fig.9 Spatial resolution along the Z axis
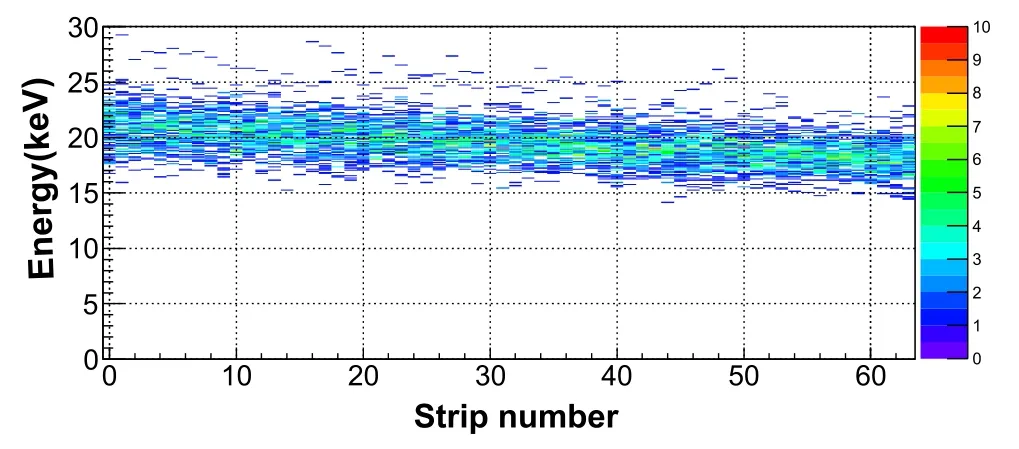
Fig.10 Measured energy deposition for 100 α particle tracks

Fig.11 Example of α–α elastic scattering
1.G.Charpak,R.Bouclier,T.Bressani et al.,Some read-out system for proportional multiwire chambers.Nucl.Instrum.Methods 65,217–220(1968).https://doi.org/10.1016/0029-554X(68)90568-5
2.Y.L.Ye,Z.Y.Di,Z.H.Li et al.,Study and application of low pressure multi-wire proportionalchambers.Nucl.Instrum.Methods A 515,718–724(2003).https://doi.org/10.1016/j.nima.2003.08.113
3.L.Y.Han,Q.T.Li,Q.Faisal et al.,Study of a multi-wire proportional chamber with a cathode strip and delay-line readout.Chin.Phys.C 33,364–368(2009).https://doi.org/10.1088/1674-1137/33/5/009
4.P.Fonte,Applications and new developments in resistive plate chambers.IEEE Trans.Nucl.Sci.49,881–887(2002).https://doi.org/10.1109/TNS.2002.1039583
5.J.Ying,Y.L.Ye,Y.Ban et al.,Beam test results of a resistive plate chamber made of Chinese bakelites.Nucl.Instrum.Methods A 459,513–522 (2001).https://doi.org/10.1016/S0168-9002(00)01046-9
6.Q.T.Li,Y.L.Ye,C.Wen et al.,Study of spatial resolution properties of a glass RPC.Nucl.Instrum.Methods 663,22–25(2012).https://doi.org/10.1016/j.nima.2011.10.006
7.W.Blum,L.Rolandi,Particle Detection with Drift Chambers(Springer,Berlin,1994),p.120.(Second printing)
8.J.N.Marx,D.R.Nygren,The time projection chamber.Phys.Today 31,46–53(1978).https://doi.org/10.1063/1.2994775
9.C.Brand,G.Cairanti,P.Charpentier et al.,The DELPHI time projection chamber.Nucl.Instrum.Methods A 283,567–572(1989).https://doi.org/10.1016/0168-9002(89)91417-4
10.M.Anderson,F.Bieser,R.Bossingham et al.,The STAR time projection chamber:a unique tool for studying high multiplicity events at RHIC.Nucl.Instrum.Methods A 499,659–678(2003).https://doi.org/10.1016/S0168-9002(02)01964-2
11.J.Bachler,J.Bracinik,H.G.Fischer et al.,Development of a TPC detector for the ALICE experiment.Nucl.Instrum.Methods A 419, 511–514 (1998). https://doi.org/10.1016/S0168-9002(98)00858-4
12.B.J.Zheng,Y.L.Li,Z.Y.Deng et al.,Drift field improvement and test in a GEM-TPC prototype.Chin.Phys.C 35,56–60(2011).https://doi.org/10.1088/1674-1137/35/1/012
13.G.D.Alkhazov,M.N.Andronenko,A.V.Dobrovolsky et al.,Nuclear matter distributions in6He and8He from small angle p-He scattering in inverse kinematics at intermediate energy.Phys.Rev.Lett.78,2313–2316(1997).https://doi.org/10.1103/PhysRevLett.78.2313
14.B.Blank,L.Hay,J.Huikari et al.,A time projection chamber for the three-dimensional reconstruction of two-proton radioactivity events.Nucl.Instrum.Methods A 613,65–78(2010).https://doi.org/10.1016/j.nima.2009.10.140
15.A.Fritsch,T.Suzuki,A.Tamii et al.,High-resolution study of Gamow–Teller transitions in the48Ti(3He,t)48V reaction.Phys.Rev.C 93,064326(2016).https://doi.org/10.1103/Phys RevC.93.064326
16.Z.X.Cao,Y.L.Ye,Study of the structure of unstable nuclei through the reaction experiments.Sci.China Phys.Mech.Astron.54(Suppl.1),1–5 (2011).https://doi.org/10.1007/s11433-011-4423-9
17.Z.H.Yang,Y.L.Ye,Z.H.Li et al.,Observation of enhanced monopole strength and clustering in12Be.Phys.Rev.Lett.112,162501(2014).https://doi.org/10.1103/PhysRevLett.112.162501
18.J.Chen,J.L.Lou,Y.L.Ye et al.,Elastic scattering and breakup of11Be on deuterons at 26.9 A MeV.Phys.Rev.C 93,064620(2016).https://doi.org/10.1103/PhysRevC.94.064620
19.M.Caamano,W.Mittig,H.Savajols et al.,Resonance state in7H.Phys.Rev.Lett.99,062502(2007).https://doi.org/10.1103/PhysRevLett.99.062502
20.S.Bailey,M.Freer,S.Cruz et al.,Energy levels of18F from the14N+α resonant reaction.Phys.Rev.C 90,024302(2014).https://doi.org/10.1103/PhysRevC.90.024302
21.F.Sauli,New observations with the gas electron multiplier(GEM).Nucl.Instrum.Methods A 396,50–66(1997).https://doi.org/10.1016/S0168-9002(97)00648-7
22.T.Furuno,T.Kawabata,S.Adachi et al.,Development of MAIKo:the active target with μ-PIC for RI beam experiments.J.Phys.Conf.Ser.569,012042(2014).https://doi.org/10.1088/1742-6596/569/1/012042
23.http://cern.ch/gar field.Accessed 10 Nov 2017
24.D.Suzuki,M.Ford,D.Basin et al.,Prototype AT-TPC:toward a new generation active target time projection chamber for radioactive beam experiments.Nucl.Instrum.Methods A 691,39–54(2012).https://doi.org/10.1016/j.nima.2012.06.050
25.Z.X.Cao,Y.L.Ye,J.Xiao et al.,Recoil proton tagged knockout reaction for8He.J.Phys.Conf.Ser.436,012048(2013).https://doi.org/10.1088/1742-6596/436/1/012048
26.W.Jiang,Y.L.Ye,Z.H.Li et al.,High-lying excited states in 10Be from the 9Be(9Be,10Be)8Be reaction.Sci.China PMA 60,062011(2017).https://doi.org/10.1007/s11433-017-9023-x
27.H.B.You,Z.H.Yang,Y.L.Ye et al.,Construction and calibration of the multi-neutron correlation spectrometer at Peking University.Nucl.Instrum.Methods A 728,47–52(2013).https://doi.org/10.1016/j.nima.2013.06.037
28.B.J.Zheng,The Simulation Study and Improvement of the Drift Field in TPC Detector(Tsinghua University,Beijing,2010).(in Chinese)
29.X.Y.Lu,Study of 2-D X-rays Position-Sensitive Detectors Made of GEM(Institute of High Energy Physics Chinese Academy of Sciences,Beijing,2012).(in Chinese)
30.http://lise.nscl.msu.edu.Accessed 20 Sept 2017
杂志排行

Nuclear Science and Techniques的其它文章
- Gamma irradiation-induced effects on the properties of TiO2 on fluorine-doped tin oxide prepared by atomic layer deposition
- Preliminary analysis of tritium fuel cycle in Z-pinch-driven fusion– fission hybrid reactor
- Investigation of high-temperature-resistant rhenium–boron neutron shields by experimental studies and Monte Carlo simulations
- Monte Carlo simulation of incident electrons passing through thin metal layer
- Annual effective dose values from137Cs activity concentrations in soils of Manisa,Turkey
- Investigation of SPECT/CT cardiac imaging using Geant4