Investigation of the Short-Time Photodissociation Dynamics of Furfural in S2 State by Resonance Raman and Quantum Chemistry Calculations
2018-06-01KemeiPeiYuebenDongandLeiChen
Kemei Pei , Yueben Dong and Lei Chen
1 Introduction
Furfural (furfuraldehyde, C4H3OCHO), is an aromatic aldehyde with the cyclic structure shown in Fig. 1, and this substance is an important environmental pollutants, in natural environment they are very resistant to decay and decompose [Liu, Knopp, Qin et al.(2015); Liu, Knopp and Gerber (2015)]. This compound is used as an excellent solvent for extractive refining of lubricating oils, as it is very effective in removing compounds containing oxygen or sulfur. Therefore the release of furfural from petrochemical industries, oil refineries, oil processing and chemical plants into the environment has been considered as a major source of air and water pollution. The separation or degradation of furfural is an important field of study for the sake of industrial safety and environmental protection [Motiyenko, Alekseev and Dyubko (2007); Borghei and Hosseini (2008); Bataev, Pupyshev and Godunov (2016)]. Lots of works have been performed for photocatalytic degradation of furfural in aqueous phase. Titanium dioxide nanoparticles (as photocatalyst) were immobilized on a porous and low-density support called "perlite" using a very simple and inexpensive method. TiO2-coated perlite granules were used in a “floating-bed photo-reactor” to study the photoc catalytic purification process of a typical wastewater polluted by furfural [Faramarzpour, Vossoughi and Borghei (2009); Fu, Huang, Ren et al. (2017); Fu, Wu, Wang et al. (2017)]. NiS-clinoptilolite zeolite is used as a catalyst for photodegradation of furfural in aqueous solution under UV irradiation. The degradation process is monitored during the experimental runs by UV/Visible absorption, COD and TOC concentration determination and HPLC methods. The effect of key operating parameters such as catalyst dosage, initial concentration of furfural, initial pH of the solutions and effect of the presence of hydrogen peroxide and potassium bromate is studied on the degradation efficiency [Alireza and Solmaz (2011)]. Furfural in aqueous solution was treated by UV/O3method. The results show that the removal rate of furfural is severely enhanced and the synergism phenomenon appears when ultraviolet and ozone are present together. The influences of experimental parameters such as pH, the intensity of light and the negative-positive ions on furfural degradation were investigated. The results indicate that furfural (300 mg/L) is almost completely degraded after 3 h under the optimum conditions. The intermediate in the furfural degradation was characterized by GC-MS and IR spectrum and the degradation mechanism of furfural by UV/O3technology was proposed. Commercial grade activated carbon (ACC) was used for adsorptive removal of furfural from aqueous solution using batch studies. In the present study, continuous fixed-bed adsorption was carried out in ACC packed bed for the removal of furfural from aqueous solution. The effects of important factors namely bed height (Z=15-60 cm), influent concentration of furfural (C0=50-200 mg/L), the flow rate(Q=0.02-0.04 L/min) and column diameter (D=2-4 cm) were studied. Capacity of the bed to adsorb furfural was found to increase with an increase in the value of Z, C or D, and with decrease in the value of Q. Adams Bohart, Bed-Depth Service-Time, Thomas,Yoon-Nelson, Clark and Wolborska models were applied to the experimental data for the prediction of the breakthrough point, and to determine the characteristic parameters of the column. Error analysis showed that the Yoon-Nelson model best described the experimental breakthrough curve, while Wolborska model showed a good prediction of breakthrough curve for the relative concentration region up to 0.5 [Singh, Srivastava and Mall (2009)].

Figure 1: Structure and atom labeling scheme of furfural
But in fact, when furfural is released to water or air, it will be exposed in the sunlight, and photochemical reactions may happen before other chemical processes. Consequently,photodegradation and phototransformation may result from the direct photo excitation by sunlight. Since the natural environment is very complex, many works about photochemistry of furfural in different conditions (different pH, ions, organic compounds, etc.) should be received lots of attention for its importance in the environment [Macounová, Krýsová,Ludví et al. (2003); Giacomazzi and Cochet (2004)]. For furfural has strong UV absorption in UV-B region (about 280.0 nm),in this work, resonance Raman (RR) spectra and quantum chemical calculations were used to investigate the photodissociation dynamics of furfural in S2state which corresponds to the strong absorption of furfural in UV absorption.
Transformation of furfural from the direct photoexcitation of the substrate by sunlight or artificial light of shorter wavelengths is important degradation way in aquatic and atmospheric environments, and previous studies are concentrated on the purification analysis or photocatalytic degradation photoproducts analysis. Direct photolysis has not been performed. In contrast with the ultrafast electronic spectra, the vibrational spectroscopies such as resonance Raman spectroscopy and infrared absorption generally reveal detailed information about molecular and electronic structure as well as photo short-time dynamics in excited states. Few studies have been carried out for furfural on Franck-Condon region short time dynamic analysis and conical intersection of different potential energy surfaces which often play an important role in the photodissociation dynamics [Pei, Su, Chen et al. (2012); Gorski, Starukhin, Stavrov et al. (2017)].
Fourier transform Raman (FT-Raman) and Fourier transform infrared (FT-IR) are suitable for determining the ground molecular conformation, while resonance and near resonance Raman might produce valuable information on structural and other important properties of molecules in excited states [Yang, Ma, Ma et al. (2017); Selvakumar,Pradhan, Krupanidhi et al. (2016)]. Complete active space self-consistent field (CASSCF)method and time-dependent density functional theory (TD DFT) are powerful theoretical methods to investigate excited states. In this paper, resonance Raman spectra analysis and quantum chemical calculations (CASSCF and TD DFT) are used to investigate the excited state photo-dissociation dynamics of furfural. These studies are expected to be helpful in understanding the photophysical and photochemical characteristics of furfural in the environment.
2 Experiment and calculations
The UV absorption spectrum of furfural was measured by a UV-2501 PC ultraviolet/visible spectrometer. FT-Raman and FT-IR spectra of furfural were obtained using a Thermo Nicolet FT-Raman 960 spectrometer and a Perkin-Elmer FT-IR spectrometer, respectively.The methods and experimental apparatus used for the resonance Raman experiments have been described elsewhere [Zheng and Phillips (1998)]. Herein, only a short description is given here. The harmonics of a nanosecond Nd: YAG laser and their hydrogen Raman shifted laser lines were used to generate the 266.0 nm, 273.9 nm and 282.7 nm excitation wavelengths employed in the resonance Raman experiments. A backscattering geometry was used for sample excitation and for collection of the Raman scattered light by reflective optics. The Raman scattered light through a polarizer and entrance slit of a 0.5 m spectrograph, and the grating of the spectrograph dispersed the light onto a liquid nitrogen cooled charge-coupled device (CCD) mounted on the exit of the spectrograph.The concentration of approximately 0.005 mol/L in aqueous solvent is used as the solution phase sample. The Raman shifts of the resonance Raman spectra were calibrated using the known vibrational frequencies of the solvent Raman bands. The solvent Raman bands were subtracted from the resonance Raman spectra using an appropriately scaled solvent spectrum.
Density functional theory was done to determine the ground optimized geometry,vibrational frequencies and the electronic transition energies and electronic transition orbitals for furfural. Vibration wavenumber was computed by using the B3LYP/6-311+G(d, p) theoretical level for the ground state, while the electronic transition energies and electronic transition orbitals were calculated using B3LYP TD/6-311+G (d, p) method.CASSCF method was used to obtain the equilibrium structure and energies of S0, S1, S2,T1and T2. States average method was used to localize the conical inter-section S2/S1. All quantum mechanical calculations were carried out in Gaussian 03 program [Frisch,Trucks, Schlegel et al. (2009)].
3 Results and discussion
3.1 Absorption spectra

Table 1: TD calculation results about electronic absorption band and oscillator strength (f)above 200.0 nm wavelength range
For furfural has trans and cis isomers, in this work, the most stable ground trans structure was used to discuss. The most stable structure was confirmed by the global minimum energy calculations at B3LYP/6-311+G (d, p) level. The trans molecular structure and atom labeling scheme of furfural shown in Fig. 1 has been optimized by ab initio and DFT theory. By allowing the relaxation of all the parameters, calculation has been found to converge to the optimized geometry, as revealed by the absence of imaginary values in the calculated wavenumbers of the vibrational modes. Fig. 2 presents the absorption spectrum of furfural in aqueous solution with the wavelengths for the resonance Raman experiments indicated above the spectrum. Tab. 1 lists the B3LYP-TD/6-311+G (d, p)computed electronic absorption bands, the corresponding electric transition orbitals, and the oscillator strengths for furfural. Tab. 1 shows that among the calculated electronic transitions above 200.0 nm optical region there are two transition-allowed absorption bands S0→S2at 255.5 nm and S0→S3at 217.5 nm with the oscillator strength of f=0.3605 and 0.1960 respectively. This is in good agreement with the intense experimental absorption bands at 276.0 nm and 224.0 nm with the experimental oscillator strength of f=0.52 and 0.16. Fig. 3 displays the three orbitals (24, 25 and 26) associated with electronic transition of S0→S1, S0→S2transitions. It shows that orbital 24 (HOMO-1) is n orbital with electron density being mainly delocalized on the C=O bond, 61 (HOMO, π)and 62 (LUMO, π*) is π orbital mainly delocalized on the whole molecule. According to the classic view, we assign this intense experimental 276.0 nm absorption band to the π(the whole molecule) →π* (the whole molecule) transition. 266.0 nm, 273.9 nm and 282.7 nm in our resonance Raman experiments are mostly on resonance with S0→S2transition.

Figure 2: Absorption spectrum of furfural in water with the wavelengths for the resonance Raman experiments indicated above the spectrum
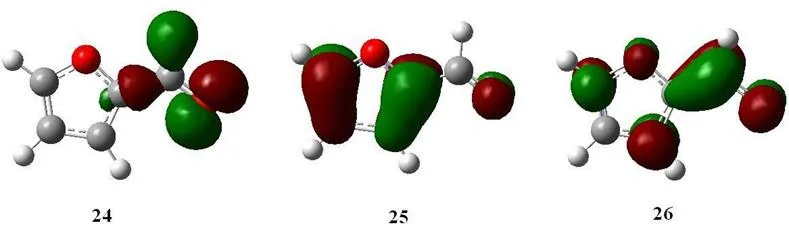
Figure 3: Transition orbitals correlated with S0→S1, S0→S2 excitation of furfural at B3LYP/6-311+G (d, p) level
3.2 Resonance Raman spectroscopy
Tab. 2 lists a comparison of the B3LYP/6-311+G (d, p) calculated vibrational frequencies with experimental resonance Raman, FT-Raman and FT-IR values. The notations and assignments of the vibrations are based on the visualization Gaussview3.0 software. The overall agreement between the linear scaled DFT calculated vibrational frequencies with scaled factor 0.96 and the experimental values is good for furfural [Kurté n, Berndt and Stratmann (2009)]. Fig. 4 presents an overview of the 266.0 nm, 273.9 nm and 282.7 nm resonance Raman spectra. The spectra shown in Fig. 4 have been corrected for sample reabsorption as well as the wavelength dependence response of the detection system.Solvent Raman bands were removed from the spectra by subtracting an appropriately scaled solvent spectrum. Fig. 5 shows vibrational assignments of the resonance Raman spectra of furfural in water obtained with the 273.9 nm excitation wavelengths. Fig. 4 only indicates the largest Raman band contributions to each Raman feature of the spectra since the intensity of some Raman bands in the spectrum may have contributions from several Raman bands which have very close Raman shifts due to the limited resolution of the solution phase spectra. Most of the resonance Raman features can be assigned to the fundamentals, overtones, and combination bands of the nine Franck-Condon active vibrational modes based on the information in Tab. 2: C=O stretch ν5(1667 cm-1), ring C2=C3 antisymmetric stretch ν6(1570 cm-1), ring C=C symmetric stretch ν7(1472 cm-1),C2-O6-C5 symmetric stretch/C1-H8 rock in plane ν8(1389 cm-1), C3-C4 stretch/C1-H8 rock in plane ν9(A’, 1370 cm-1), C5-O6 stretch in plane ν12(A’, 1154 cm-1), ring breath ν13(A’, 1077 cm-1), C3-C4 stretch ν14(A’, 1020 cm-1), C3-C2-O6 symmetric stretch ν16(A’,928 cm-1). The RRs suggest that all the vibrational modes are in plane, that is to say, S0→S2excitation do not change the point group symmetry. The RRs suggest that photoexcitation of furfural by ~280 nm UV light has a multidimensional character with nine motions. From comparison of the 266.0 nm, 273.9 nm and 282.7 nm RRs of furfural with FT-Raman in water, the most important difference is intensity change of ring C2-C3 antisymmetric stretch ν6in RRs. Compare the S0, S1and S2structure, it is obvious that the C2-C3 in S2is 1.4644 Å, which is much longer than that 1.4086 in S1and 1.3608 in S0. This phenomenon about ν9mode suggests that ν6stretch plays an important role in photodissociation dynamics of furfural in S2state.

Figure 4: An overview and vibrational assignments of the resonance Raman spectra of furfural in water obtained with the 266.0 nm, 273.9 nm and 282.7 nm excitation wavelengths. The asterisks [*] mark solvent subtraction artifacts
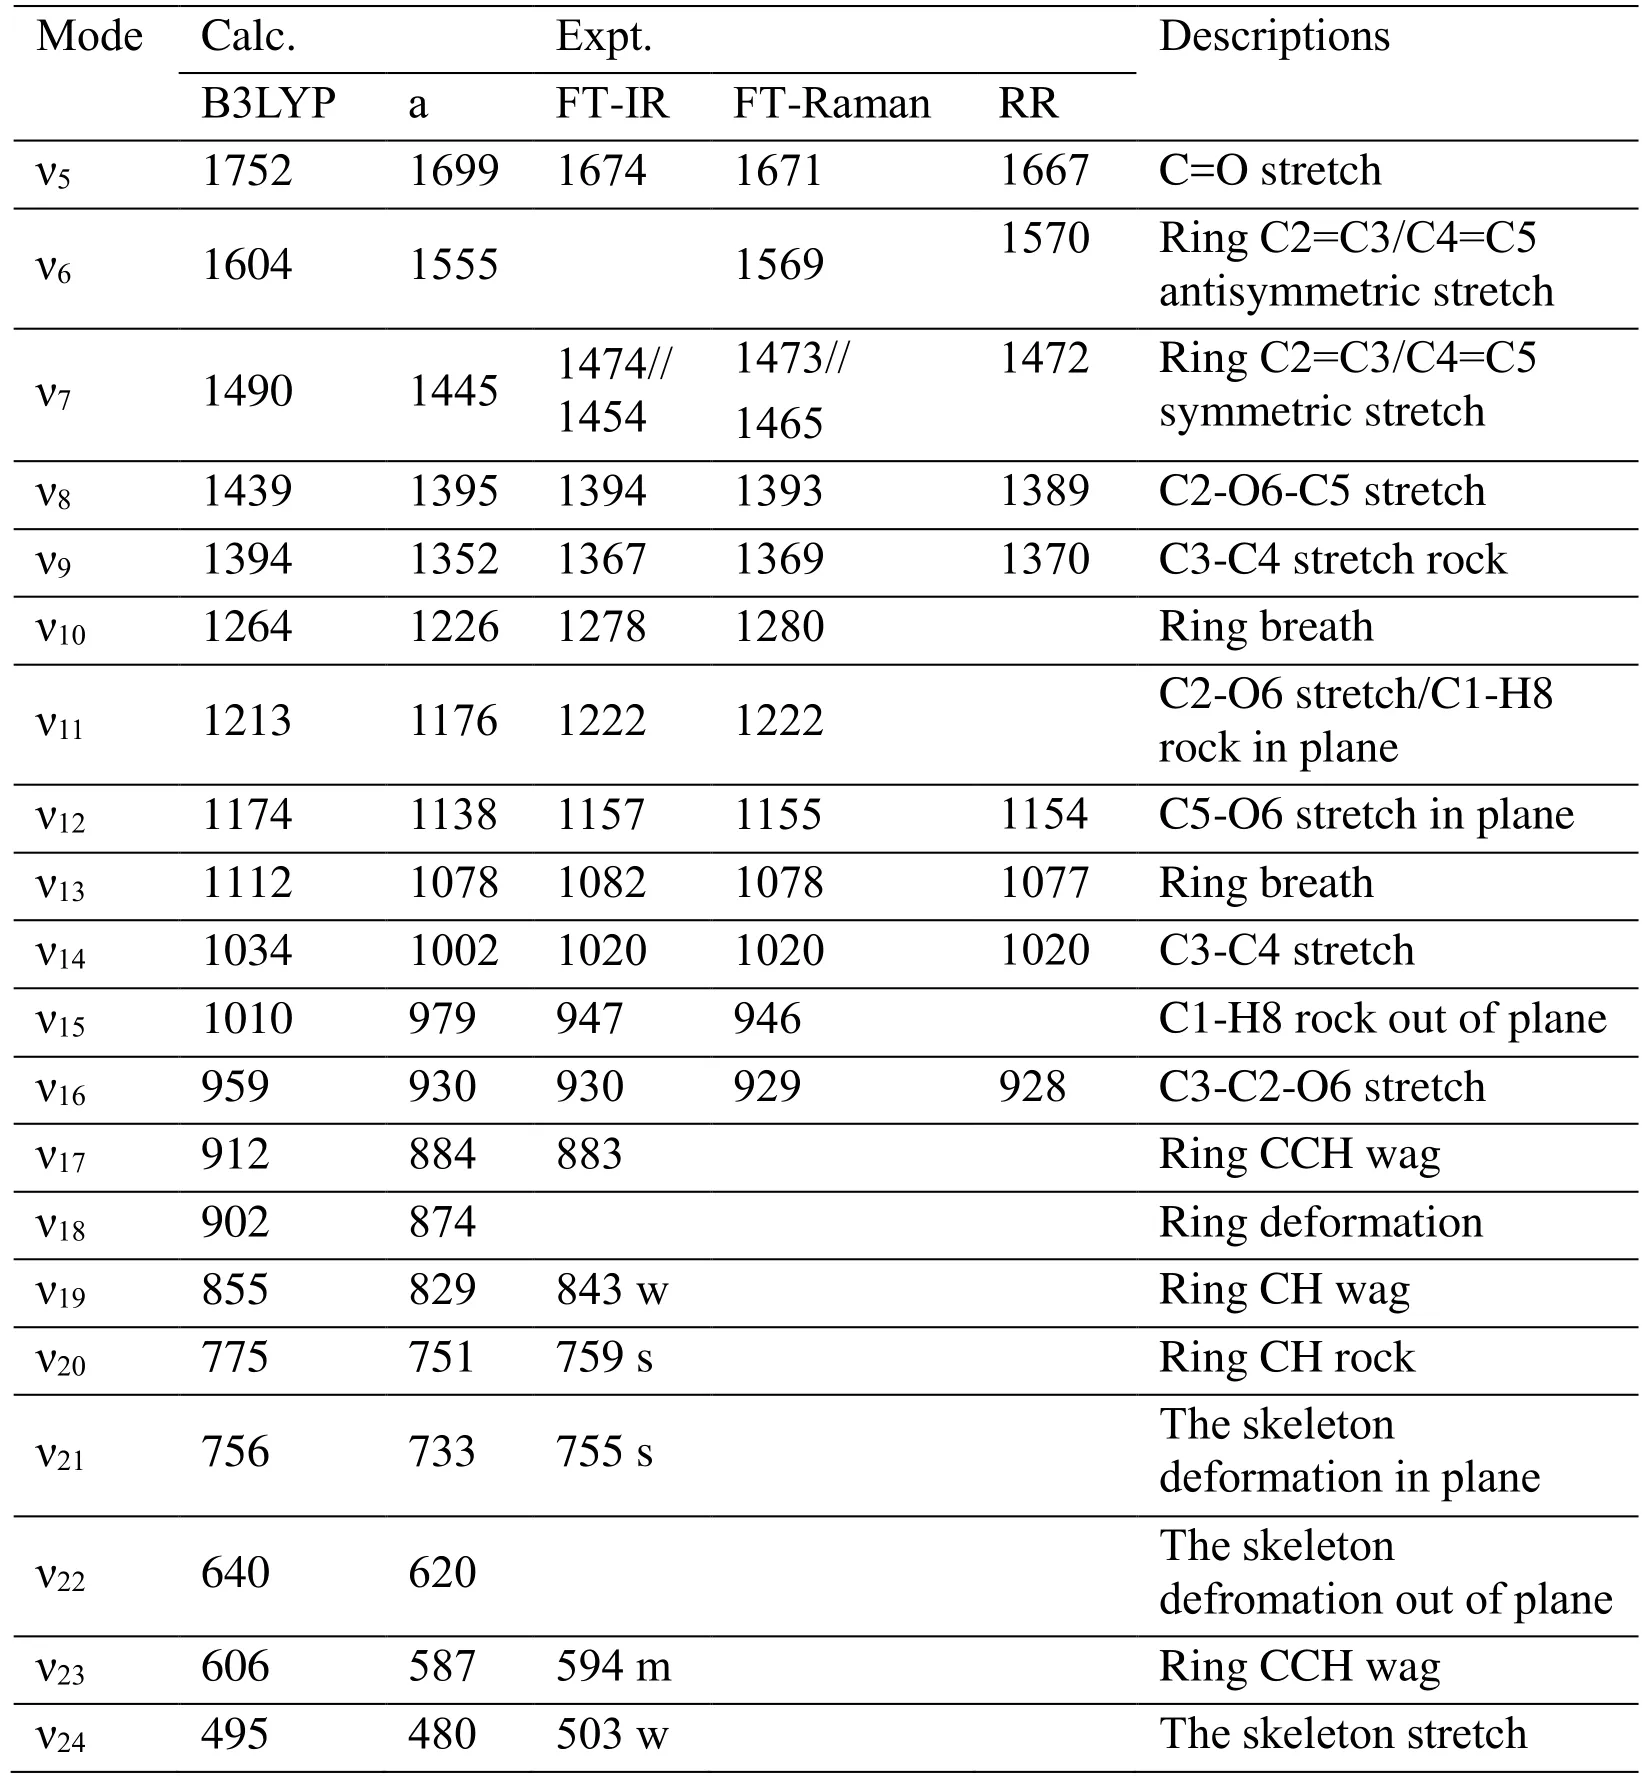
Table 2: Experimental and B3LYP/6-311+G (d, p) computed vibrational frequencies(cm-1) of furfural (abbreviated) (a: Scaled by 0.96)
It is obvious that ν13(ring C=C antisymmetric stretch), ν16(C3-C4 stretch/C1-H8 rock in plane), ν19(C5-O6 stretch in plane), ν23(C3-C2-O6 symmetric stretch) modes were excited effectively, herein, comparing with S0structure the changes of S2correlates the above four modes. Tab. 1 clearly shows that all the active modes in Frank-Condon region are planar and distribute on the whole skeleton. These active modes results shows that the S0→S2is π→π* transition. RR spectroscopy shows that ν9mode intensity changes significantly. To make sure the nature of this phenomenon about ν9mode, we carried out 228.7 nm RR spectroscopy experiment. The results indicates that in 228.7 nm RR spectroscopy ν9mode is very strong and almost dominant the whole RR spectroscopy. That is to say, the ν9mode intensity difference comes from the neighbor high states influence.
Table 3: Selected bond parameters of furfural at S0, S1, S2, T1, T2, S2/S1 states by CASSCF (10, 8)/cc-PVDZ calculations (in)
Table 3: Selected bond parameters of furfural at S0, S1, S2, T1, T2, S2/S1 states by CASSCF (10, 8)/cc-PVDZ calculations (in)
?
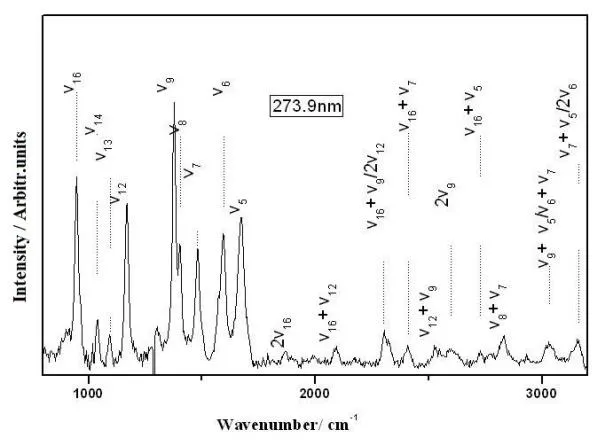
Figure 5: Vibrational assignments of the resonance Raman spectra of furfural in water obtained with the 273.9 nm excitation wavelengths. The asterisks [*] mark solvent subtraction artifacts
3.3 Equilibrium structures and energies of S0, S1, S2, T1, T2, S2/S1
Stationary structures for furfural in the five lowest electronic states (S0, S1, S2, T1, T2, S2/S1)have been fully optimized by means of CASSCF (10, 8)/cc-PVDZ method. To check the correctness of the CASSCF results, the B3LYP/6-311+G (d, p) calculations was used to determine the equilibrium structures of S0and T1states. All the stationary structures reported in present study at CASSCF (10, 8)/cc-PVDZ levels are available in Tab. 3. It is clear that the optimized S0structural parameters computed by CASSCF (10,8)/cc-PVDZ are very close to those obtained from B3LYP/6-311+G (d, p) computations, as Fig.6 shown. This suggests that our CASSCF (10, 8)/cc-PVDZ calculations is appropriate for the prediction of both the ground and the excited state structure of furfural. S1(1nπ*) and T2(3nπ*) of furfural come from the same orbitals (24, 26). The CASSCF results show that S1(1nπ*) and T2(3nπ*) of furfural have similar structures, as Tab. 3 shown. S2(1ππ*) and T1(3ππ*) of furfural come from the same orbital (25, 26). The CASSCF results show that S2(1nπ*) and T1(3nπ*) of furfural have similar structures, as Tab. 3 shown. The π→π*excitation of S2(1ππ*) is mainly localized on the aromatic ring, and the lengthening of the C-C bonds in the ring exhibits characteristics of a π→π* transition, where the aromatic ring attempts to reduce its π bonding character upon excitation. The energy values listed in Tab.4 are computed at CASSCF (10, 8)/cc-PVDZ level. The adiabatic excitation energies (EA)of S1, S2, T1and T2are 138.36, 163.96, 66.26 and 109.97 kcal/mol. The vertical excitation energies (EV) of S1, S2, T1and T2are 144.45 kcal/mol, 167.59 kcal/mol, 81.64 kcal/mol and 119.25 kcal/mol respectively. Meaningful result is found for the adiabatic excitation and vertical excitation energies of S1and T2are very close. The vertical excitation energy difference between S2and S1is significant with a value of 60.72 kcal/mol for furfural. The energy of S2/S1is 5.50 kcal/mol lower than S2and 20.10 kcal/mol higher than S1.
Table 4: The total energies (ET), adiabatic excitation energies (EA), and vertical excitation energies (EV) of S0, S1, S2, T1, T2, S2/S1 at CAS (10, 8)/cc-PVDZ calculation level
3.4 Photodissociation dynamics of furfural
As a general rule, the photochemistry reactions proceed mainly along the ground or lowest excited state pathway. Thus, the surface intersection point is an important point through which a molecule in upper electronically excited state can efficiently relax to lower state.In the Franck-Condon (FC) region, the S2and S1surface intersection (S2/S1) was optimized with the state-averaged CAS (10, 8)/CASSCF (10, 8)/cc-PVDZ computations and the points was confirmed by structural parameters and orbital analysis, as Tab. 3 shows.
It is very interesting to note that the C-O bond length of 1.3318 Å for S2/S1conical point is much longer than the corresponding 1.2044 Å for S0state, and this is very similar to the short-time dynamics results in aqueous solution that display very strong FC region dynamical motion along the C-O reaction coordinate of S2state from 266.0 nm, 273.9 nm and 282.7 nm RRs. Compare the S2optimized structure and S0, the C-O bond length is 1.20 Å and 1.24 Å, that is to say, C-O bond should not change much by S0to S2transition, but in 266.0 nm, 273.9 nm and 282.7 nm RRs it is clear that C-O vibration shows strong activity, we therefore expect that the molecule in FC region getting into the conical intersection point before to the S2state. This is the further analysis of the S2/S1, S0parameters and RR spectra.
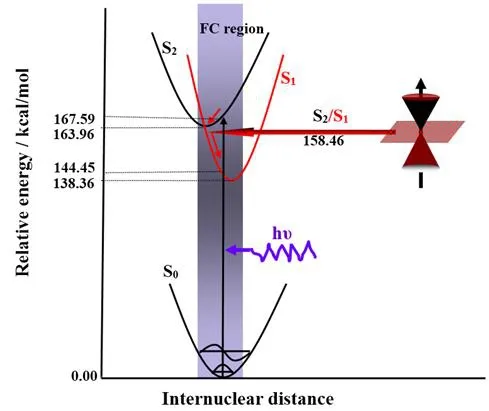
Figure 6: Photorelaxation mechanism of furfural in S2 state
We note that the structural differences between S2/S1conical point and S0minimum provide us important information on how far a conical point left away from FC region. As Tab. 3 shown, Tab. 3 shows the C1-C2 bond length of 1.3806 Å, the C1-O7 bond length of 1.3318 Å , the C2-C3 bond length of 1.5488 Å, the C2-O6 bond length of 1.2993 Å, and the C3-C4 bond length of 1.5483 Å for S2/S1conical point are, respectively, which changes much more than the corresponding 1.4684 Å, 1.2044 Å, and 1.3608 Å for S0state. Our short-time dynamics results in Tab. 2 show that the Franck-Condon region structural dynamics of furfural in S2excited state is mostly along C1-O7 stretch ν5(1667 cm-1), ring C=C antisymmetric stretch ν6(1570 cm-1), ring C=C symmetric stretch ν7(1472 cm-1),C2-O6-C5 symmetric stretch/C1-H8 rock in plane ν8(1389 cm-1), C3-C4 stretch/C1-H8 rock in plane ν9(1370 cm-1), C5-O6 stretch in plane ν12(1154 cm-1), C3-C2-O6 symmetric stretch ν16(928 cm-1), correlates to the bond changes of S2/S1conical point. We therefore expect that the molecule in FC region getting into the conical intersection point before to the S2state, as Fig. 6 shown.
4 Conclusions
RR spectra of 266.0 nm, 273.9 nm and 282.7 nm excitation wavelengths were acquired for furfural in water solution. The RR spectra results indicates that the short-time S0→S2photorelaxation dynamics of furfural propanil have substantial multidimensional character mainly along C=O stretch ν5, ring C=C antisymmetric stretch ν6, ring C=C symmetric stretch ν7, C2-O6-C5 symmetric stretch/C1-H8 rock in plane ν8, C3-C4 stretch/C1-H8 rock in plane ν9, C5-O6 stretch in plane ν12, ring breath ν13, C3-C4 stretch ν14, C3-C2-O6 symmetric stretch ν16. Strong electron state coupling was found between S2and S1states,and the S2/S1conical intersection can be predicted in Franck-Condon region by theoretical and experimental analysis.
Acknowledgements:This work was supported in parts by National Natural Science Foundation of China (No. 21673208), Zhejiang Provincial Natural Science Foundation of China (No. LY16B070009).
Alireza, N. E.; Solmaz, M.(2011): Heterogeneous photocatalytic degradation of furfural using NiS-clinoptilolite zeolite. Desalination, vol. 273, no. 2, pp. 248-256.
Bataev, V. A.; Pupyshev, V. I.; Godunov, A.(2016): Two-dimensional character of internal rotation of furfural and other five-member heterocyclic aromatic aldehydes.Spectrochimica Acta Part A Molecular & Biomolecular Spectroscopy, vol. 161, pp.155-161.
Borghei, S. M.; Hosseini, S. N.(2008): Comparison of furfural degradation by different photooxidation methods. Chemical Engineering Journal, vol. 139, no. 3, pp. 482-488.
Faramarzpour, M.; Vossoughi, M.; Borghei, M.(2009): Photocatalytic degradation of furfural by titania nanoparticles in a floating-bed photoreactor. Chemical Engineering Journal, vol. 146, no. 1, pp. 79-85.
Frisch, M. J.; Trucks, G. W.; Schlegel, H. B.; Scuseria, G. E.; Robb, M. A. et al.(2009): Gaussian 09. Gaussian Inc., Wallingford CT.
Fu, Z.; Huang, F.; Ren, K.; Weng, J.; Wang, C.(2017): Privacy-preserving smart semantic search based on conceptual graphs over encrypted outsourced data. IEEE Transactions on Information Forensics & Security, vol. 12, no. 8, pp. 1874-1884.
Fu, Z.; Wu, X.; Wang, Q.; Ren, K.(2017): Enabling central keyword-based semantic extension search over encrypted outsourced data. IEEE Transactions on Information Forensics & Security, vol. 12, pp. 99-93.
Giacomazzi, S.; Cochet, N.(2004): Environmental impact of diuron transformation: A review. Chemosphere, vol. 56, no. 11, pp. 1021-1032.
Gorski, A.; Starukhin; A.; Stavrov, S.; Gawinkowski, S.; Waluk, J.(2017):Resonance Raman spectroscopy study of protonated porphyrin. Spectrochimica Acta Part A Molecular & Biomolecular Spectroscopy, vol. 173, pp. 350-355.
Kurtén, T.; Berndt, T.; Stratmann, F.(2009): Hydration increases the lifetime of HSO5and enhances its ability to act as a nucleation precursor-a computational study.Atmospheric Chemistry and Physics, vol. 9, pp. 3357-3369.
Liu, Y.; Knopp, G.; Gerber, T.(2015): Direct observation of up-conversion via femtosecond photoelectron imaging. Physical Review A, vol. 92, no. 4.
Liu, Y.; Knopp, G.; Qin, C.; Gerber, T.(2015): Tracking ultrafast relaxation dynamics of furan by femtosecond photoelectron imaging. Chemical Physics, vol. 446, pp. 142-147.
Macounová, K.; Krýsová, H.; LudvíK, J.; Jirkovský, J.(2003): Kinetics of photocatalytic degradation of diuron in aqueous colloidal solutions of Q-TiO2particles.Journal of Photochemistry & Photobiology A Chemistry, vol. 156, no. 1, pp. 273-282.
Motiyenko, R. A.; Alekseev, E. A.; Dyubko, S. F.(2007): Microwave spectroscopy of furfural in vibrationally excited states. Journal of Molecular Spectroscopy, vol. 244, no. 1,pp. 9-12.
Pei, K.; Su, M.; Chen, L.; Zheng, X.(2012): Excited-state structural dynamics of propanil in the S2state: Resonance raman and first-principle investigation. Journal of Physical Chemistry B, vol. 116, no. 27, pp. 7914-7919.
Selvakumar, N.; Pradhan, U.; Krupanidhi, S. B.; Barshilia, H. C.(2016): Structural and optical properties of graphene oxide prepared by modified hummers’ method.Computers, Materials & Continua, vol. 52, no. 3, pp. 175-185.
Singh, S.; Srivastava, V. C.; Mall, I. D.(2009): Fixed-bed study for adsorptive removal of furfural by activated carbon. Colloids and Surfaces A: Physicochemical & Engineering Aspects, vol. 332, no.1, pp. 50-56.
Yang, Z.; Ma, L.; Ma, Q.; Cui, J.; Nie, Y. et al.(2017): Molecule dynamics study on heat transfer at gas-nanoparticle interface. Computers, Materials & Continua, vol. 51, no.1, pp. 219-248.
Zheng, X. M.; Phillips, D. L.(1998): A-band resonance Raman spectra and short-time photodissociation dynamics of trans-1-chloro-2-iodoethane in cyclohexane solution.Chemical Physics Letters, vol. 286, no. 1-2, pp. 79-87.
杂志排行

Computers Materials&Continua的其它文章
- A Fusion Steganographic Algorithm Based on Faster R-CNN
- Securing Display Path for Security-Sensitive Applications on Mobile Devices
- Verifiable Diversity Ranking Search Over Encrypted Outsourced Data
- Defining Embedding Distortion for Intra Prediction Mode-Based Video Steganography
- Localization Algorithm of Indoor Wi-Fi Access Points Based on Signal Strength Relative Relationship and Region Division
- An Abnormal Network Flow Feature Sequence Prediction Approach for DDoS Attacks Detection in Big Data Environment