RbCl和CsCl水溶液结构的X射线散射及经验势结构精修模拟
2018-05-25周永全曾我良枝山口敏男房艳房春晖
周永全,曾我良枝,山口敏男,房艳,房春晖,*
1中国科学院青海盐湖研究所,青海 西宁 810008
2福冈大学理学院化学系,福冈 814-0180,日本
1 In troduction
Rubidium and cesium are strategic rare-dispersed element resources in brine. Solvent extraction and adsorption are considered as the most promising technologies for rubidium and cesium separation from salt lake brine1,2. Solvent extraction and adsorption are also designated as the potential ways for radioactive isotopes137Cs elimination from the nuclear waste water1,3. The local hydration structure of Rb+and Cs+is essential for understanding the extraction mechanism of both ions. For example, there are abundant studies on the complexation of alkali metal ions with crown ethers. Although the inchoate theories such as “best-fit theory”4and “maximum contact point theory”5were often used for elaborating the extraction selectivity of crown ethers,researchers6–9have recently stated that the extraction selectivity series is not explained until the ion hydration and the solvent effect are taken into consideration at the molecular level.
M icroscopic properties such as the ionic hydration and ion pairs of aqueous solutions have attracted researchers’ attention over decades10–13. Numerous X-ray and neutron scattering studies on the microscopic properties of alkali ion hydration and association have been performed, and a comprehensive report summarised the results on the structure and dynamics of hydrated ions until 199314. Cl−is widely studied and characterized by a relatively stable hydration shell14,15. The hydration structure of Li+and Na+w ith small ionic radii in aqueous solutions is well studied and defined as a rigid hydration shell14. On the contrary, the larger size Rb+and Cs+may have weaker tendencies of hydration and more variegated than the smaller ones. Additionally, the distance of the first-neighbor O(W)-O(W) interactions for solvent water is close to the hydration distances of Rb+and Cs+, which makes it difficult to extract the structural information about the hydration of these ions, especially for Rb+. Furthermore, Rb+and Cs+strongly absorb X-rays, and Rb+emits serious fluorescence when a molybdenum anode target is used.Therefore, structural studies on aqueous solutions of rubidium and cesium salts are much less and controversial. Smirnov et al.16summarised the structures of the nearest neighbors of Rb+and Cs+in aqueous solutions of their salts before 2007. Here,some latest results17–25are collected in Table 1.
According to Table 1, the Rb+–O (H2O) distance in aqueous rubidium salt solutions ranges w ithin 0.280–0.315 nm. The coordination number for Rb+varies in a range of 6.0–8.5. The Cs+–O distance w ithin the hydrated Cs+is in the range of 0.295–0.325 nm w ith the coordination number from 3 to 9.When considering the second hydration shell and the ion association in aqueous solutions of rubidium and cesium salts,there is few detailed information. Although neutron and X-ray scattering and X-ray absorption methods are well known for providing us direct structure information on ion hydration and association26–29, the structural information obtained is limited to one-dimensional, and thus no detailed structure of ion hydration and association is obtained. Developed by Soper et al.30–32, Empirical Potential Structure Refinement (EPSR) has become a versatile methodology to analyze the onedimensional total X-ray and neutron scattering data of liquid and amorphous materials. EPSR has been proved to be very successful in extracting the individual site-site pair correlation functions, coordination number distribution, angle distribution,and spatial density function (SDF, 3D structure), etc. for various liquids and solutions under various conditions33–36.
In the present work, X-ray diffraction measurements are made on aqueous 1.0 mol·dm−3RbCl and CsCl solutions.EPSR modelling based on the X-ray structure factors obtained is used to estimate all site-site pair correlation functions, the coordination number distributions, and the spatial density functions. The structures about hydrated Cl−, Rb+, Cs+, ion association, as well as solvent water in the solutions, are discussed.

Table 1 Structural parameters of Rb+ and Cs+ hydration under ambient condition obtained by experimental and theoretical methods.
2 Experim en tal and theo retical m ethods
2.1 Sam p les p reparation and analysis
Commercially available RbCl and CsCl (AR, Sigma Chemicals) were recrystallized from distilled water. Sample solutions were prepared by mass w ith ultrapure water to a required concentration. The density of both solutions was determined w ith a vibrating densitometer DMA48 (Anton Paar)which had been calibrated w ith dried air and distilled water at(298 ± 0.5) K, w ith the reproducibility of 0.01%. The composition and properties of the sample solutions are listed in Table 2.

Table 2 Com position and properties of the sam p le solutions.
2.2 X-ray d iffrac tion m easu rem en ts
X-ray scattering patterns were measured in a reflection geometry for free surface of sample solutions at ambient condition (T = (298 ± 2) K) on an X-ray diffractometer(Empyrean, PANalytical) w ith a GaliPix 3D detector. The X-rays were generated by an Ag anode tube (the wavelength, λ =0.056087 nm for Ag Kα) operated at 60 kV and 30 mA.Rhodium filter was used to strip the Kβ radiation. The scattering angle range spanned 2° ≤ 2θ ≤ 150°, corresponding to a range of the scattering vector Q (Q = 4πsinθ/λ) of 4.292 nm–1≤ Q ≤216.4 nm–1. Divergent and scattering slits of 1/16° and 1/4° for the low angle range of 2° to 50° and 1/2° and 1° for a high angle range of 40° to 150° were employed, respectively. The accumulative counts for each angle were greater than 5 × 10⁴to ensure the statistical counting errors of less than 1%.
2.3 X-ray data treatm en ts
A fter absorption correction of the samples, the corrected intensity (Icor) was normalized to an electron unit by comparing the asymptote of the experimental data with the calculated coherent intensity in a large scattering vector range (Q > 150 nm−1). The normalization factor was re-checked by Krogh-Moe and Norman integration methods37,38. The values from both methods agreed w ith each other w ithin 2%. The structure function i(Q) of the solutions was calculated by subtracting the independent scatterings of all atoms in the solution from the normalised intensity as

Here, K is the normalization factor, I cor(Q) the experimental intensity corrected for polarization, ni the number of the i-th atom in the stoichiometric volume (V) containing one water molecule, fi(Q) expresses the atom ic scattering factor of atom i corrected for the real part of the anomalous dispersion, Δfi" is the imaginary part, taken from the reference39, Iiincoh(Q)denotes the incoherent scattering including the Breit-Dirac recoil factor correction for atom i, which was cited from Hubbell’s papers40. The Q-weighted structure function was Fourier-transformed to the radial distribution function (RDF).
The ripples observed at distances less than 0.1 nm were removed by calculating the theoretical peak of the intramolecular interactions w ithin a water molecule and performing Fourier inverse transformation in a usual manner41.Then, the coherent scattering intensity (Icoh(Q)) can be gotten as Eq.(2)

All the corrections and treatments were performed w ith the program KURVLR42. More details about the X-ray data analysis can be found elsewhere28,43.
2.4 Em p irical po ten tial struc tu re re finem en t m odelling
EPSR utilises a Monte Carlo style methodology to minim ise the diあerence between experimental total structure factors and those generated from the simulation of a sample solution. The experimental total normalised structure factor used in EPSR is defined as Eq.(3)
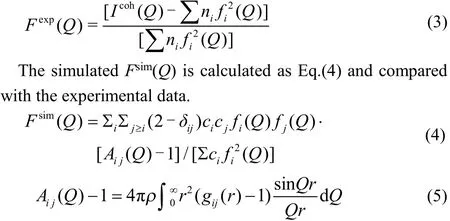
where Fsim(Q) is the total structure factor, ci and cj are the atomic fractions of atom types i and j, fi(Q) and fj(Q) are the Q dependent atomic scattering factors of atom types i and j, δij is the Kronecker function to avoid double counting pairs of atoms of the same type, Aij(Q) is the Faber-Ziman partial structure factor, gij(r) is the site-site pair correlation function for all of the atoms present in the sample.
The total radial distribution functions (G(r)) is calculated as Eq.(6).

Initial structures for an EPSR simulation are generated by placing the appropriate number of ions and molecules into a box to give the required density. The potential energy of the simulation box is calculated as Eqs.(7) and (8),
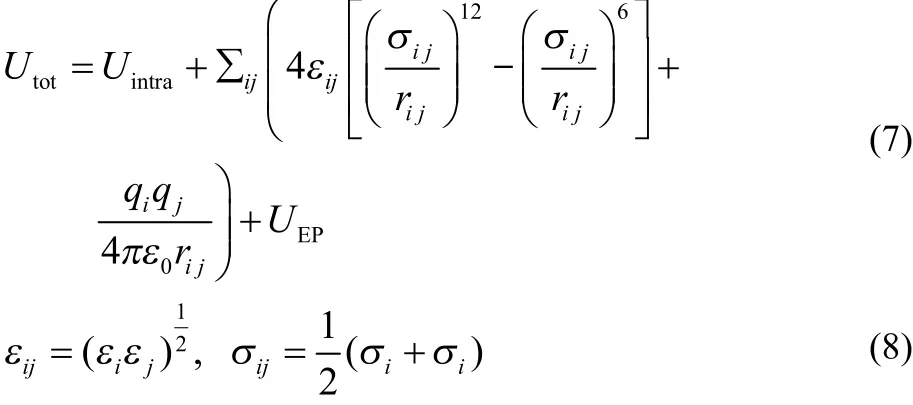
where U intra is described by using a series of harmonic potentials, εij and σij are the Lennard-Jones parameters for the potential well depth and eあective atom size, respectively, ε0is the vacuum permittivity, rijis the interatom ic spacing, qiis the atomic charge, U EP is the empirical potential which is generated in EPSR30–32.
The EPSR simulation boxes were set up by using a cubic box containing 1000 water molecules for pure water, 1000 water molecules, 18 Cl−and 18 Rb+or 18 Cs+for the 1.0 mol∙dm−3RbCl and CsCl aqueous solutions, corresponding to the experimental salt concentration, respectively. The potential parameters44,45used in the EPSR modelling are listed in Table 3.
Then, Monte Carlo (MC) simulations in EPSR were done in the traditional way. The diあerence between EPSR and the conventional MC is that the potential energy function used in EPSR (Eq.(7)) has an additional perturbation term (U EP)derived purely from the fit of the simulation to the experimental scattering data. This empirical potential energy term serves to drive the simulated structure factor as close as possible to the experimental scattering data w ithout violating the constraints imposed on the atomic overlap, van der Waals forces, and hydrogen bonding30–32. Fig.1 illustrates the calculation flow of EPSR.
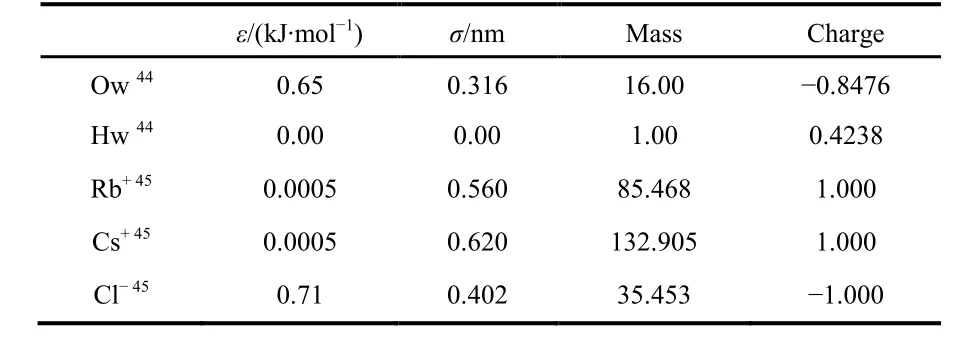
Table 3 Reference potential parameters used in EPSR modelling.

Fig.1 Scheme for the calculation flow of EPSR.
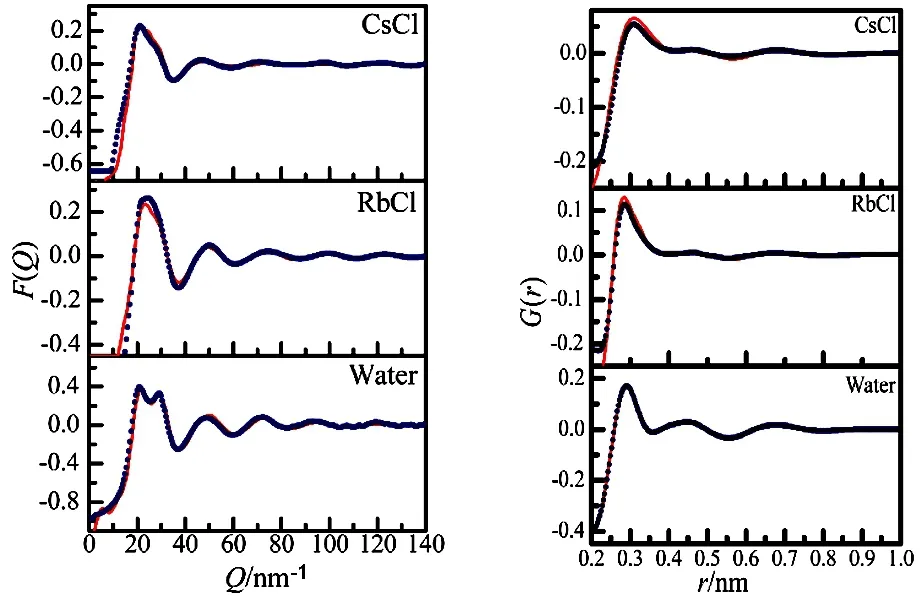
Fig.2 Experim entally determ ined (points) and EPSR simu lated (solid lines) F(Q) and G(r) for the 1.0 mol·dm–3 aqueous RbCl and CsCl solutions.
3 Resu lts and d iscussion
Experimentally determined and EPSR simulated F(Q) and G(r) for the sample solutions are shown in Fig.2. There are good agreements between the experimental data and the EPSR fi ts in F(Q) above ~10 nm−1and above ~0.2 nm in G(r), which indicates that reasonable structures were elucidated.
3.1 Hyd ration of C l−, Rb+ and Cs+
The hydration of Cl−is characterized from gCl-O(W)(r) of the aqueous RbCl and CsCl solutions (Fig.3a). The Cl-O(W) pair correlation functions are very analogous to each other, with the same hydration distance of 0.321 nm, and with a tiny difference in the peak intensity. The coordination number CN of j-th ion is calculated by Eq.(9).

Here, ρj is the number density of atom j, r m in and r max denote the minimum and maximum distance, respectively, to define the hydration shell of the ion.
The hydration numbers of Cl-are 5.9 ± 1.1 and 6.0 ± 1.1 in the RbCl and CsCl, respectively (Fig.3b and Table 3). This tiny difference in the intensity of the first peak might indicate a relatively stronger ion association in the aqueous RbCl solution than in the aqueous CsCl solution as discussed in subsequent Section 3.3.

Fig.3 The pair correlation functions (a) and the coordination num ber distributions (b) of Cl-O(W) in the 1.0 m ol·dm−3 aqueous RbCl and CsCl solutions from EPSR m odelling.
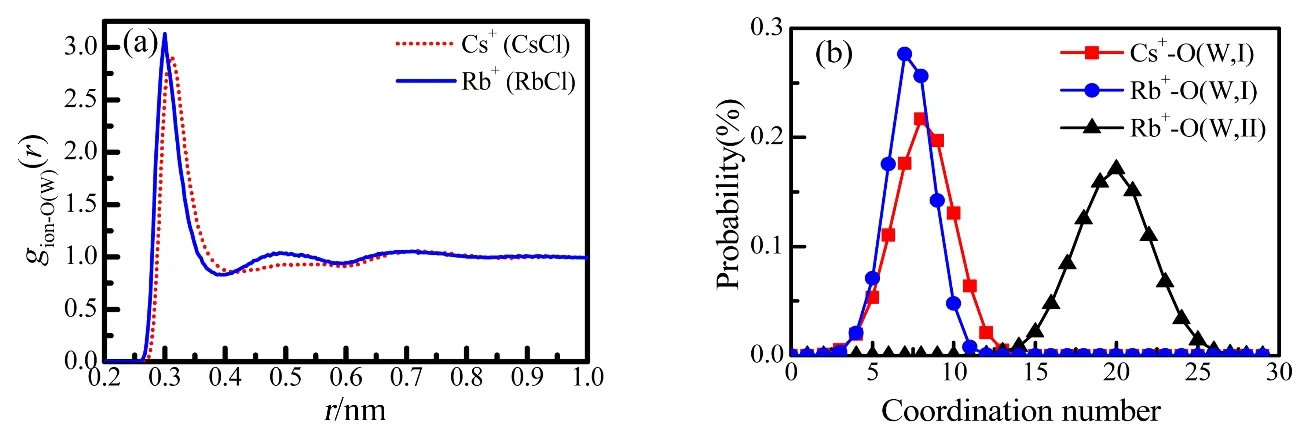
Fig.4 The pair correlation functions (a) and the coordination number distributions (b) of Rb–O(W) and Cs-O(W) in 1.0 mol·dm–3 aqueous RbCl and CsCl solutions from EPSR modelling.

Fig.5 Hyd ration structures of Cl− (a), Rb+ (b) and Cs+ (c) extracted from a random snapshot of EPSR m odeling.
The hydration shells for Rb+and Cs+are seen as the first peaks at 0.297 and 0.312 nm in gRb-O(W)(r) and gCs-O(W)(r) due to Rb+–O(W) and Cs+–O(W) distances, respectively (Fig.4a).Here, we should note that their coordination numbers are sensitive to the cutoff distance (r m in and r max) in Eq.(9). In this work, the integration range was chosen up to the first minimum of g(r) as 0.261–0.378 nm for Rb+and 0.285–0.413 nm for Cs+.The coordination numbers thus obtained are given in Table 3.The Rb+is surrounded by 7.3 ± 1.4 water molecules, and 8.4 ±1.6 water molecules hydrate Cs+. Schematic pictures of the hydration structures of Cl−, Rb+and Cs+were extracted from the snapshots of EPSR modelling boxes and are shown in Fig.5.
Both Rb+and Cs+are the typical large ionic-radius monovalent ions w ith a low surface charge density and are classified as weakly hydrated ions in contrast to Li+and Na+.Such an evidence is seen in the second coordination sphere. As is seen in g Cs-O(W)(r) in Fig.4a, Cs+does not form the second hydration sphere. Available data on the second hydration sphere of Rb+are ambiguous and controversial in the literature.Angelo et al.46stated that Rb+does not form the second hydration sphere, whereas Sm irnov’s study47showed the formation of the stable second coordination sphere. In the present work, the EPSR modelling results show that Rb+shows stronger hydration ability than Cs+since the second hydration sphere is observed in gRb-O(W)(r) in Fig.4a. However, its second hydration sphere diffuses from 0.378 to 0.591 nm, and the coordination number corresponds to 15 to 25 according to Fig.4b. The average coordination number of the second shell of Rb+is 18.7 ± 2.4 w ith large uncertainties (Table 4), which means a relaxed second hydration sphere.
3.2 Bu lk w ater
The pair correlation functions of O(W)-O(W) in aqueous 1.0 mol·dm−3RbCl and CsCl solutions and pure water are shown in Fig.6a. The first-neighbor O(W)-O(W) peak in pure water is observed around 0.279 nm in the present work,which is well consistent w ith the literature33,48. According to the g O(W)-O(W)(r) of the RbCl and CsCl solutions, the first O(W)-O(W, I) peak sharpens, and the peak position shifts to 0.273 nm, which indicates the tetrahedral structure intensifies in the bulk water. This behavior is sim ilar to that in pure water under pressure, which has been observed by many other researchers33. The averaged coordination number of O(W)-O(W, I) decreases from 4.9 ± 1.1 in pure water to 3.8 ± 0.9 in the RbCl and CsCl solutions (Table 4).In addition, the second peak in the gO(W)-O(W)(r) shifts to the shorter distance (Fig.6a).
The spatial density functions were calculated, which shows the location of molecules or portions of molecules relative to one another49. By averaging over the orientation of the neighbouring molecules which is derived from a spherical harmonic expansion of the pair correlation function from the modelling box, a three-dimensional view of the liquid structure is provided. The SDFs of the neighboring water molecule around a central water molecule are shown in Fig.7. The range for each shell was fixed to the local m inimum of gO(W)-O(W)(r) of pure water to view a change in the SDFs in the different solutions at the same length scales.
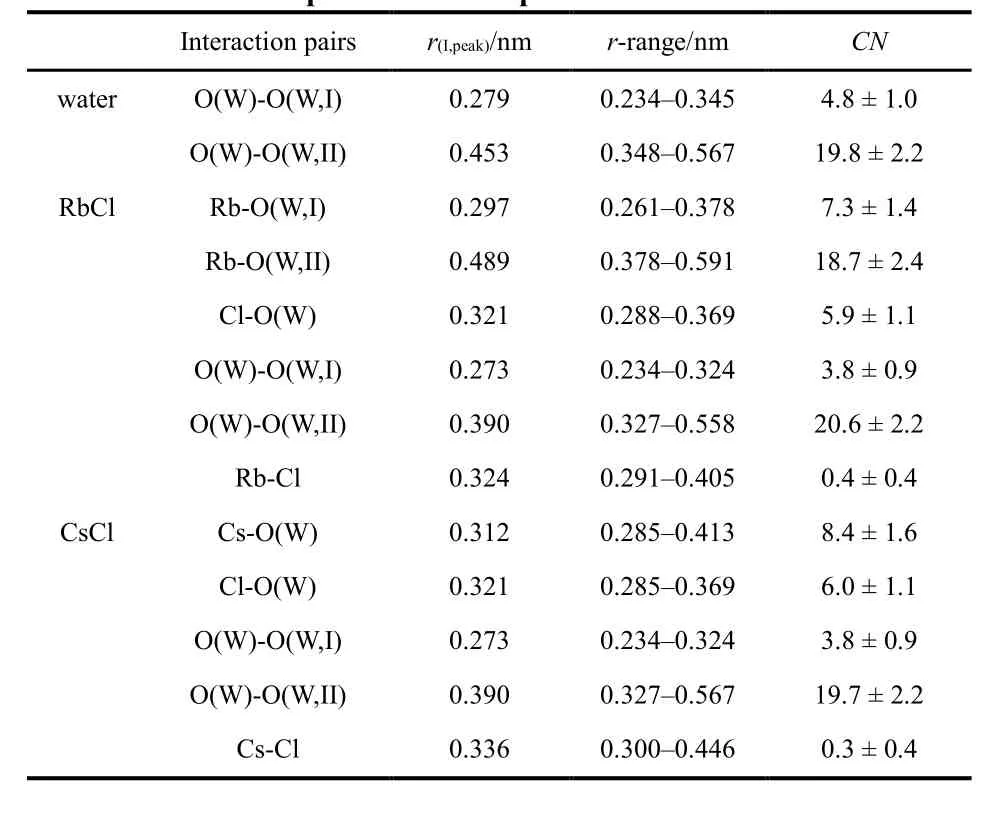
Table 4 The positions and average coordination num ber of the atom pairs in the samp le solutions.

Fig.6 The pair correlation functions (a) and the coordination number distributions (b) of O(W)-O(W) in the 1.0 mol·dm−3 RbCl and CsCl solutions and pure water from EPSR modelling.

Fig.7 Spatial density distribution functions of the neighboring water m olecules around a central water m olecule. The pure water(top),1.0 m ol·dm−3 aqueous RbCl solution(m idd le)and 1.0 m ol·dm−3 aqueous CsCl solutions (bottom).
The dark blue lobes represent the fi rst sphere at a contour level of 25% of the water molecules w ithin the distance lim its of 0.10–0.336 nm, and the greyish blue and sem itransparent ones do the second sphere (0.339–0.567 nm). The red and white balls in the centre represent O and H atoms of H2O, respectively. Top views are for pure water, the m iddle one for the 1.0 mol∙dm−3RbCl aqueous solution, and the bottom views for the 1.0 mol∙dm−3CsCl aqueous solution.
As is seen in Fig.7, the fi rst shell keeps the tetrahedral coordination w ith the slight decrease in the diffusion range for the RbCl and CsCl solutions, which indicates the tetrahedral structure of the first sphere intensified in the electrolyte solutions. On the other hand, the greyish blue and sem itransparent lobes (the second sphere) diffuse in a larger range zone compared w ith pure water. This indicates the tetrahedral ordering of the second shell becomes more disordered for the electrolyte solutions. It is worth noting that all the Cl−, Rb+and Cs+are classified as the typical“structure breaking” ions in aqueous solutions50. On the microscopic level, we can draw out the conclusion that this so-called “breaking” mainly affects the second sphere around the central water molecule.

Fig.8 The pair correction functions (a) and the coordination number distributions (b) of Rb-Cl and Cs-Cl in1.0 m ol·dm−3 aqueous RbCl and CsCl solutions from EPSR m odelling.

Fig.9 Local structure of the contact ion pairs in 1.0 m ol·dm−3 aqueous RbCl (a) and CsCl (b) solutions extracted from snapshot of EPSR modelling.
3.3 Ion assoc iation
When considering the ionic association, we should note that the preferential formation of ion pairs w ith counter ions in aqueous RbCl and CsCl solutions is typical16,51. Ion association information about Rb+/Cs+and Cl−ion pairs can be seen from the ion-Cl pair correlation functions g ion-Cl(r)shown in Fig.8a. In gion-Cl(r), we can find a peak around 0.324 and 0.336 nm in the aqueous RbCl and CsCl solutions,respectively, which can be attributed to the Rb+–Cl−and Cs+–Cl−characteristic distances of direct contact ion pairs in the solution. Fig.8b shows the coordination number distributions of the Rb+-Cl−and Cs+-Cl−contact ion pairs which range zero to less than 2 w ith the average coordination number of 0.4 ± 0.4 and 0.3 ± 0.4 in the 1.0 mol∙dm−3RbCl and CsCl solutions, respectively. The large uncertainties reflect relatively loosened contact Rb+-Cl−and Cs+-Cl−and ion pairs in the 1.0 mol∙dm−3solutions. In fact, more than 60% of Cs+and Rb+are present as the aqua ions.
The formation of cation-anion contact ion pairs should be concentration dependent. Extended studies on aqueous RbCl and CsCl solutions of different salt concentrations are in progress.
There is a very broad peak from 0.45 to 0.65 nm in g Cs-Cl(r), which indicates that the solvent separated ion pairs may coexist in the CsCl solution. On the other hand, this broad peak is very ambiguous in gRb-Cl(r). Comparing w ith Cs+, Rb+seems to prefer toform direct contact ion pairs and shows a stronger ion association ability. Fig.9 shows the schematic views for the contact ion pairs in 1.0 mol∙dm−3aqueous RbCl and CsCl solutions extracted from a random snapshots of EPSR modelling.
4 Conc lusions
The structure of 1.0 mol∙dm−3aqueous RbCl and CsCl solutions under the ambient condition is studied by X-ray diffraction measurements. The experimental structure factors are subjected to empirical potential structure refinement modelling to reveal the details of ion hydration and association in the solutions.
(1) In aqueous RbCl and CsCl solutions, the Cl−–H2O distance is almost the same as 0.321 nm w ith very similar coordination numbers of 5.9 ± 1.1 and 6.0 ± 1.1,respectively.
(2) Rb+is surrounded on the average by 7.3 ± 1.4 water molecules w ith the Rb+–H2O distance of 0.297 nm. A relatively obvious second hydration sphere can be assigned w ith the Rb+–H2O(II) distance of 0.489 nm and the coordination number of 18.7 ± 2.4.
(3) Average 8.4 ± 1.6 water molecules hydrate w ith Cs+w ith the Cs+–H2O distance of 0.312 nm. Cs+does not form the second hydration sphere in the present solution. Cs+show s relatively weaker hydration ability than Rb+.
(4) Dissolution of RbCl and CsCl into water intensifies the tetrahedral structure of the bulk water, which is in a sim ilar fashion as pure water under pressure. Cl−, Rb+and Cs+prevent the second neighbour water molecules around the central one from form ing a tetrahedral sphere.
(5) Direct contact ion pairs are partially formed in both aqueous RbCl and CsCl solutions, w ith the Rb–Cl and Cs–Cl distances of 0.324 and 0.336 nm, respectively. Rb+shows stronger ion association abilities than Cs+.
References
(1) Xu, C.; Wang, J. C.; Chen, J. Solvent Extr. Ion Exc. 2012, 30, 623.doi: 10.1080/07366299.2012.700579
(2) Lei, H.; Li, S.; Zhai, Q.; Zhang, H.; Jiang, Y.; Hu, M. Acta Phys. -Chim. Sin. 2012, 28, 1599. [雷红, 李淑妮, 翟全国,张晖英, 蒋育澄, 胡满成. 物理化学学报, 2012, 28, 1599.]doi: 10.3866/PKU.WHXB201204281
(3) Zhang, H.; Wang, S.; Wang, R.; Lin, C.; Zhang, X.; Wang, X.Acta Phys. -Chim. Sin. 2000, 16, 952. [张惠源, 王淑兰, 王榕树,林灿生, 张先业, 王孝荣. 物理化学学报, 2000, 16, 952.]doi: 10.3866/PKU.WHXB20001016
(4) Izatt, R. M.; Rytting, J. H.; Nelson, D. P.; Haymore, B. L. Science 1969, 164, 443. doi: 10.1126/science.164.3878.443
(5) Maleknia, S.; Brodbelt, J. J. Am. Chem. Soc. 1993, 115, 2837.doi: 10.1021/ja00060a034
(6) Glendening, E. D.; Feller, D.; Thompson, M. A. J. Am. Chem.Soc. 1994, 116, 10657. doi: 10.1021/ja00102a035
(7) Inokuchi, Y.; Ebata, T.; Rizzo, T. R.; Boyarkin, O. V. J. Am. Chem.Soc. 2014, 136, 1815. doi: 10.1021/ja4086066
(8) Rodriguez, J. D.; Vaden, T. D.; Lisy, J. M. J. Am. Chem. Soc.2009, 131, 17277. doi: 10.1021/ja906185t
(9) Inokuchi, Y.; Boyarkin, O. V.; Kusaka, R.; Haino, T.; Ebata, T.;Rizzo, T. R. J. Phys. Chem. A 2012, 116, 4057.doi: 10.1021/jp3011519
(10) Richens, D. T. The Chemistry of Aqua Ions: Synthesis, Structure and Reactivity: A Tour Through the Periodic Table of the Elements; Wiley: Chichester, UK, 1997; pp. 24–68.
(11) Fawcett, W. R. Liquids, Solutions, and Interfaces from Classical Macroscopic Descriptions to Modern Microscopic Details;Oxford Univesity Press: New York, USA, 2004; pp. 204–254.
(12) Hao, L.; Zhao, Y.; Zhao, J.; Jiang, X.; Yang, Z.; Zhao, D. Acta Phys. -Chim. Sin. 2016, 32, 2921. [赫兰兰, 郭宇, 赵健, 姜新蕊,杨忠志, 赵东霞. 物理化学学报, 2016, 32, 2921.]doi: 10.3866/PKU.WHXB201609193]
(13) Galib, M.; Baer, M. D.; Skinner, L. B.; Mundy, C. J.; Huthwelker,T.; Schenter, G. K.; Benmore, C. J.; Govind, N.; Fulton, J. L.J. Chem. Phys. 2017, 146, 084504. doi: 10.1063/1.4975608
(14) Ohtaki, H.; Radnai, T. Chem. Rev. 1993, 93, 1157.doi: 10.1021/cr00019a014
(15) Cummings, S.; Enderby, J. E.; Neilson, G. W.; Newsome, J. R.;Howe, R. A.; Howells, W. S.; Soper, A. K. Nature 1980, 287, 714.doi: 10.1038/287714a0
(16) Sm irnov, P. R.; Trostin, V. N. Russ. J. Gen. Chem. 2007, 77, 2101.doi: 10.1134/S1070363207120043
(17) Du, H.; Rasaiah, J. C.; M iller, J. D. J. Phys. Chem. B 2007, 111,209. doi: 10.1021/jp064659o
(18) M ile, V.; Gereben, O.; Kohara, S.; Pusztai, L. J. Phys. Chem. B 2012, 116, 9758. doi: 10.1021/jp301595m
(19) Ramos, S.; Barnes, A. C.; Neilson, G. W.; Capitan, M. J. Chem.Phys. 2000, 258, 171. doi: 10.1016/S0301-0104(00)00132-4
(20) Ildikó, H.; László, P. J. Phys.: Condens. Matter 2007, 19, 335208.doi: 10.1088/0953-8984/19/33/335208
(21) M ile, V.; Pusztai, L.; Dom inguez, H.; Pizio, O. J. Phys. Chem. B 2009, 113, 10760. doi:10.1021/jp900092g
(22) Buda, A.; A li, S. M. J. Mol. Liq. 2013, 179, 34.doi: doi/abs/10.1021/ic030310t
(23) Ikeda, T.; Boero, M. J. Chem. Phys. 2012, 137, 041101.doi: 10.1063/1.4742151
(24) Mähler, J.; Persson, I. Inorg. Chem. 2011, 51, 425.doi: 10.1021/ic2018693
(25) Ling, L.; Fang, C.; Fang, Y. Salt Lake Res. 2006, 15, 45. [林联君,房春晖, 房艳, 秦绪锋. 盐湖研究, 2006, 15, 45.]
(26) Ansell, S.; Barnes, A. C.; Mason, P. E.; Neilson, G. W.; Ramos, S.Biophys. Chem. 2006, 124, 171. doi: 10.1016/j.bpc.2006.04.018
(27) Neilson, G. W.; Mason, P. E.; Ramos, S.; Sullivan, D. Philos.Trans. R. Soc. London, Ser. A 2001, 359, 1575.doi: 10.1098/rsta.2001.0866
(28) Zhou, Y.; Fang, C.; Fang Y.; Zhu, F.; Tao, S.; Xu, S. Russ. J. Phys.Chem. A 2012, 86, 1236. doi: 10.1134/S0036024412060349
(29) Thorpe, S. J. L.; Thorpe, M. F. Local Structure from Diffraction;K luwer Academ ic Publishers: New York, USA, 2002; pp. 59–85.
(30) Soper, A. K. Chem. Phys. 1996, 202, 295.doi: 10.1016/0301-0104(95)00357-6
(31) Soper, A. K. Phys. Rev. B 2005, 72, 104204.doi: 10.1103/PhysRevB.72.104204
(32) Soper, A. K. Mol. Simul. 2012, 38, 1171.doi: 10.1080/08927022.2012.732222
(33) Yamaguchi, T.; Fujimura, K.; Uchi, K.; Yoshida, K.; Katayama, Y.J. Mol. Liq. 2012, 176, 44. doi: 10.1016/j.molliq.2012.08.021.
(34) Shalaev, E.; Soper, A. K. J. Phys. Chem. B 2016, 120, 7289.doi: 10.1021/acs.jpcb.6b06157
(35) Mancinelli, R.; Botti, A.; Bruni, F.; Ricci, M. A.; Soper, A. K.J. Phys. Chem. B 2007, 111, 13570. doi: 10.1021/jp075913v
(36) Bow ron, D. T.; Moreno, S. D. Coord. Chem. Rev. 2014, 277, 2.doi: 10.1021/jp202961t
(37) Krogh-Moe, J. Acta Crystallogr. 1956, 9, 951.doi: 10.1107/S0365110X56002655
(38) Norman, N. Acta Crystallogr. 1957, 10, 370.doi: 10.1107/S0365110X57001085
(39) Prince, E. International Tables for Crystallography; Kluwer Academ ic Publishers: London, UK, 2004; pp. 230–235, 255,555–556, 658.
(40) Hubbell, J. H.; Veigele, W. J.; Briggs, E. A.; Brown, R. T.;Cromer, D. T.; Howerton, R. J. J. Phys. Chem. Ref. Data 1975, 4(3), 471. doi: 10.1063/1.555523
(41) Kaplow, R.; Strong, S. L.; Averbach, B. L. Phys. Rev. 1965, 138,A1336. doi: 10.1103/PhysRev.138.A1336
(42) Johansson, G.; Sandström M. Chemica Scripta 1973, 4, 195.doi: 10.1107/S0021889875009594
(43) Zhou, Y.; Fang, C.; Fang, Y. Acta Phys. -Chim. Sin. 2010, 26,2323. [周永全, 房春晖, 房艳. 物理化学学报, 2010, 26, 2323.]doi: 10.3866/PKU.WHXB20100903
(44) Yamaguchi, T.; Lee, K.; Yamauchi, M.; Fukuyama, N.; Yoshida,K. Bunseki Kagaku 2015, 64, 295.doi: 10.2116/bunsekikagaku.64.295
(45) Jensen, K. P.; Jorgensen, W. L. J. Chem. Theory Comput. 2006, 2,1499. doi: 10.1021/ct600252r
(46) D’Angelo, P.; Persson, I. Inorg. Chem. 2004, 43, 3543.doi: 10.1021/ic030310t
(47) Sm irnov, P. R.; Grechin, O. V. Russ. J. Coord. Chem. 2013, 39,685. doi: 10.1134/S1070328413090078
(48) Soper, A. K. Chem. Phys. 2000, 258, 121.doi: 10.1016/S0301-0104(00)00179-8
(49) Soper, A. K. J. Chem. Phys. 1994, 101, 6888.doi: 10.1063/1.468318
(50) Marcus, Y. Chem. Rev. 2009, 109, 1346. doi: 10.1021/cr8003828.
(51) Chen, T.; Hefter, G.; Buchner, R. J. Phys. Chem. A 2003, 107,4025. doi: 10.1021/jp026429p
猜你喜欢
杂志排行
物理化学学报的其它文章
- Fukui函数和局域软度应用于亲电加成反应的区位选择性的研究
- 通过价层电子密度分析展现分子电子结构
- TPE核的螺旋手性
- Generalized Hirsh feld Partitioning w ith Orien ted and Prom o ted Proatom s
- Chem ical Bond ing and In terp retation of Tim e-Dependen t Elec tronic Processes w ith Maxim um Probability Dom ains
- Adso rp tion of Hyd razoic Acid on Pristine Graphyne Sheet:A Com pu tational Study
