Dominant SST Mode in the Southern Hemisphere Extratropics and Its Influence on Atmospheric Circulation
2018-05-19FeiZHENGJianpingLIFredKUCHARSKIRuiqiangDINGandTingLIU
Fei ZHENG,Jianping LI,Fred KUCHARSKI,Ruiqiang DING,and Ting LIU
1State Key Laboratory of Numerical Modeling for Atmospheric Sciences and Geophysical Fluid Dynamics,Institute of Atmospheric Physics,Chinese Academy of Sciences,Beijing 100029,China
2State Key Laboratory of Earth Surface Processes and Resource Ecology and College of Global Change and Earth System Science,Beijing Normal University,Beijing 100875,China
3Laboratory for Regional Oceanography and Numerical Modeling,Qingdao National Laboratory for Marine Science and Technology,Qingdao 266237,China
4Earth System Physics Section,Abdus Salam International Centre for Theoretical Physics,Trieste 34151,Italy
5Center of Excellence for Climate Change Research,Department of Meteorology,King Abdulaziz University,Jeddah 21589,Saudi Arabia
6Plateau Atmosphere and Environment Key Laboratory of Sichuan Province,Chengdu University of Information Technology,Chengdu 610103,China
7State Key Laboratory of Satellite Ocean Environment Dynamics,Second Institute of Oceanography,Hangzhou 310012,China
1.Introduction
The Southern Hemisphere(SH)extratropical ocean is the only area on Earth where ocean waters circle all longitudes,and it plays an important role in the global climate system.One of the strongest ocean currents,the Antarctic circumpolar current, flows from west to east around Antarctica and is driven by strong surface westerly winds over the SH extratropics.Several strong ocean fronts,such as the Antarctic Polar Front(APF)and the Subantarctic Front(SAF),are superimposed on the Antarctic circumpolar current and orientated almost zonally around Antarctica(Orsi et al.,1995).These Antarctic circumpolar current fronts are characterized by sharp meridional gradients in sea surface temperature(SST),salinity,and nutrients.
Increasing attention has been paid to exploring SST variability in the SH extratropics,with the leading mode of SH extratropical SST investigated over interannual timescales.For example,Ciasto and Thompson(2008)examined the dominant temporal mode of SH extratropical SST over the period 1981–2005 by performing an empirical orthogonal function(EOF)analysis on SST time series south of 20°S during the warm(November–April)and cold(May–October)seasons.They found that the areas of homogeneity of the dominant mode(EOF1)shows a dipole-like pattern,with an out-of-phase relationship between SST anomalies(SSTAs)in the SH middle and high latitudes.This dipole mode is stronger in November–April than in May–October.Liu and Curry(2010)performed an EOF analysis of SH extratropical SST south of 40°S using annual average SST data for the period 1950–99,and illustrated that the EOF1 indeed shows a dipole-like structure.
One important aspect of air–sea interaction in the SH extratropics is the driving role of SH extratropical atmospheric circulation on SH extratropical SST.The EOF1 of atmospheric circulation in the SH extratropics is the Southern Annular Mode(SAM),associated with a meridional temporal oscillation in sea level pressure(SLP)between the middle and high latitudes of the SH,accompanied by a north–south fluctuation in the position of the midlatitude atmospheric westerly jet(Hartmann and Lo,1998;Gong and Wang,1999;Kidson and Watterson,1999;Thompson and Wallace,2000;Lorenz and Hartmann,2001;Li and Wang,2003).The surface wind anomalies related to the SAM play an important role in influencing SH extratropical SST,through both dynamic and thermodynamic processes associated with the surface winds.During the positive(negative)phase of the SAM,negative(positive)SSTAs tend to occur in high latitudes,with positive(negative)SSTAs in middle latitudes(Watterson,2000;Marshall et al.,2001;Cai and Watterson,2002;Hall and Visbeck,2002;Visbeck et al.,2003;Lefebvre et al.,2004;Sen Gupta and England,2006;Ciasto and Thompson,2008;Wu et al.,2009,2015;Thompson et al.,2011).This temporal dipole-like SSTA associated with the SAM index(SAMI)reflects the leading mode of SH extratropical SST,and Cias to and Thompson(2008)verified that the SAMI projects onto the leading mode of SST.For brevity,we refer to the areas of homogeneity of the principal temporal mode of extra tropical SST as the Southern Ocean(SO)Dipole(SOD),because at the same time the centers of these areas have opposite SSTA values.The dipole-like SSTA is hereafter referred to as the SOD-like SSTA.
Although the extratropical atmosphere plays a key role in determining the underlying SST variability,an increasing number of studies have demonstrated that the SH extratropical ocean also provides feedback to the SH extratropical atmosphere(Kushnir et al.,2002;Liu et al.,2002;Kucharski and Molteni,2003;Liu and Yang,2003;Zhang et al.,2005;Li et al.,2006;Wu et al.,2007;Kang et al.,2008,2009;Nakamura et al.,2008;Yang and Wang,2008,2011;Wu et al.,2009;Sampe et al.,2010;Wu and Zhang,2011;Swann et al.,2012;Hwang and Frierson,2013;Ogawa et al.,2015,2016;Hu et al.,2016;Xiao et al.,2016).For example,Kushnir et al.(2002)carried out a series of atmospheric general circulation model(AGCM)simulations and revealed that the extratropical atmosphere does respond to the extratropical SST over the North Pacific and North Atlantic,in spite of the relatively small size of the response compared with the internal variability.Yamazaki and Watanabe(2015)used outputs from phase 5 of the Coupled Model Intercomparison Project(CMIP5)to show that warmer SO SST gives rise to an anomalous northward heat transport across the extratropics into the tropics caused by a weaker meridional temperature gradient,which further induces an anomalous Hadley cell with an anomalous southward moisture transport in the lower branch(e.g.,Chiang and Bitz,2005;Kang et al.,2008).A recent study by Ogawa et al.(2016)explored the in fluence of SH midlatitude oceanic fronts on the SAM using idealized aquaplanet experiments with zonally symmetric distributions of SST,and found that the characteristics of the wintertime SAM exhibit strong sensitivity to the position of the SST front.
Focusing on the in fluence of the SOD-like SSTA on extratropical atmosphere,and by using numerical simulations from both AGCM–slab ocean models and AGCM–full ocean general circulation models,Watterson(2000)and Sen Gupta and England(2007)indicated that the SOD-like SSTA in the SH extratropics significantly affects tropospheric zonal winds.By imposing fields of SSTA associated to each phase of the SOD index(SODI)in AGCM simulations using the National Center for Atmospheric Research(NCAR)Community Atmosphere Model(CAM),version 5(CAM5),Zheng et al.(2015)and Liu et al.(2015)showed that the response of the SH extratropical circulation to the SOD-like SSTA during austral summer(December–January–February;DJF)and autumn(March–April–May;MAM)is an anomalous clockwise and anticlockwise meridional circulation south and north of 50°S,respectively.A physical explanation based on momentum balance was proposed to explain the formation of these two anomalous meridional cells in response to the SOD-like SSTA during DJF and MAM(Zheng et al.,2015).
Although previous studies have advanced our understanding of the dominant mode of SH extratropical SST and its teleconnection with the atmospheric circulation, there are several characteristics of this mode that remain unclear. Firstly, several aspects of the spatial and temporal characteristicsof the dominant mode have not been well addressed. For example, previous work selected SSTs over different regions,e.g.,south of 20°S(Ciasto and Thompson,2008)and south of 40°S(Liu and Curry,2010),for the EOF analysis,but did not investigate the sensitivity of the leading mode to areas election.Secondly,little is known about the teleconnections that exists between the meridional circulation and the SOD-like SSTA for austral winter(June–July–August;JJA)and spring(September–October–November;SON).The aim of the present paper is to answer these questions,and the rest of the manuscript is organized as follows:Section 2 provides an overview of the data and methods used in this work.In section 3,the primary characteristics of the dominant temporal model of the SO SSTA are investigated,focusing on the uniform variance among different basins.On this basis,the feedback of the SOD-like SSTA to the atmosphere is explored in section 4,including results from CAM5 simulations and 28 Atmospheric Model Intercomparison Project(AMIP)models.A discussion and the conclusions are presented in section 5.
2.Data and methods
2.1.Data
The monthly average SST datasets used in this study are from HadISST,which is compiled by the UK Met Office Hadley Centre and has a horizontal resolution of 1.0°× 1.0°,and version 3b of the National Oceanic and Atmospheric Administration’s Extended Reconstructed SST dataset(ERSST.v3b),which has a horizontal resolution of 2.5°×2.5°.The results derived from these two datasets in the present study are in good agreement.As the HadISST dataset has a higher resolution than ERSST.v3b,in most cases only results from HadISST are shown.
The positions of the APF,SAF are well-documented in Orsi et al.(1995).In brief,the APF and SAF denote the two major belts with strongest meridional gradients appearing within the Antarctic circumpolar current(Orsi et al.,1995).The SAMI used in this study is defined according to the method proposed by Nan and Li(2003),i.e.,as the difference in normalized zonal-mean SLP between 40°S and 70°S.The SAMI based on this definition can be found at http://ljp.gcess.cn/dct/page/65544.The ENSO variability is quantified by the regionally averaged SST over(5°S–5°N,170°–120°W),i.e.,the Ni˜no3.4 index,which is available at http://www.cpc.ncep.noaa.gov/data/indices/.
Herein,we use the term SO to refer to the SH extratropical ocean(south of 30°S across all longitudes),including the southern Pacific Ocean(120°E–65°W),the southern Indian Ocean(20°–120°E),and the southern Atlantic Ocean(65°W–20°E).
2.2.Statistical methods
The EOF analysis treats the time series at each grid as variables,which is referred to as the S-mode of decomposition in principal component analysis(Compagnucci and Richman,2007).Therefore,the modes derived from EOF analysis are spatially distributed temporal modes.The spatial fields(eigenvectors)derived from EOF analysis reflect areas of homogeneity.The areas of homogeneity of the leading mode is referred to as EOF1,and the corresponding time series of EOF1 is referred to as principal component 1(PC1).
The normalized EOF analysis is performed on the SSTA to detect the leading temporal mode of SST variability.The term SSTA refers to the SST data after removal of the annual cycle.To ensure equal areas are given equal weight,the SSTA is weighted by multiplying by the cosine of latitude.The criteria described in North et al.(1982)are used to evaluate the eigenvalue separation of the EOF analysis.
Aside from EOF analysis,the primary statistical methods used in this study are correlation and regression analysis,and their statistical significance is assessed using the two-tailed Student’s t-test.In view of the strong autocorrelation of SST,the effective degrees of freedom are first estimated using the methods of Davis(1976)and Chen(1982),and this is then used to investigate the significance of the correlation or regression coefficients.Partial regression analysis is used to estimate the linkage between two variables of concern(e.g.,geopotential height and the SAMI)after linearly removing the effects of a third variable(e.g.,ENSO).All indices(e.g.,the SAMI)are standardized before regression analysis.The regression coefficients represent circulation anomalies corresponding to one standard deviation of the index,and can be used to determine the magnitude of circulation anomalies associated with the index.The Theil–Sen nonparametric estimation method,which is defined as the median of the slopes between all data pairs,is used to estimate the linear trend.The Theil–Sen method is insensitive to outliers,more accurate than simple linear regression,and a robust estimate of linear trends(Theil,1950;Sen,1968).The Mann–Kendall nonparametric test(Mann,1945;Kendall,1975)is used to assess the significance of the linear trends.High-pass filtering conducted in this study is based on the Lanczos filtering method(Duchon,1979).
The analysis period is 1980–2012,and the annual cycle is removed prior to the statistical analysis,except for the calculation of the annual mean.The definitions used for the four seasons are:austral summer(DJF),autumn(MAM),winter(JJA),and spring(SON).The correlation between two variables during DJF means that monthly data during DJF are used to conduct the correlation analysis.In other cases,results based on the seasonal or annual average datasets are clearly illustrated.
The location of the subtropical jet is defined as the latitude at which the strongest westerlies at 200 hPa occur,and the location of the polar jet is defined as the latitude with the strongest westerlies at 850 hPa.
2.3.Models
The framework of AGCM simulations provides a clear way to detect the responses of the atmospheric circulation to the oceans.CAM5,developed by NCAR,is used in this study.This model has a 96×144 horizontal grid and 30 hybrid vertical levels.A description of CAM5 is provided at http://www.cesm.ucar.edu/models/atm-cam/docs/description/description.pdf.The control run is performed with a prescribed annual SST cycle from a standard climatology.Another two idealized SST sensitivity experiments are also carried out with different imposed SSTAs,and these are described in section 4.1.Both the control and sensitivity simulations are run for 33 years,and only the last 30 years are analyzed to exclude the three-year spin-up period.
In addition,simulations from 28 AGCM models archived in CMIP5,called AMIP,covering the period 1979–2008,are also used in this study.The AMIP runs are forced by realistic SST and sea-ice data from 1979 to near present,and with external forcing as in the historical experiment,including carbon dioxide and ozone concentrations,solar forcing,and aerosols(Taylor et al.,2012).The AMIP runs allow theevaluation of the responses of the atmosphere to the observed SSTs and sea ice under historical external forcing.The statistics of the AMIP models used in this study are listed in Table 1.The horizontal resolutions differ among the models.Therefore,the outputs from these models are first interpolated to the same horizontal resolution(1.0°×1.0°)before the multi-model mean is calculated.
3.Dominant mode of SO SST variability
The climatological annual average SST over the SO is shown in Fig.1a.SST isotherms over the SO are generally orientated in a zonal circular pattern around the hemisphere,indicating that the lack of landmasses creates a strong zonal symmetry in SO SST.The positions of the APF and SAF are marked in Fig.1 by the position of the strongest meridional SST gradient.The zonal-mean positions of the APF and SAF are 55°S and 51°S,respectively.Zonal mean SST is defined as the zonal symmetric component,and the residual is defined as the zonal asymmetric component.Figures 1b and c show the ratio of variance in the SSTA explained by the zonally symmetric and zonally asymmetric components,respectively.Areas in which the variance explained by the zonally symmetric component is greater than 60%account for more than 70%of the entire area south of 30°S,and this indicates the zonally symmetric characteristic of the SSTA in the SH extratropics.
3.1.SOD
To detect the primary mode of the SO SST temporal variability,EOF analysis is performed on the seasonally averaged SO SSTA.Detrending and nine-year high-pass filtering are conducted before the EOF analysis.As shown in Fig.2a,a dipole structure exists across the southern middle and high latitudes,which is characterized by an equivalent zonally symmetric component.This EOF1 is generally consistent with the results of Ciasto and Thompson(2008),despite the differences in analysis periods.Areas with negative values are at high latitudes(∼ 60°S)around the Antarctic,and with positive values at middle latitudes(∼ 37.5°S)across almost all longitudes.As mentioned,we refer to the EOF1 as the SOD,and the dipole-like SSTA is hereafter referred to as the SOD-like SSTA.The dominant mode(EOF1)accounts for 19.4%of the total variance,and the second EOF(EOF2)explains 9.1%.The explained variances of the first four eigenvectors and the associated standard deviations of the sampling errors are shown in Fig.2b.According to the rule proposed by North et al.(1982),EOF1 is well separated from the residual EOFs,as indicated by the error bars.The spatial structure of the dominant mode derived from the monthly SSTA(not shown)is highly consistent with that seen at the seasonal scale(Fig.2a),with a pattern correlation greater than 0.95.This result implies that the SOD is stable across monthly and seasonal scales.
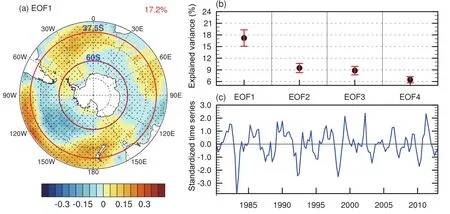
Fig.2.(a)EOF1 of SO SST(units:°C)from the EOF analysis of the seasonally averaged SO SSTA.The red number(top right)indicates the explained variance from the dominant modes.The stippling indicates statistical significance at the 95%confidence level.The red polylines mark 37.5°S and 60°S.(b)Fractional variance(units:%)explained by the first four EOF modes,and the associated sampling error standard deviations using the method of North et al.(1982).(c)Corresponding standardized time series of EOF1.
In addition,the EOF1 derived from ERSST.v3b(not shown)is similar to that based on the HadISST dataset.The explained variance of the dominant mode from ERSST.v3b is higher than that from HadISST,which may be attributable to the relatively low resolution of ERSST.v3b compared with HadISST.The pattern correlation between the dominant modes from these two datasets is greater than 0.80(significant at the 99%confidence level).Similarly,the PC1s obtained from HadISST and ERSST.v3b are in strong agreement,with correlation coefficients of 0.83 and 0.85(significant at the 99%confidence level)for monthly and seasonally averaged SSTA,respectively.As the Had ISST and ERSST.v3b datasets are produced using different data sources and analytical procedures,the consistency between them provides confidence in the analyzed leading temporal mode of SO SSTA.The following analysis uses mainly the results derived from HadISST because it has a higher horizontal resolution.
3.2.Zonal symmetry of the SOD
The SO SSTA is characterized by strong zonal symmetry.To detect the zonally symmetric component of the SOD more clearly,the EOF analysis is performed on the monthly zonal mean SO SSTA(not shown).The EOF1 shows a dipole-like structure between the southern middle and high latitudes.It is worth noting that the variance explained by EOF1 is more than 50%,implying that the EOF1 could explain more than half of the total variance in zonal-mean SSTA time variability.A similar EOF analysis is performed on the zonal-mean SSTA time variability south of 20°S(not shown).The EOF1 derived from the SSTA south of 20°S is in good agreement with the EOF1 derived from the SSTA south of 30°S,indicating that the EOF1 is insensitive to the selection of the midlatitude northern boundary in the EOF analysis.
Given that the EOF1 reflects a kind of relationship between the SSTA in the southern middle and high latitudes,and that the EOF1 accounts for a large proportion of the total variance in the zonal-mean SSTA,a significant negative correlation is expected to occur between the SSTA series from the middle and high latitudes.To test this hypothesis,cross correlation coefficients between the zonal-mean SSTA based on the monthly SSTA are calculated(not shown).It is found the SSTAs in the middle(30°–45°S)and high latitudes(55°–70°S)are indeed negatively correlated,which is a manifestation of the SOD signal.The strongest negative correlations occur at 60°S and 37.5°S,generally consistent with the results from the EOF analysis.The time series of the SSTA at 60°S and 37.5°S are shown in Fig.3 and reveal a clearly opposing variance,yielding a correlation coefficient of−0.43(significant at the 99%con fidence level).Due to this,we now de fine an SODI that is calculated as the difference between the standardized time series of the SSTA at 37.5°S and 60°S,and this reflects the negative correlation between the SSTA in the middle and high latitudes.The SODI is shown in Fig.3 together with PC1 from the EOF analysis of the monthly averaged SSTA.The SODI and PC1 are in good agreement,with a correlation coefficient of 0.75(significant at the 99%con fidence level).This highlights the strong zonal symmetry in the SOD,and indicates that the SODI can capture this temporal signal and is simpler due it being unnecessary to perform an EOF analysis to calculate it.Composite SST anomalies for positive and negative SODI with a threshold of±1.0 standard deviation based on monthly data are shown in Fig.4.The positive(negative)phase of the SODI is associated with positive(negative)SSTA values in the middle latitudes and negative(positive)SSTA values in the high latitudes.
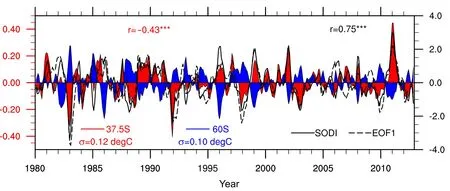
Fig.3.Left vertical axis:time series(units: °C)of the zonal-mean SSTA at 37.5°S(red filled line)and 60°S(blue filled line),with standard deviations of 0.12°C and 0.10°C,respectively.The correlation coefficient between them is−0.43 and the superscript“***”indicates statistical significance at the 99%confidence level.Right vertical axis:standardized time series of the SODI(black solid line)and PC1(black dashed line)from the EOF analysis of SO SST.The correlation coefficient between the SODI and PC1 is 0.75.
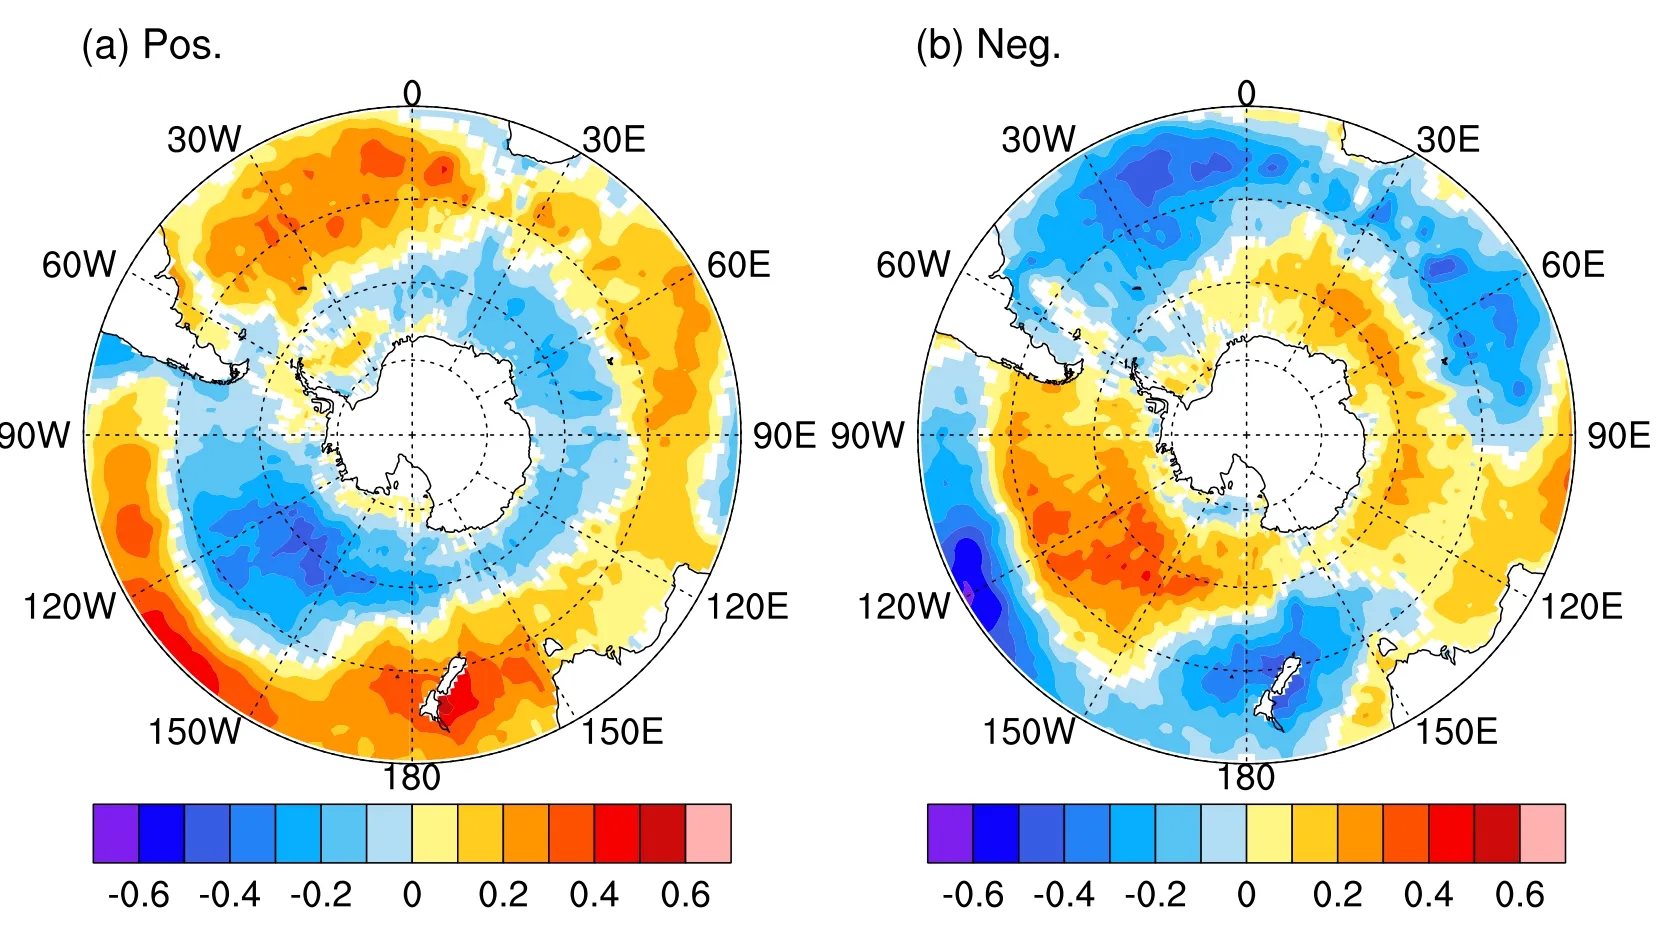
Fig.4.Composite SSTA for(a)positive and(b)negative SODI with a threshold of±1.0 standard deviation based on monthly data.Values non-significant at the 95%con fidence level are masked out in white.
These changes in the meridional SST pro file are expected to lead to changes in the meridional SST gradient.The correlation between the SODI and meridional SST gradient is shown in Fig.5a.A positive correlation occurs in the region between 40°S and 60°S,whereas a negative correlation occurs north of 35°S and south of 62°S.This correlation field indicates that the meridional gradient is strengthened(weakened)in the domain between 40°S and 60°S when the SOD is in a positive(negative)phase,and thus both the APF and SAF are strengthened(weakened),especially the APF.The EOF1 of the SO SST meridional gradient,derived from the EOF analysis of the SO SST meridional gradient,is shown in Fig.5b,together with the regression of the meridional gradient against the SODI.The two curves are in good agreement,indicating that the primary variability of the large-scale SO SST meridional gradient is related to the SODI phases.

Fig.5.(a)Correlation coefficients between the meridional SST gradient and SODI(left vertical axis;gray filled line).The black dashed lines represent the 95%con fidence levels,and the green solid line represents the climatological meridional SST gradient(right vertical axis;units:10−6 °C m−1).Also shown are the zonal-mean positions of the APF(red dash-dot line)and SAF(purple dash-dot line).(b)Dominant mode of the SO SST meridional gradient(blue line;units:10−6°C m−1)and the regression of the meridional gradient of SO SST on the SODI(red line;units:10−6 °C m−1).Thick sections of the lines indicate statistical significance at the 95%confidence level.
In spite of the strong zonal symmetry,differences also exist in the distribution of the areas of homogeneity associated to the SODI in the different basins.EOF analysis is also performed on the regional zonal-mean SSTA over the southern Pacific Ocean,southern Indian Ocean,and southern Atlantic Ocean(not shown).It is worth noting that the correlation coefficients between the PC1 from the southern Pacific Ocean,southern Indian Ocean,and SO SST are also higher than 0.6(significant at the 99%confidence level).Furthermore,the correlations between the PC1 from the southern Pacific Ocean,southern Atlantic Ocean,and southern Indian Ocean SST are significant,indicating a close connection between the leading modes in these ocean basins,and demonstrating the consistency in SST variability among these basins.
4.Influence of the SOD-like SSTA on SH extratropical atmospheric circulation
4.1.Idealized AGCM simulations using CAM5
To explore the in fluence of the SOD-like SSTA on the SH extratropical atmospheric circulation,two idealized SST sensitivity runs corresponding to the positive(SOD POS)and negative(SOD NEG)phases of the SOD,as well as one control run(CTL),are carried out using NCAR CAM5.In CTL,an annual SST cycle from a standard climatology is prescribed.In the sensitivity experiments,SOD POS and SOD NEG,SSTA perturbations as shown in Fig.6a are imposed on the DJF SST field to evaluate the contemporaneous responses of DJF circulation to the DJF SOD.
The response of the atmospheric circulation to the positive(negative)SOD SSTA is quanti fied using the differences between SOD POS(SODNEG)and CTL.As shown in Figs.6b and c,significant changes are evident in the DJF mass stream function in the SH extratropics in response to the DJF SOD-like SSTA.Local atmospheric responses to the positive phase of the SOD-like SSTA consist of two opposite meridional circulations:an anomalous clockwise cell in the region 65°–50°S,and an anomalous counterclockwise cell between 50°S and 35°S(Fig.6b).Anomalous descent occurs around 50°S,accompanied by anomalous ascent around 35°S and 65°S.The meridional circulation anomalies during the negative phase of the SOD-like SSTA(Fig.6c)are quasi-symmetric to those during the positive phase(Fig.6b).As the climatological Ferrel cell is located between 65°S and 35°S,with its center around 50°S,the meridional circulation anomalies related to the SOD-like SSTA imply that the Ferrel cell shifts towards the Antarctic(tropics),when the SSTA is negative(positive)around the Antarctic.
Figure 6d shows the response of the zonal-mean zonal wind to the positive phase of the SOD-like SSTA.The westerlies strengthen around 60°S but weaken around 40°S,and this corresponds to the positive SOD phase and implies a poleward shift of the polar jet associated with the shift of the Ferrel cell.Meanwhile,in the upper troposphere(200 hPa),the subtropical jet exhibits a slightly poleward shift.The zonal wind anomalies related to the SOD feature a quasi-barotropic structure,and strengthened and weakened westerlies develop around 60°S and 40°S in the entire atmospheric vertical column from the surface to the upper troposphere.The zonal wind anomalies corresponding to the negative phase of the SOD-like SSTA(Fig.6e)are generally opposite to those corresponding to the positive phase(Fig.6d).The significant responses of the zonal wind and meridional circulation to the SOD-like SSTA suggest that the SO SSTA plays a nonnegligible role in affecting SH extratropical circulation during DJF.
4.2.Results from the 28 AMIP models
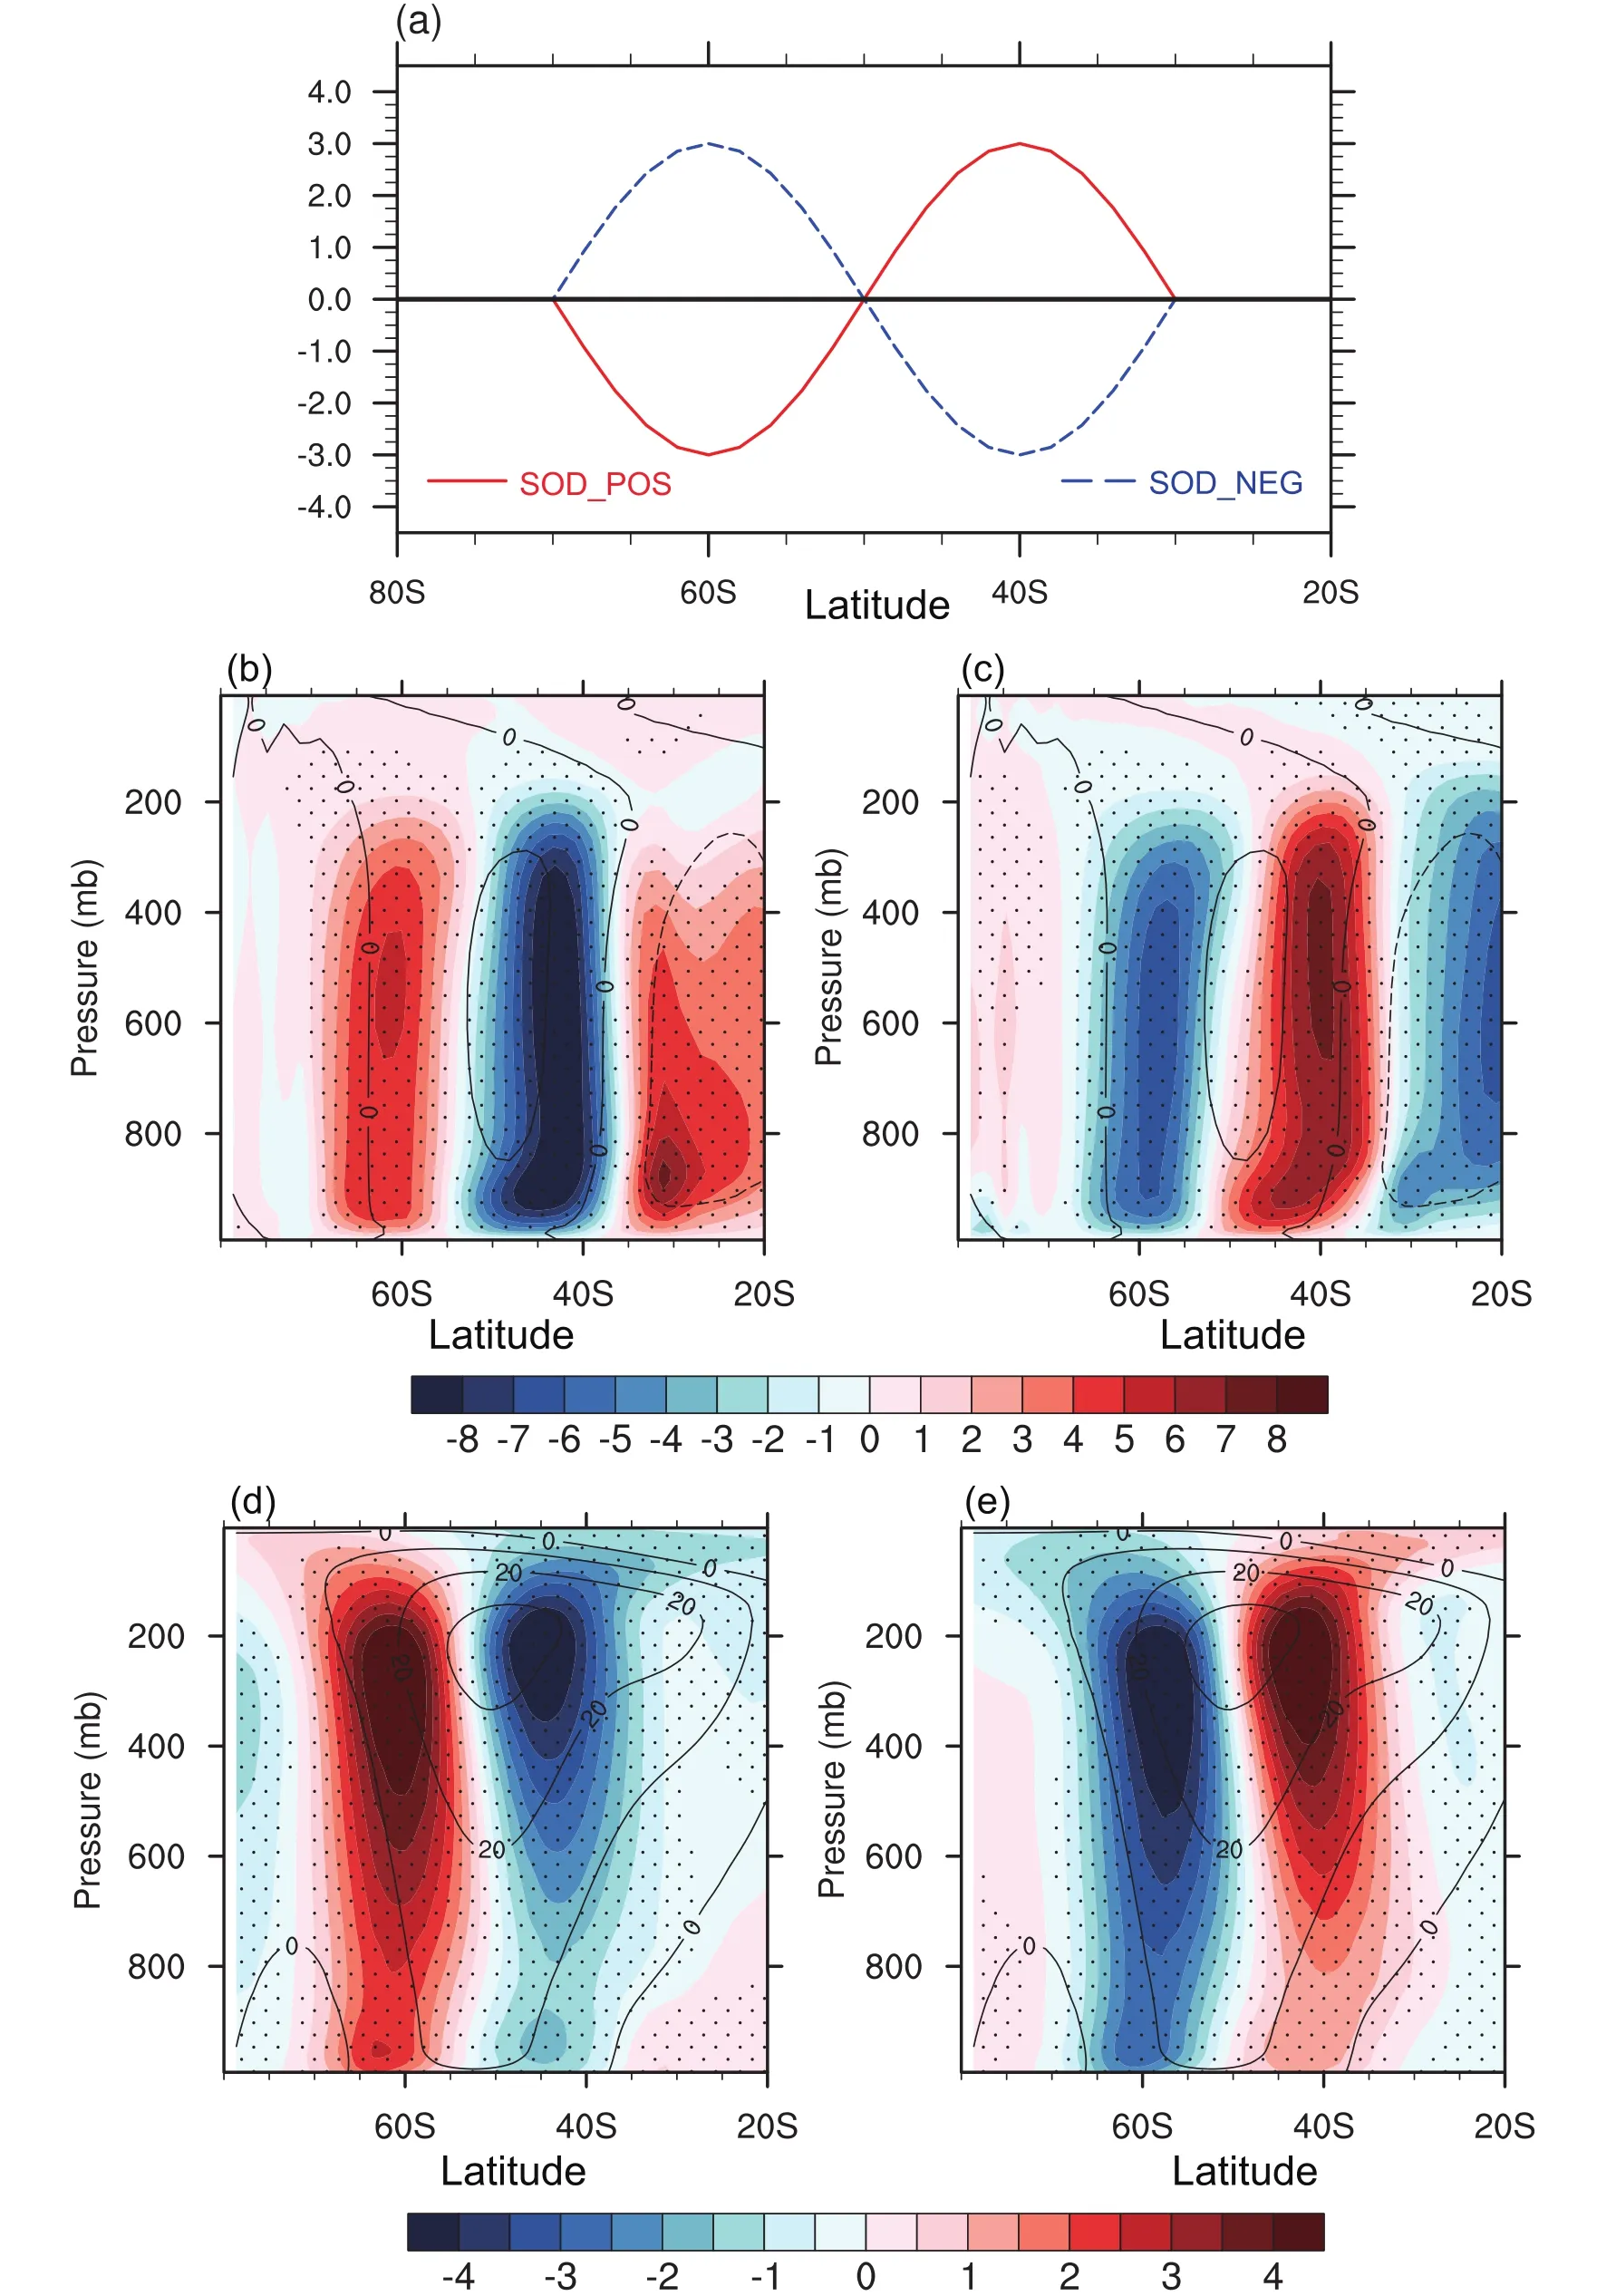
Fig.6.(a)Distribution of the imposed DJF SSTA(units:°C)for the idealized sensitivity experiments using CAM5.Descriptions of the sensitivity experiments(SOD POS,SODNEG)can be found in section 4.1.(b–e)Responses of the DJF zonal mean(b,c)stream function(units:109kg s−1)and(d,e)zonal wind(units:m s−1)to the SOD-like SSTA quantified by the differences between the(b,d)SODPOS,(c,e)SODNEG and the CTL runs.Stippling indicates significance at the 95%confidence level.The contours represent the climatological zonal mean stream function(units:109kg s−1)and zonal wind(units:m s−1)in the CTL run.
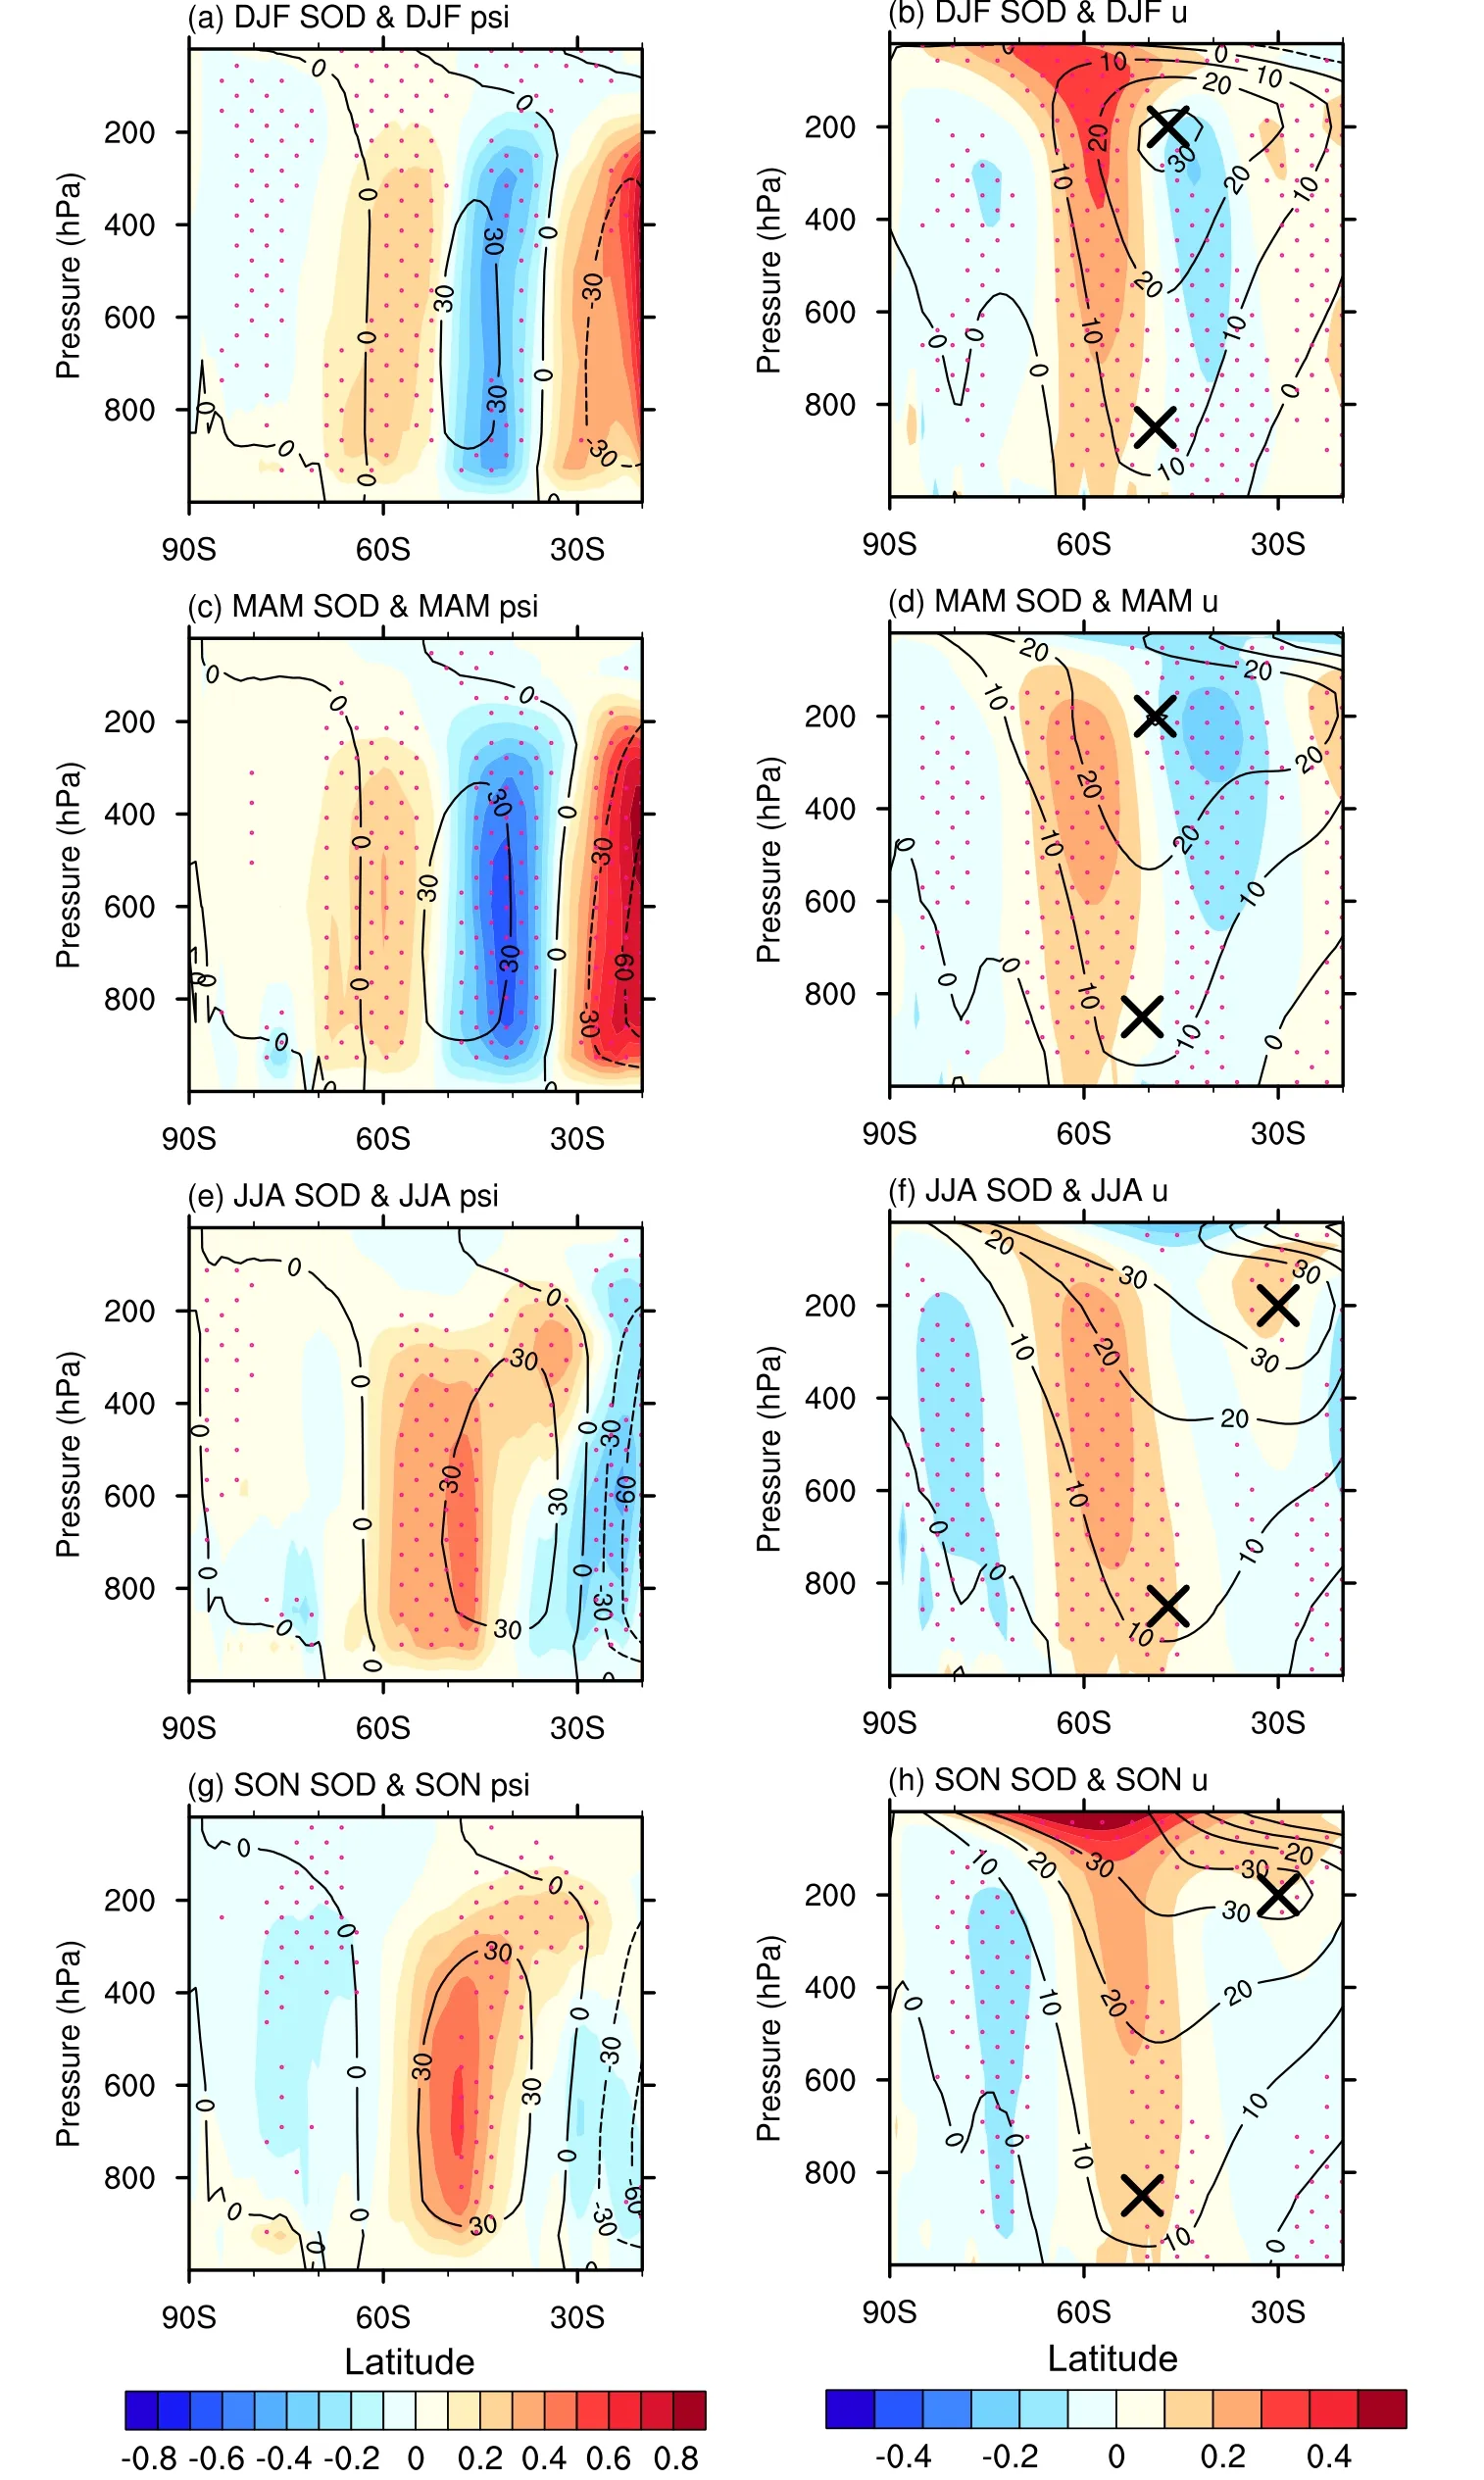
Fig.7.Multi-model mean of the partial regression of the zonal mean stream function(left;units:109kg s−1)and zonal wind(right;units:m s−1)on the SODI after removing the ENSO signal during(a,b)DJF,(c,d)MAM,(e,f)JJA,and(g,h)SON,derived from the AMIP models.Stippling indicates significant values,deifned as when 18 of the 28 models have the same sign as the multi-model mean.The contours represent the climatological zonal mean stream function(units:109kg s−1)and zonal wind(units:m s−1).The crosses in the right-hand panels indicate the locations of the subtropical jet(200 hPa)and the polar jet(850 hPa).
To further analyze the relationship bet ween the DJFSOD-like SSTA and the contemporaneous SH extratropical atmospheric circulation,and to cross-validate the results from CAM5,the outputs from the 28 AMIP models listed in Table 1 are investigated.Figures 7a and b show the multi-model mean of the partial regression of the DJF mass stream function and zonal wind on the DJFSODI after removing the DJF ENSO signal.Partial regression is used to exclude the influence of the ENSO-related SSTA on SH extratropical circulation in the AMIP simulations.An anomalous clockwise cell in the region 65°–50°S,and an anomalous counterclockwise cell in the region 50°–35°S,are clearly evident in Fig.7a,suggesting a poleward shift of the Ferrel cell accompanied by a significant poleward shift of the polar jet and a slight poleward shift of the subtropical jet(Fig.7b),which is consistent with the results derived from SST sensitivity experiments using CAM5 and provides multi-model evidence for the role of the SOD-like SSTA in influencing the SH extratropical circulation during DJF.The acceleration of the westerlies at high latitudes around 60°S corresponding to one standard deviation of the SODI is about 0.3–0.4 m s−1.
The responses of SH extratropical circulation that can be teleconnected with changes in the SSTA associated with the SODI in other seasons are also presented in Fig.7.Circulation anomalies related to the SOD-like SSTA during MAM(Figs.7c and d)are similar to those during DJF(Figs.7a and b).Quasi-barotropic characteristics are also evident in the zonal wind anomalies associated with the SOD-like SSTA.One difference is that the counter clock wise cell bet ween50°S and 35°S is relatively stronger during MAM.Accordingly,the weakening amplitude of the westerlies around 40°S is larger during MAM.
The other panels in Fig.7 show the circulation anomalies related to the SOD during JJA and SON.In these two seasons,atmospheric responses to the SOD-like SSTA phases differ obviously from those during DJF and MAM.During DJF and MAM,an anomalous clockwise circulation develops around 65°–50°S(Figs.7a and c).During JJA and SON,this anomalous clockwise circulation is located at relatively lower latitudes in the range 60°–40°S(Figs.7e and g).As the climatological Ferrel cell during the JJA and SON seasons is located between 65°S and 30°S,the circulation anomalies related to the SOD imply that the Ferrel cell strengthens(weakens)in a positive(negative)SOD phase.The anomalous accelerated westerlies are located around 55°–50°S during JJA and SON(Figs.7f and h),which is farther north than the 60°S seen in DJF and MAM(Figs.7b and d).Taking the climatological location of the polar jet into consideration,zonal wind anomalies related to the SOD re flect mainly the strengthening(weakening)of the polar jet corresponding to the positive(negative)SOD phase.Regarding the zonal wind anomalies around the subtropical jet(30°S),unlike the quasi-barotropic structure during DJF and MAM,the zonal wind anomalies during JJA and SON are baroclinic.At 200 hPa,the westerlies around the subtropical jet(30°S)tend to strengthen(weaken),in a positive(negative)SOD phase.

Fig.8.Multi-model mean of the partial regression of the zonal mean SLP(units:Pa)on the SOD(blue line)and SAM(red line)indices after removing the ENSO signal during(a)DJF,(b)MAM,(c)JJA,and(d)SON,derived from the AMIP models.The thick lines indicate signi ficant values,defined as when 18 of the 28 models have the same sign as the multi-model mean.
Figure 8 shows the zonal-mean SLP regressed onto the contemporaneous SOD.Similar to Fig.7,the response of SLP to the SOD-like SSTA differs among the seasons.The peaks of the positive anomalies in middle latitudes are located farther north during JJA than those during DJF,which is consistent with the response of the meridional circulation.Variability in large-scale zonal-mean precipitation is closely correlated with atmospheric vertical motion associated with the meridional circulation.In view of the signi ficant relationship between the SH extratropical meridional circulation and the SODI,it is expected that it could be useful to determine some zonal-mean precipitation anomalies in the SH extratropics related to the SODI phases.The multi-model mean of the partial regression of zonal mean precipitation on the SODI after removing the ENSO signal is shown in Fig.9.During DJF and MAM,positive precipitation anomalies tend to occur around 35°S and 60°S corresponding to a positive phase of SODI,while negative precipitation anomalies tend to occur around 50°S.During JJA and SON,the response of precipitation to the SOD around 60°S still follows an increasing trend,while precipitation around 35°S decreases.
The multi-model results in Figs.7–9 show that the significant influence of the SOD-like SSTA on SH extratropical circulation is evident not only during DJF and MAM,as suggested by previous studies,but also during JJA and SON.However,influence of the SOD-like SSTA on SH extratropical circulation exhibits obvious seasonal differences.Figure 10 shows a schematic illustration of the anomalous SH extratropical zonal-mean meridional circulation related to the SOD-like SSTA during DJF and JJA.It is known that the con figuration of the polar jet and the subtropical jet in the SH changes with the seasons.During DJF,the polar jet and the subtropical jet tend to merge and the latitudes of these two jets are not clearly separated.In this season,the Ferrel cell and the polar jet tend to shift toward the Antarctic during the positive phase of the SODI,and this is accompanied by a poleward shift of the subtropical jet.During JJA,the polar jet and the subtropical jet split into two latitudinally well separated jets.In this season,the Ferrel cell and the polar jet strengthen during the positive phase of the SODI,and are accompanied by a strengthened subtropical jet.
Also shown in Fig.8 are the SLP anomalies associated with the contemporaneous SAMI.Compared with the circulation anomalies associated to the SODI,the SLP anomalies related to the SAM are relatively stable among the different seasons.The transition bet we en the positive and negative SLP anomalies is located around 55°S in all four seasons.The SOD-related and SAM-related SLP anomalies are close to each other in JJA and SON.During these periods,negative SLP anomalies develop in high latitudes while positive SLP anomalies develop in middle latitudes.A significant correlation between the SAM and SOD in dices exists during JJA,yielding a correlation of 0.44,and this indicates the significant influence of the SOD-like SSTA on the SAM-related circulation.As the surface wind anomalies associated with the SAMI is an important factor in the modulation of SOD-like SSTA variability through both dynamic and thermodynamic processes(e.g.,Watterson,2000;Marshall et al.,2001;Cai and Watterson,2002;Hall and Visbeck,2002;Visbeck et al.,2003;Lefebvre et al.,2004;Sen Gupta and England,2006;Ciasto and Thompson,2008;Wu et al.,2009;Thompson et al.,2011),the significant correlation between the SODI and the SAMI derived from the AMIP simulations suggests that the SOD-like SSTA could feed back to zonal wind anomalies associated with the SAMI.In DJF and MAM,the SLP anomalies related to the SOD and those related to the SAM exhibit relatively greater differences than those in JJA and SON(Fig.8).The SLP anomalies related to the SOD show a tripolar structure,with positive SLP anomalies around 50°S accompanied by negative SLP anomalies on both sides.This differs from those related to the SAM,which exhibit a dipolelike structure with lower and higher SLP in high and middle latitudes,respectively.
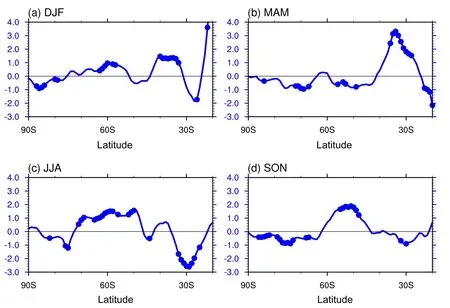
Fig.9.As Fig.8 but for the zonal mean precipitation(units:10−7kg m−2s−1).
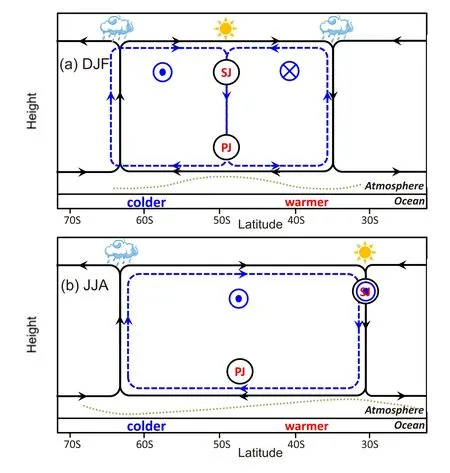
Fig.10.Schematic representation of the responses of SH extratropical zonal mean circulation to the SOD-like SSTA during(a)DJF and(b)JJA.The black lines represent the climatological circulation.The blue dashed and green dotted lines represent the SOD-related meridional circulation and SLP anomalies,respectively.The abbreviations “SJ”and “PJ”indicate the subtropical jet and polar jet,respectively.The symbols of the sun and the cloud indicate increased and reduced precipitation,respectively.The blue symbol of a dot(cross)centered inside a circle means west(east)wind anomalies.
The multi-model mean is used in the above analysis because it reduces internal variability and concentrates on the responses of atmospheric circulation to the corresponding SST forcing(e.g.,Bracco et al.,2004;Deser et al.,2012).It is important to note that models show a spread in simulating the correlation between the SODI and the SAMI.Model differences in simulating the relationship between the SODI and the SAMI during DJF are larger than those during JJA(not shown),which may contribute to the fact that the multi-model mean correlation between the SAM and the SOD in dices is weaker in DJF than that in JJA.Further work is needed if we are to better evaluate and explain the model uncertainty associated with simulating the influence of the SOD-like SSTA on SH extratropical circulation.
5.Discussion and conclusions
The variability in the SO SSTA has drawn increased attention due to its unique physical features.The EOF1 of the SO SSTA shows a dipole-like structure,referred to as the SOD,which accounts for about 19%of total SSTA variance.The SOD represents a hemispheric-wide negative correlation of the SSTA between the middle and high latitudes,with the strongest negative correlations occurring at 37.5°S and 60°S.The results of this study reveal that the spatial pattern of the SOD features strong zonal symmetry,and the SOD signal accounts for more than 50%of total zonal-mean SSTA variability.
A simple SODI,defined as the difference between the standardized SSTA series at 37.5°S and 60°S,captures the SOD variability reasonably well.When the SODI is in a positive(negative)phase,the SAF and APF are strengthened(weakened).Although there are seasonal variations in the SOD spatial pattern,the locations of the middle-and high-latitude branches,where the strongest negative correlations occur,are relatively stable.
Results from numerical simulations indicate that the SOD-like SSTA plays a non-negligible role in affecting SH extratropical atmospheric circulation and the influences exhibit seasonal differences.During DJF,the Ferrel cell and the polar jet shift toward the Antarctic due to changes in the SSTA that could be associated with a positive SODI,and this is accompanied by a poleward shift of the subtropical jet.During JJA,the Ferrel cell and the polar jet strengthen in response to the SSTA corresponding to the positive SODI,and this is accompanied by a strengthened subtropical jet.These seasonal differences are linked to the seasonal differences in con figuration of the polar jet and the subtropical jet in the SH.
Finally,the focus of the present study is the zonal mean components,because the SOD variability shows clear zonally symmetrical characteristics.Although the effect of the zonally asymmetrical component is not explored in the present study,this should not be taken to imply that the zonally asymmetrical component is unimportant,and it cannot be ruled out in reality.In particular,a subtropical dipole mode has been identified as the prominent mode in the SH subtropical ocean,manifesting itself as a global wavenumber-3 subtropical dipole SST pattern and inherently existing as a thermodynamically coupled mode in the subtropical ocean–atmosphere coupled system(Wang,2010a,2010b).In the South Pacific,two seasonally evolving dominant modes of SST can also be found(Li et al.,2012).Taking these important unique features of SH extratropical SST variability into account,further work will be needed if we are to understand the regional differences in SH extratropical SST and its relative importance in influencing SH extratropical atmospheric circulation.
Acknowledgements.The authors would like to thank the editor and the anonymous reviewers for their comments and suggestions,which signi ficantly contributed to improving the manuscript.This work was jointly supported by a National Natural Science Foundation of China NSFC project(Grant No.41405086),the strategic priority research program grant of the Chinese Academy of Sciences(Grant No.XDA19070402),and the NSFC projects(41775090,41705049).The NCEP/NCAR atmospheric reanalysis datasets are available at http://www.esrl.noaa.gov/psd/.We acknowledge the World Climate Research Programme’s Working Group on Coupled Modelling,which is responsible for CMIP,and we thank the climate modeling groups for producing and making available their model output.
REFERENCES
Bracco,A.,F.Kucharski,R.Kallummal,and F.Molteni,2004:Internal variability,external forcing and climate trends in multi-decadal AGCM ensembles.Climate Dyn.,23,659–678,https://doi.org/10.1007/s00382-004-0465-2.
Cai,W.J.,and I.G.Watterson,2002:Modes of interannual variability of the Southern Hemisphere circulation simulated by the CSIRO climate model.J.Climate,15,1159–1174,https://doi.org/10.1175/1520-0442(2002)015<1159:MOIVOT>2.0.CO;2.
Chen,W.Y.,1982:Fluctuations in northern hemisphere 700 mb height field associated with the Southern Oscillation.Mon.Wea.Rev.,110,808–823,https://doi.org/10.1175/1520-0493(1982)110<0808:FINHMH>2.0.CO;2.
Chiang,J.C.H.,and C.M.Bitz,2005:Influence of high latitude ice cover on the marine Intertropical Convergence Zone.Climate Dyn.,25,477–496,https://doi.org/10.1007/s00382-005-0040-5.
Ciasto,L.M.,and D.W.J.Thompson,2008:Observations of large–scale ocean–atmosphere interaction in the southern hemisphere.J.Climate,21,1244–1259,https://doi.org/10.1175/2007JCLI1809.1.
Compagnucci,R.H.,and M.B.Richman,2007:Can principal component analysis provide atmospheric circulation or teleconnection patterns?International Journal of Climatology,28,703–726,https://doi.org/10.1002/joc.1574.
Davis,R.E.,1976:Predictability of sea surface temperature and sea level pressure anomalies over the North Pacific Ocean.J.Phys.Oceanogr.,6,249–266,https://doi.org/10.1175/1520-0485(1976)006<0249:POSSTA>2.0.CO;2.
Deser,C.,A.Phillips,V.Bourdette,and H.Y.Teng,2012:Uncertainty in climate change projections:The role of internal variability.Climate Dyn.,38,527–546,https://doi.org/10.1007/s00382-010-0977-x.
Duchon,C.E.,1979:Lanczos filtering in one and two dimensions.J.Appl.Meteor.,18,1016–1022,https://doi.org/10.1175/1520-0450(1979)018<1016:LFIOAT>2.0.CO;2.
Gong,D.Y.,and S.W.Wang,1999:Definition of Antarctic Oscillation index.Geophys.Res.Lett.,26,459–462,https://doi.org/10.1029/1999GL900003.
Hall,A.,and M.Visbeck,2002:Synchronous variability in the Southern Hemisphere atmosphere,sea ice,and ocean resulting from the annular mode.J.Climate,15,3043–3057,https://doi.org/10.1175/1520-0442(2002)015<3043:SVITSH>2.0.CO;2.
Hartmann,D.L.,and F.Lo,1998:Wave-driven zonal flow vacillation in the Southern Hemisphere.J.Atmos.Sci.,55,1303–1315,https://doi.org/10.1175/1520-0469(1998)055<1303:WDZFVI>2.0.CO;2.
Hu,C.D.,Q.G.Wu,S.Yang,Y.H.Yao,D.Chan,Z.N.Li,and K.Q.Deng,2016:A linkage observed between austral autumn Antarctic Oscillation and preceding Southern Ocean SST anomalies.J.Climate,29,2109–2122,https://doi.org/10.1175/JCLI-D-15-0403.1.
Hwang,Y.T.,and D.M.W.Frierson,2013:Link between the double–intertropical convergence zone problem and cloud biases over the Southern Ocean.Proceedings of the National Academy of the United States of America,110,4935–4940,https://doi.org/10.1073/pnas.1213302110.
Kang,S.M.,D.M.W.Frierson,and I.M.Held,2009:The tropical response to extratropical thermal forcing in an idealized GCM:The importance of radiative feedbacks and convective parameterization.J.Atmos.Sci.,66,2812–2827,https://doi.org/10.1175/2009JAS2924.1.
Kang,S.M.,I.M.Held,D.M.W.Frierson,and M.Zhao,2008:The response of the ITCZ to extratropical thermal forcing:Idealized slab–ocean experiments with a GCM.J.Climate,21,3521–3532,https://doi.org/10.1175/2007JCLI2146.1.
Kendall,M.G.1975.Rank Correlation Methods.4th ed.,Charles Griffin,London.
Kidson,J.W.,and I.G.Watterson,1999:The structure and predictability of the “high-latitude mode”in the CSIRO9 general circulation model.J.Atmos.Sci.,56,3859–3873,https://doi.org/10.1175/1520-0469(1999)056<3859:TSAPOT>2.0.CO;2.
Kucharski,F.,and F.Molteni,2003:On non-linearities in a forced North Atlantic Oscillation.Climate Dyn.,21,677–687,https://doi.org/10.1007/s00382-003-0347-z.
Kushnir,Y.,W.A.Robinson,I.Blad´e,N.M.J.Hall,S.Peng,and R.Sutton,2002:Atmospheric GCM response to extratropical SST anomalies:Synthesis and evaluation.J.Climate,15,2233–2256,https://doi.org/10.1175/1520-0442(2002)015<2233:AGRTES>2.0.CO;2.
Lefebvre,W.,H.Goosse,R.Timmermann,and T.Fichefet,2004:In fluence of the southern annular mode on the sea ice–ocean system.J.Geophys.Res.,109,C09005,https://doi.org/10.1029/2004JC002403.
Li,G.,C.Y.Li,Y.K.Tan,and T.Bai,2012:Seasonal evolution of dominant modes in South Pacific SST and relationship with ENSO.Adv.Atmos.Sci.,29,1238–1248,https://doi.org/10.1007/s00376-012-1191-z.
Li,J.P.,and J.X.L.Wang,2003:A modi fied zonal index and its physical sense.Geophys.Res.Lett.,30,1632,https://doi.org/10.1029/2003GL017441.
Li,S.L.,M.P.Hoerling,and S.L.Peng,2006:Coupled oceanatmo sphere response to Indian Ocean warmth.Geophys.Res.Lett.,33,L07713,https://doi.org/10.1029/2005GL025558.
Liu,J.P.,and J.A.Curry,2010:Accelerated warming of the Southern Ocean and its impacts on the hydrological cycle and sea ice.Proceedings of the National Academy of the United States of America,107,14987–14992,https://doi.org/10.1073/pnas.1003336107.
Liu,T.,J.P.Li,and F.Zheng,2015:Influence of the boreal autumn southern annular mode on winter precipitation over land in the Northern Hemisphere.J.Climate,28,8825–8839,https://doi.org/10.1175/JCLI-D-14-00704.1.
Liu,Z.Y.,and H.J.Yang,2003:Extratropical control of tropical climate,the atmospheric bridge and oceanic tunnel.Geophys.Res.Lett.,30,https://doi.org/10.1029/2002GL016492.
Liu,Z.Y.,S.I.Shin,B.Otto–Bliesner,J.E.Kutzbach,E.C.Brady,and D.E.Lee,2002:Tropical cooling at the last glacial maximum and extratropical ocean ventilation.Geophys.Res.Lett.,29,48-1–48-4,https://doi.org/10.1029/2001GL013938.
Lorenz,D.J.,and D.L.Hartmann,2001:Eddy–zonal flow feedback in the Southern Hemisphere.J.Atmos.Sci.,58,3312–3327,https://doi.org/10.1175/1520-0469(2001)058<3312:EZFFIT>2.0.CO;2.
Mann,H.B.,1945:Nonparametric tests against trend.Econometrica,13,245–259,https://doi.org/10.2307/1907187.
Marshall,J.,H.Johnson,and J.Goodman,2001:A study of the interaction of the North Atlantic Oscillation with ocean circulation.J.Climate,14,1399–1421,https://doi.org/10.1175/1520-0442(2001)014<1399:ASOTIO>2.0.CO;2.
Nakamura,H.,T.Sampe,A.Goto,W.Ohfuchi,and S.P.Xie,2008:On the importance of midlatitude oceanic frontal zones for the me an state and dominant variability in the tropospheric circulation.Geophys.Res.Lett.,35,L15709,https://doi.org/10.1029/2008GL034010.
Nan,S.L.,and J.P.Li,2003:The relationship between the summer precipitation in the Yangtze River valley and the boreal spring Southern Hemisphere annular mode.Geophys.Res.Lett.,30,2266.https://doi.org/10.1029/2003GL018381.
North,G.R.,T.L.Bell,R.F.Cahalan,F.J.Moeng,1982:Sampling errors in the estimation of empirical orthogonal functions.Mon.Wea.Rev.,110,699–706,https://doi.org/10.1175/1520-0493(1982)110<0699:SEITEO>2.0.CO;2.
Ogawa,F.,N.E.Omrani,K.Nishii,H.Nakamura,and N.Keenlyside,2015:Ozone-induced climate change propped up by the Southern Hemisphere oceanic front.Geophys.Res.Lett.,42,10 056–10 063,https://doi.org/10.1002/2015GL066538.
Ogawa,F.,H.Nakamura,K.Nishii,T.Miyasaka,and A.Kuwano-Yoshida,2016:Importance of midlatitude oceanic frontal zones for the annular mode variability:Interbasin differences in the southern annular mode signature.J.Climate,29,6179–6199,https://doi.org/10.1175/JCLI-D-15-0885.1.
Orsi,A.H.,T.Whit worth III,and W.D.Nowlin Jr.,1995:On the meridional extent and fronts of the Antarctic Circumpolar Current.Deep Sea Research Part I:Oceanographic Research Papers,42,641–673,https://doi.org/10.1016/0967-0637(95)00021-W.
Sampe,T.,H.Nakamura,A.Goto,and W.Ohfuchi,2010:Significance of a midlatitude SST frontal zone in the formation of a storm track and an eddy-driven westerly jet.J.Climate,23,1793–1814,https://doi.org/10.1175/2009JCLI3163.1.
Sen Gupta,A.,and M.H.England,2006:Coupled ocean–atmosphere–ice response to variations in the Southern Annular Mode.J.Climate,19,4457–4486,https://doi.org/10.1175/JCLI3843.1.
Sen Gupta,A.,and M.H.England,2007:Coupled oceanatmosphere feedback in the southern annular mode.J.Climate,20,3677–3692,https://doi.org/10.1175/JCLI4200.1.
Sen,P.K.,1968:Estimates of the regression coefficient based on Kendall’s tau.Journal of the American Statistical Association,63,1379–1389,https://doi.org/10.1080/01621459.1968.10480934.
Swann,A.L.S.,I.Y.Fung,and J.C.H.Chiang,2012:Midlatitude afforestation shifts general circulation and tropical precipitation.Proceedings of the National Academy of Sciences of the United States of America,109,712–716,https://doi.org/10.1073/pnas.1116706108.
Taylor,K.E.,R.J.Stouffer,and G.A.Meehl,2012:An overview of CMIP5 and the experiment design.Bull.Amer.Meteor.Soc.,93,485–498,https://doi.org/10.1175/BAMS-D-11-00094.1.
Theil,H.,1950:A rank-invariant method of linear and polynomial regression analysis.Nederl.Akad.Wetensch.Proc.,53,386–392.
Thompson,D.W.J.,and J.M.Wallace,2000:Annular modes in the extratropical circulation.Part I:Month-to-month variability.J.Climate,13,1000–1016,https://doi.org/10.1175/1520-0442(2000)013<1000:AMITEC>2.0.CO;2.
Thompson,D.W.J.,S.Solomon,P.J.Kushner,M.H.England,K.M.Grise,and D.J.Karoly,2011:Signatures of the Antarctic ozone hole in Southern Hemisphere surface climate change.Nature Geoscience,4,741–749,https://doi.org/10.1038/ngeo 1296.
Visbeck,M.,E.P.Chassignet,R.G.Curry,T.L.Delworth,R.R.Dickson,and K.Krahmann,2003:The Ocean’s response to North Atlantic Oscillation variability.The North Atlantic Oscillation:Climatic Signi ficance and Environmental Impact,J.W.Hurrell,Y.Kushnir,G.Ottersen,and M.Visbeck,Eds.,American Geophysical Union,https://doi.org/10.1029/134GM06.
Wang,F.,2010a:Subtropical dipole mode in the Southern Hemi-sphere:A global view.Geophys.Res.Lett.,37,L10702,https://doi.org/10.1029/2010GL042750.
Wang,F.M.,2010b:Thermodynamic coupled modes in the tropical atmosphere-ocean:An analytical solution.J.Atmos.Sci.,67,1667–1677,https://doi.org/10.1175/2009JAS3262.1.
Watterson,I.G.,2000:Southern midlatitude zonal wind vacillation and its interaction with the ocean in GCM simulations.J.Climate,13,562–578,https://doi.org/10.1175/1520-0442(2000)013<0562:SMZWVA>2.0.CO;2.
Wu,L.X.,Z.Y.Liu,C.Li,and Y.Sun,2007:Extratropical control of recent tropical Pacific decadal climate variability:A relay teleconnection.Climate Dyn.,28,99–112,https://doi.org/10.1007/s00382-006-0198-5.
Wu,Q.G.,and X.D.Zhang,2011:Observed evidence of an impact of the Antarctic sea ice dipole on the Antarctic Oscillation.J.Climate,24,4508–4518,https://doi.org/10.1175/2011JCLI3965.1.
Wu,Z.W.,J.Dou,and H.Lin,2015:Potential influence of the November–December Southern Hemisphere annular mode on the East Asian winter precipitation:a new mechanism.Climate Dyn.,44,1215–1226,https://doi.org/10.1007/s00382-014-2241-2.
Wu,Z.W.,J.P.Li,B.Wang,and X.H.Liu,2009:Can the Southern Hemisphere annular mode affect China winter monsoon?J.Geophys.Res.,114,D11107,https://doi.org/10.1029/2008 JD011501.
Xiao,B.,Y.Zhang,X.Q.Yang,and Y.Nie,2016:On the role of extratropical air-sea interaction in the persistence of the Southern Annular Mode.Geophys.Res.Lett.,43,8806–8814,https://doi.org/10.1002/2016GL070255.
Yamazaki,K.,and M.Watanabe,2015:Effects of extratropical warming on ENSO amplitudes in an ensemble of a coupled GCM.Climate Dyn.,44,679–693,https://doi.org/10.1007/s00382-014-2145-1.
Yang,H.J.,and L.Wang,2008:Estimating the nonlinear response of tropical ocean to extratropical forcing in a coupled climate model.Geophys.Res.Lett.,35,L15705,https://doi.org/10.1029/2008GL034256.
Yang,H.J.,and L.Wang,2011:Tropical oceanic response to extratropical thermal forcing in a coupled climate model:A comparison between the Atlantic and Pacific Oceans.J.Climate,24,3850–3866,https://doi.org/10.1175/2011JCLI3927.1.
Zhang,Q.,H.J.Yang,Y.F.Zhong,and D.X.Wang,2005:An idealized study of the impact of extratropical climate change on El Ni˜no–Southern Oscillation.Climate Dyn.,25,869–880,https://doi.org/10.1007/s00382-005-0062-z.
Zheng,F.,J.P.Li,L.Wang,F.Xie,and X.F.Li,2015:Cross-seasonal influence of the December–February Southern Hemisphere annular mode on March–May meridional circulation and precipitation.J.Climate,28,6859–6881,https://doi.org/10.1175/JCLI-D-14-00515.1.
杂志排行
Advances in Atmospheric Sciences的其它文章
- Persistence of Summer Sea Surface Temperature Anomalies in the Midlatitude North Pacific and Its Interdecadal Variability
- ENSO Predictions in an Intermediate Coupled Model In fluenced by Removing Initial Condition Errors in Sensitive Areas:A Target Observation Perspective
- Impact of Soil Moisture Uncertainty on Summertime Short-range Ensemble Forecasts
- Regional Characteristics of Typhoon-Induced Ocean Eddies in the East China Sea
- Comparisons of Three-Dimensional Variational Data Assimilation and Model Output Statistics in Improving Atmospheric Chemistry Forecasts
- An Asymmetric Spatiotemporal Connection between the Euro-Atlantic Blocking within the NAO Life Cycle and European Climates
