effect of decreasing temperature on the strobilation of Aurelia sp.1*
2018-05-07SHIYan石岩YUZhigang于志刚ZHENYu甄毓WANGGuoshan王国善WANGXungong王勋功MITiezhu米铁柱
SHI Yan (石岩) YU Zhigang (于志刚) ZHEN Yu (甄毓) WANG Guoshan (王国善) WANG Xungong (王勋功) MI Tiezhu (米铁柱)
1 College of Environmental Science and Engineering, Ocean University of China, Qingdao 266100, China
2 Key Laboratory of Marine Environment and Ecology, Ministry of Education, Qingdao 266100, China
3 Laboratory for Marine Ecology and Environmental Science, Qingdao National Laboratory for Marine Science and Technology,Qingdao 266071, China
4 Key Laboratory of Marine Chemistry Theory and Technology, Ministry of Education, Qingdao 266100, China
1 INTRODUCTION
Jellyfish outbreaks have become a global problem,and they frequently occur near the coasts of East Asia,Europe and North America as well as other locations(Arai, 2001). Jellyfish blooms negatively affect human society and the economy by impacting fishery resources and marine ecosystems (Purcell et al.,2007), so it is important to study the influence of environmental factors on jellyfish blooms.
Among jellyfish,Aureliaspecies are cosmopolitan.Power plant shut-downs as a result of the clogging of seawater intake screens byAureliamedusae have been reported in many areas of the world, including Japan, Korea, India, the Philippines, Australia, and the Baltic region, and have recently caused significant economic losses (Mills, 2001).Aureliasp.1(Scyphozoa, Semaeostomeae,Ulmaridae,Aurelia) is a common jellyfish species in Jiaozhou Bay, Qingdao,China (Ki et al., 2008; Jiang et al., 2010; Cheng et al.,2012) with a life history that includes both sessile asexual polyps and pelagic medusa. Asexual reproduction in the benthic phase can produce new polyps via budding or the release of ephyrae through strobilation, which, importantly, determines the number of medusae in the following year.
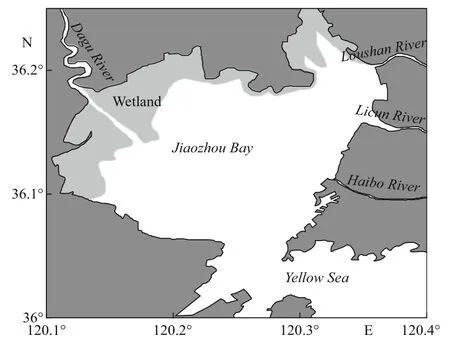
Fig.1 The geographic coordinates of Jiaozhou Bay
There have been many previous studies of strobilation inAureliaspp. Researchers have studied the effects of environmental factors (temperature,food, salinity, light, iodine in seawater, etc.) on the benthic phase ofA.auritain the laboratory (Custance,1964; Ishii and Watanabe, 2003; Berking et al., 2005;Purcell et al., 2012; Wang et al., 2015a), and the results suggested that temperature influences polyp strobilation. Field investigations have also shown that seawater temperature is the main factor affecting strobilation (Hernroth and Gröndahl, 1985; Lucas,1996; Watanabe and Ishii, 2001; Willcox et al., 2008;Ishii and Katsukoshi, 2010). All of these results indicate that temperature is the most important factor affectingA.auritastrobilation, but information aboutAureliapopulation dynamics remains too limited to explain the underlying mechanism. Additionally, the different polyp reproductive strategies in response to similar conditions are confusing. For example, Han and Uye (2010) reported that increasing temperature significantly increases the production of newA.auritapolyps, while Liu et al.(2009) showed that increasing temperature accelerates polyp strobilation. In addition, many studies have shown that decreasing temperature inducesA.auritapolyp strobilation (Ishii and Watanabe, 2003; Purcell et al., 2012; Wang et al.,2015a). The mechanisms underlying these phenomena are not understood, but Fuchs et al. (2014) identified part of the mechanism regulatingA.auritastrobilation through tissue transplantation, transcriptome sequencing and chemical interference. These authors suggested that the retinoic acid signal transduction pathway is involved in polyp strobilation and that the retinoid x receptor (RxR) plays an important role. The protein CL390 has been identified as the precursor of the strobilation inducer, and it becomes biologically active after being processed into smaller fragments.In the present study, we selected the RxR and CL390 genes as indicators of polyp strobilation inAureliasp.1 and quantified their expression in response to decreasing temperature. Therefore, the goal of this study was to systematically analyze the effect of decreasing temperature on polyp strobilation.
2 MATERIAL AND METHOD
2.1 Sample collection
TheAureliasp.1 polyps used in this experiment were grown from sexually produced planulae released from mature medusae collected in Jiaozhou Bay(Fig.1), Qingdao, China. The polyps were used after cultivation for 7 days in the dark on corrugated plates and 12-well culture plates at 20°C and during this week they were fed newly hatchedArtemianaupliusevery three days.
2.2 Sample culture
In Jiaozhou Bay, the water temperature ranges from 0°C to 25°C (Sun et al., 2011; Wang et al.,2015b), and the polyp strobilation will stop at 17°C(Wang et al., 2015a). Hence, in this experiment we choose 4°C, 8°C, 12°C, and 16°C to study strobilation.During the experiments, the polyps were separated into four groups that were cultured at 4°C, 8°C, 12°C and 16°C, respectively, and all of the incubators were maintained in the dark. The polyps were fed newly hatchedA.naupliusevery three days. The seawater in the incubators was replaced with new, filtered seawater 1 hour after every feeding.
Each group contained polyps that were either cultivated on 12-well culture plates (observation polyps) or corrugated plates (sampling polyps).Thirty-six healthy polyps were used for observation,and approximately 3 000 polyps were sampled in each group. The observation polyps were examined every three days by the stereomicroscopy. The experiments were initiated on October 3, 2015 and continued for 60 days until December 2, 2015.
2.3 RNA Extraction and cDNA synthesis
Total RNA was extracted from random 10 animals on corrugated plates with an established protocol(Schroth et al., 2005). About 1μg RNA was then reverse-transcribed into complementary DNA(cDNA) using the PrimeScriptTMRT reagent Kit(TaKaRa, Kusatsu, Japan) with a gDNA Eraser according to the manufacturer’s instructions.
2.4 Quantification of gene expression
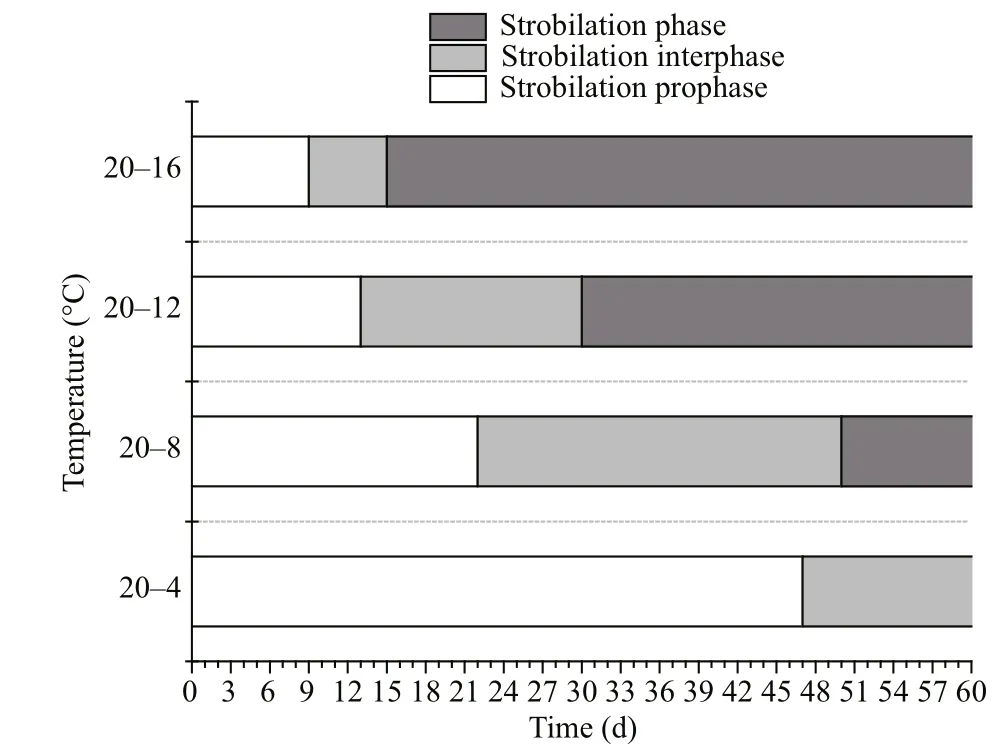
Fig.2 The strobilation period
To normalize the expression levels of the target genes (RxR and CL390), the elongation factor 1 gene(EF1 gene) was used as a reference; the primers for the RxR, CL390, and EF1 genes were previously described(Fuchs et al., 2014). Quantitative real-time PCR(qPCR) was subsequently applied to determine the expression of the transcription of the target genes. The 20-μL qPCR mixture contained the following reagents:10 μL of FastStart Universal SYBR Green Master(Rox) (Roche Diagnostics, Mannheim, Germany),0.6 μL of each primer (10 μmol/L each), 2 μL of bovine serum albumin (BSA, 0.2 μg/μL), and 1.5 μL of cDNA. After initial denaturation at 95°C for 5 min, the cycling protocol included denaturation at 95°C for 15 s followed by annealing and extension at 58°C for 1 min. Forty PCR cycles were determined to be sufficient to ensure quantification within the exponential phase of amplification.
2.5 Statistical analysis
One-way ANOVA was used to examine the effects of temperature on the strobilation period, the strobilae ratio, the strobilae release ratio, the number of released ephyra. differences between each of the groups were examined by pair-wise LSD (Least Significant difference) multiple comparisons.
3 RESULT
3.1 Strobilation period
The entire strobilation period was divided into three parts. The first lasted from the start of the experiment to the appearance of the first strobila which was the polyp with the first constriction (strobilation prophase);the second lasted from the appearance of the first strobila to the release of the first ephyra (strobilation interphase); and the third part lasted from the release of the first ephyra to the end of strobilation (strobilation phase) (Berking et al., 2005; Wang et al., 2015a).
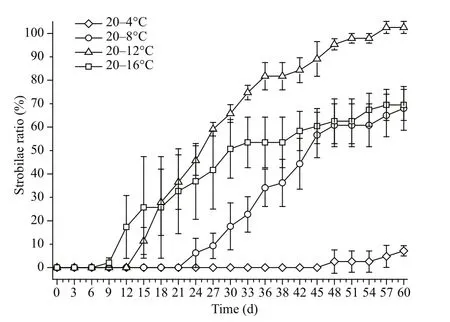
Fig.3 The strobilae ratio of Aurelia sp.1 polyps at different temperatures
Among the four temperature groups, the first strobila were observed in the 20–16°C group on the 9thday, and the first ephyrae were observed on the 15thday. The first strobila and ephyrae in the 20–12°C group were observed on the 13ththe 30thdays,respectively, and the first strobila and ephyrae in the 20–8°C group were observed on the 22thand 50thdays. Finally, the first strobila in the 20–4°C group were observed on the 47thday and no ephyrae were released during the experimental period (Fig.2). The strobilation prophase and interphase periods were significantly shortened as the final temperature increased (P<0.01).
3.2 Strobilae ratio
The strobilae ratio is based on the percentage of strobilae among all polyps and is calculated as the number of strobilae divided by the total number of polyps in each group (Miyake et al., 2002; Ishii and Katsukoshi, 2010).
The strobilae ratios in the 20–16°C, 20–12°C, 20–8°C and 20–4°C groups were 69.44%, 100%, 67.99%and 7.17% respectively. Overall, the strobilae ratio increased with increasing final temperature, but the 20–12°C group showed the highest final strobilae ratio(Fig.3). One-way ANOVA revealed that the final temperature significantly influenced the strobilae ratio(P<0.01), but the ratios in the 20–16°C and 20–8°C groups were not significantly different (P>0.05, LSD multiple comparison).

Fig.4 The release ratio of Aurelia sp.1 strobilae at different temperatures
The increase in the strobilae ratio differed significantly among the different temperatures. In the 20–16°C group, the strobilae ratio increased at a rate of 0.039/d from the 9thday until the 15thday, while a rate of 0.019/d was observed between the 15thand 33rddays and 0.006/d after the 33rdday. For the 20–12°C group, the strobilae ratio increased at a rate of 0.046/d from the 12thday to the 18thday and 0.030/d between the 18thand 36thdays. A 0.008/d rate of increase was observed after the 36thday. For the 20–8°C group, the strobilae ratio increased at a rate of 0.023/d from the 21stto the 48thday, and at a rate of 0.006/d after the 48thday. For the 20–4°C group, the strobilae ratio increased by 0.005/d after the 47thday.
The times needed to reach the 25% strobilae ratio and the 50% strobilae ratio were used to describe the strobilation time at the population, but not the individual level. The final strobilae ratio of the 20–4°C group was less than 25%, and the time to reach the 25% strobilae ratio was 36 days in 20–8°C group. In the 20–12°C and 20–16°C groups, the time to reach the 25% strobilae ratio was 18 and 15 days, respectively.The time to 25% strobilae ratio decreased with an increase in final temperature. The time to reach the 50% strobilae ratio in the 20–8°C, 20–12°C and 20–16°C groups was 43, 25, and 30 days, respectively,suggesting that the least time was required to obtain a 50% strobilae ratio in the 20–12°C group.
3.3 Strobilae release ratio
Polyps with constrictions are called strobilae, and they release ephyrae. The total number of strobilae includes both the strobilae that release ephyrae and the strobilae with constrictions that have not released ephyrae. We defined the strobilae release ratio as the number of strobilae that release ephyrae divided by the total number of strobilae in the group.
The final release ratios in the 20–16°C, 20–12°C,and 20–8°C groups were 86.15%, 88.69%, 22.12%,respectively (Fig.4); the ephyrae had not yet been released from the 20–4°C group. The final release ratios in the 20–12°C and 20–16°C groups were not significantly different (P>0.05, LSD multiple comparison) nor were those between the 20–8°C and 20–4°C groups (P>0.05, LSD multiple comparison).As the final temperature increased, the ephyrae were released earlier, and the final release ratios in 20–12°C and 20–16°C groups were similar and higher compared with the other two groups.
For the 20–12°C group, the release ratio increased at a rate of 0.042/d from the 27thto the 45thday, and the release ratio in the 20–16°C group increased at a rate of 0.036/d from the 12thday to the 33rdday. These two groups exhibited similar release ratios at the end of the study, but the increase in the release ratio of the 20–8°C group was slower than the rates in the above two groups. No ephyrae were released from the 20–4°C group.
3.4 Number of ephyrae
To compare the number of ephyrae released under different conditions, we defined two parameters. First,the number of ephyrae released per polyp (EPP) was calculated using the following formula:
EPP=Number of ephyrae released/Total number of polyps,
where the total number of polyps included those both with and without constrictions.
Second, the number of ephyrae released per strobila(EPS) was calculated using the following formula:
EPS=Number of ephyrae released/Total number of strobilae,
where the number of all strobilae only included the polyps that became strobilae.
No ephyrae were released from the 20–4°C group in this study. The EPP was 1.08 in the 20–8°C group,and the results of the multiple comparisons indicated no significant difference between the two EPPs(P>0.05, LSD multiple comparison). In addition, the EPPs in the 20–12°C and 20–16°C groups were 13.04 and 11.26, respectively (Fig.5), and the multiple comparisons also showed no significance difference between the two EPPs (P>0.05, LSD multiple comparison). The results showed that more ephyrae(EPP) were released at relatively higher temperatures.
We found that the EPS was a more accurate indicator of the effects of temperature than the EPP,because the number of ephyrae was only related to the strobilae. The EPS values in the 20–4°C and 20–8°C groups were 0 and 1.35, respectively (Fig.5) , and the results of the multiple comparisons analyses showed no significant differences between the two EPSs(P>0.05, LSD multiple comparison). The EPS values in the 20–12°C and 20–16°C groups were 12.78 and 16.37, respectively, and were not significantly different according to the multiple comparisons analysis (P>0.05, LSD multiple comparison). The results showed that more ephyrae were released at relatively higher final temperatures.
他的身体如出膛的炮弹,猛地朝着远处那团红影射过去。身在空中,六只节足盘绕拧转,合成了一柄巨大的尖锥。这柄尖锥将盘旋的黑风撕开一道豁口,破开前方密密麻麻拥上来的骷髅头,直射天葬师!
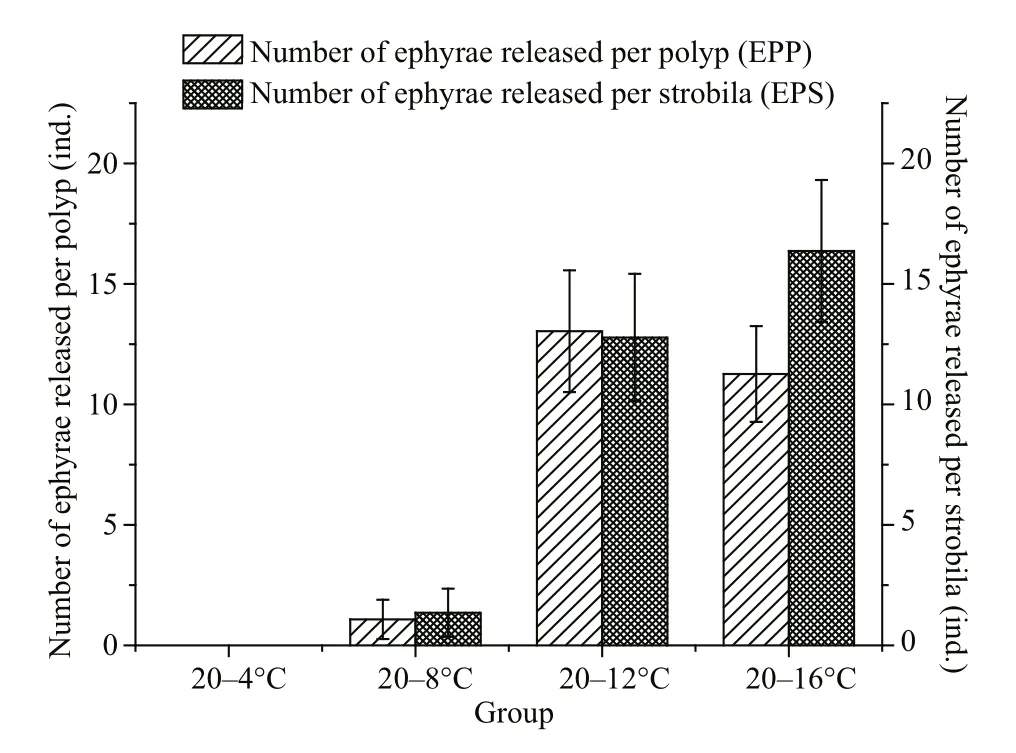
Fig.5 The number of ephyrae released per polyp (EPP) and the number of ephyrae released per strobila (EPS) at different temperatures
3.5 CL390 gene expression
The levels of CL390 gene expression varied with temperature (Fig.6). The first peaks of gene expression appeared before 6 days, but the peaks appeared earlier with an increase in final temperature. The expression of the CL390 gene was the lowest in the 20–4°C group. With the exception of the 20–4°C group, the highest up-regulation of the CL390 gene occurred earlier with an increase in final temperature.
3.6 RxR gene expression
The RxR gene expression levels were low (Fig.6),and the variations among the four temperatures were not significant. However, similar polyp strobilation trends were observed for the RxR and CL390 genes.

Fig.6 The expression of genes at different temperatures and the mean CL390 gene expression levels for different strobilation phases
An increase and subsequent decrease in CL390 gene expression was observed in each treatment group. Similar trends in polyp strobilation were observed for the RxR gene, but the RxR gene expression levels were low (Fig.6). Furthermore, the level of CL390 gene expression changed more significantly than that of the RxR gene. The changes in RxR gene expression and CL390 gene expression almost happened at the same time.
3.7 The mean CL390 gene expression and the strobilae ratio
There was a relationship between the strobilae ratio and CL390 gene expression (Fig.6) as indicated by the mean expression levels of the CL390 gene calculated for the four phases (I: from day 0 to the initiation of the strobilation interphase; II: the strobilae ratio from 0 to 25%; III: the strobilae ratio from 25% to 50%; IV: the strobilae ratio from 50% to the final strobilae ratio).
No significant difference was found between the mean expression levels of the CL390 gene in phase I(P>0.05), but significant differences were observed in the mean expression levels of the CL390 gene in phases II, III and IV (P<0.05).
The results for three groups (20–8°C, 20–12°C,20–16°C) demonstrated that the mean CL390 gene expression levels were gradually up-regulated in I, II,and III phases but down-regulated in phase IV (Fig.6),and the strobilae ratios gradually increased at different rates in the three groups. Comparing the mean CL390 gene expression levels with the rate of increase for the strobilae ratios in the same phase revealed that strobilation interphase was initiated earlier in phase I,and the mean CL390 gene expression level increased with increasing final temperature. In phase II, the mean level of CL390 gene expression in the 20–12°C group was highest; the mean CL390 gene expression level in the 20–16°C group was lower; and the mean expression level in the 20–8°C group was the lowest.In this phase, the rate of increase for the strobilation ratios in the 20–12°C group were highest; the rates in the 20–16°C group were lower; and the rates in the 20–8°C group were the lowest. In phase III, the mean CL390 gene expression level was highest in the 20–12°C group; the mean expression level in the 20–8°C group was lower; and the mean expression level was lowest in the 20–16°C group. In this phase, the rate of increase for the strobilation ratio were highest in the 20–12°C group, lower in the 20–8°C group, and lowest in the 20–16°C group. In phase IV, the mean expression of the CL390 gene was highest in the 20–12°C, lower in the 20–8°C group, and lowest in the 20–16°C group. In this phase, the rate of increase for the strobilation ratios were highest in the 20–12°C group, lower in the 20–8°C group, and lowest in the 20–16°C group (Fig.6). Thus, in the polyp community,the rate of increase for the strobilation ratio increases with an increase in the mean CL390 gene expression level, resulting in a higher strobilation ratio for the entire community.
There was a correlation between the expression levels of the CL390 gene and the rate of increase for the strobilation ratio (R2>0.8,P>0.05), but there was no significant correlation between CL390 gene expression and the release ratios. The results of the present study revealed that the release ratio might have a positive relationship with temperature.
4 DISCUSSION
We focused on the time to the first CL390 gene upregulation peak, the time to reach the strobilation interphase, the time to reach the highest CL390 gene up-regulation peak, and the time to reach the strobilation phase.
The four time parameters were reached earlier with increasing temperature (Fig.7); the first CL390 gene up-regulation peak reached the strobilation interphase earlier and the strobilation interphase reached the strobilation phase earlier with increasing temperature.Generally, CL390 gene up-regulation initially peaked before 6 days, and the strobilation interphase was subsequently initiated. Next, the highest CL390 gene up-regulation peak was observed upon the initiation of the strobilation phase, but the temperature in the 20–16°C group was so high that the polyps progressed to the strobilation phase prior to the highest level of CL390 gene up-regulation. In contrast, the temperature in the 20–4°C group was so cold that the polyps exhibited the highest CL390 gene up-regulation before the initiation of the strobilation interphase.

Fig.7 The relationships between different time parameters and temperature
In the present study, approximately 12°C was shown to be the optimum temperature for strobilation,which is consistent with the results of previous studies(Kroiher et al., 2000; Purcell, 2007; Purcell et al.,2012; Wang et al., 2012; Shi et al., 2016). The results indicated that the strobilae ratio increased with increasing final temperature, and the final strobilae ratio was highest in the 20–12°C group.
There have been several studies concerning the number of ephyra at different temperatures (Purcell,2007; Purcell et al., 2012; Wang et al., 2012, 2015a),but the different methods used to calculate the number of ephyrae have generated different results. In the present study, the EPPs increased with an increase in temperature from 8°C to 12°C, and subsequently decreased with a further increase in temperature to 16°C. However, the EPSs increased when the final temperature increased from 8°C to 16°C. The EPP results were different from those obtained for EPS.The EPP and EPS values in previous studies were calculated using the method shown in Table 1 for comparison purposes.
A comparison of the EPPs and EPSs calculated by Purcell (2007) and those in the present study showed that the highest number of ephyrae occurred within the same temperature range (10–16°C). The number of ephyrae detected in the Purcell study was higher than that in the present study, and this difference might reflect species-specific differences. Higher EPP values were observed in this study compared to those in Wang et al. (2015a), and this difference may reflect differences in the prey concentrations in the two studies.
Both EPP and EPS represent the number of ephyraereleased, and more ephyrae are released at higher final temperatures.

Table 1 The number of ephyrae in previous studies calculated using the method in the present study
In 2014, Fuchs observed that theAureliatranscriptome encoded a bona fide homolog of the bilaterian RxR, which is a member of the retinoic acid signaling cascade involved in strobilation. Furthermore,RxR controls the expression of the CL390 gene, a strobilation inducer (Fuchs et al., 2014). Thus, we speculated that changes in RxR gene expression might have a more rapid effect than changes in CL390 gene expression. But in our experiment, the changes in RxR gene expression and CL390 gene expression almost happened at the same time. The relationship of the two genes still needs a further study.
5 CONCLUSION
Decreasing the temperature from 20°C to 16°C,12°C, 8°C, and 4°C was found to induce polyp strobilation, and the strobilation prophase and interphase periods were shortened as the final temperature increased. The rate of increase for the strobilae ratio increased with increasing CL390 gene transcription levels. The optimal temperature for polyp strobilation was 12°C, and the optimal temperatures for the release ofAureliasp.1 ephyrae were 12°C and 16°C.
The CL390 gene plays an important role in polyp strobilation. Similar trends in polyp strobilation were observed for the CL390 and RxR genes, but the CL390 gene expression levels changed stronger compared with those of the RxR gene.
6 ACKNOWLEDGMENT
The authors thank WANG Minxiao for assistance with the molecular techniques and CHEN Ye and LU Wenhua for assistance with polyp cultivation.
Arai M N. 2001. Pelagic coelenterates and eutrophication: a review.Hydrobiologia,451(1-3): 69-87.
Berking S, Czech N, Gerharz M, Herrmann K, Hoff mann U,Raifer H, Sekul G, Siefker B, Sommerei A, Vedder F. 2005.A newly discovered oxidant defence system and its involvement in the development ofAureliaaurita(Scyphozoa, Cnidaria): reactive oxygen species and elemental iodine control medusa formation.TheInternational JournalofDevelopmentalBiology,49(8): 969-976.
Cheng F P, Wang M X, Wang Y T, Zhang F, Li C L, Sun S. 2012.DNA barcoding of common medusozoa in northern China based on mtCOI sequence.OceanologiaetLimnologia Sinica,43(3): 451-459. (in Chinese with English abstract)
Custance D R N. 1964. Light as an inhibitor of strobilation inAureliaaurita.Nature,204(4964): 1 219-1 220.
Fuchs B, Wang W, Graspeuntner S, Li Y Z, Insua S, Herbst E M, Dirksen P, Böhm A M, Hemmrich G, Sommer F,Domazet-Lošo T, Klostermeier U C, Anton-Erxleben F,Rosenstiel P, Bosch T C G, Khalturin K. 2014. Regulation of polyp-to-jellyfish transition inAureliaaurita.Current Biology,24(3): 263-273.
Han C H, Uye S I. 2010. Combined effects of food supply and temperature on asexual reproduction and somatic growth of polyps of the common jellyfishAureliaauritas.I.PlanktonandBenthosResearch,5(3): 98-105.
Hernroth L, Gröndahl F. 1985. On the biology ofAurelia aurlta(L.): 2. Major factors regulating the occurrence of ephyrae and young medusae in the Gullmar Fjord, western Sweden.BulletinofMarineScience,37(2): 567-576.
Ishii H, Katsukoshi K. 2010. Seasonal and vertical distribution ofAureliaauritapolyps on a pylon in the innermost part of Tokyo bay.JournalofOceanography,66(3): 329-336.
Ishii H, Watanabe T. 2003. Experimental study of growth and asexual reproduction inAureliaauritapolyps.Sessile Organisms,20(2): 69-73.
Jiang H, Cheng H Q, Xu H G, Arreguín-Sánchez F, Quesne W L. 2010. Impact of large jellyfish bloom on energy balance of middle and upper ecosystem in East China Sea.Marine EnvironmentalScience,29(1): 91-95. (in Chinese with English abstract)
Ki J S, Hwang D S, Shin K, Yoon W D, Lim D, Kang Y S, Lee Y, Lee J S. 2008. Recent moon jelly (Aureliasp.1) blooms in Korean coastal waters suggest global expansion:examples inferred from mitochondrial COI and nuclear ITS-5.8S rDNA sequences.ICESJournalofMarine Science,65(3): 443-452.
Kroiher M, Siefker B, Berking S. 2000. Induction of segmentation in polyps ofAureliaaurita(Scyphozoa,Cnidaria) into medusae and formation of mirror-image medusa anlagen.InternationalJournalofDevelopmental Biology,44(5): 485-490.
Liu W C, Lo W T, Purcell J E, Chang H H. 2009. effects of temperature and light intensity on asexual reproduction of the scyphozoan,Aureliaaurita(L.) in Taiwan.Hydrobiologia,616(1): 247-258.
Lucas C H. 1996. Population dynamics ofAureliaaurita(Scyphozoa) from an isolated brackish lake, with particular reference to sexual reproduction.Journalof PlanktonResearch,18(6): 987-1 007.
Mills C E. 2001. Jellyfish blooms: are populations increasing globally in response to changing ocean conditions?Hydrobiologia,451(1-3): 55-68.
Miyake H, Terazaki M, Kakinuma Y. 2002. On the polyps of the common jellyfishAureliaauritain Kagoshima Bay.JournalofOceanography,58(3): 451-459.
Purcell J E, Atienza D, Fuentes V, Olariaga A, Tilves U, Colahan C, Gili J M. 2012. Temperature effects on asexual reproduction rates of scyphozoan species from the northwest Mediterranean Sea.Hydrobiologia,690(1): 169-180.
Purcell J E, Uye S I, Lo W T. 2007. Anthropogenic causes of jellyfish blooms and their direct consequences for humans:a review.MarineEcologyProgressSeries,350: 153-174.
Purcell J E. 2007. Environmental effects on asexual reproduction rates of the scyphozoanAurelialabiata.MarineEcologyProgressSeries,348: 183-196.
Schroth W, Ender A, Schierwater B. 2005. Molecular biomarkers and adaptation to environmental stress in moon jelly(Aureliaspp.).MarineBiotechnology,7(5): 449-461.
Shi Y, Mi T Z, Wang J Y, Chen L H, Wang G S, Zhen Y, Yu Z G. 2016. The effect of temperature and food supply on the asexual reproduction of moon Jelly (Aureliasp. 1) polyps.ActaEcologicaSinica,36(3): 786-794. (in Chinese with English abstract)
Sun S, Sun X X, Zhang G T, Tang H B, Liu Q, Li G M. 2011.Long-term changes in major meteorological and hydrological factors in the Jiaozhou Bay.Oceanologiaet LimnologiaSinica,42(5): 632-638. (in Chinese with English abstract)
Wang N, Li C L, Liang Y, Shi Y Q, Lu J L. 2015a. Prey concentration and temperature effect on budding and strobilation ofAureliasp 1 polyps.Hydrobiologia,754(1):125-134.
Wang Y J, Liu Z, Zhang Y, Wang M, Liu D Y. 2015b. Temporal and spatial variations of chlorophyllaand environmental factors in Jiaozhou Bay in 2010-2011.HaiyangXuebao,37(4): 103-116. (in Chinese with English abstract)
Wang Y T, Sun S, Li C L, Zhang F. 2012. effects of temperature and food on asexual reproduction of the scyphozoan,Aureliasp.1.OceanologiaetLimnologiaSinica,43(5):900-904. (in Chinese with English abstract)
Watanabe T, Ishii H. 2001. In situ estimation of ephyrae liberated from polyps ofAureliaauritausing settling plates in Tokyo Bay, Japan.Hydrobiologia,451(1-3): 247-258.
Willcox S, Moltschaniwskyj N A, Crawford C M. 2008.Population dynamics of natural colonies ofAureliasp scyphistomae in Tasmania, Australia.MarineBiology,154(4): 661-670.
杂志排行

Journal of Oceanology and Limnology的其它文章
- An aftereffect of global warming on tropical Pacific decadal variability*
- Analysis of monthly variability of thermocline in the South China Sea*
- A numerical study of the South China Sea Warm Current during winter monsoon relaxation*
- Predicting the sinkage of a moving tracked mining vehicle using a new rheological formulation for soft deep-sea sediment*
- Chemical characterization of fractions of dissolved humic substances from a marginal sea—a case from the Southern Yellow Sea*
- The morphological and molecular detection for the presence of toxic Cylindrospermopsis (Nostocales, Cyanobacteria) in Beijing city, China*