Probabilistic Model Checking-Based Survivability Analysis in Vehicle-to-Vehicle Networks
2018-03-12LiJinGuoanZhangJueWang
Li Jin, Guoan Zhang*, Jue Wang
School of Electronics and Information, Nantong University, Nantong 226019, China
I. INTRODUCTION
Vehicle-to-vehicle (V2V) networks are deployed to alert drivers to the safety-related events happening around, such as traffic slowdowns, road obstacles and the approaching of emergency vehicles. Due to the nature of wireless propagation, V2V networks are vulnerable to hacking attacks and/or channel fading, which could cause serious safety problems. For instance, a hacker may remotely take over the control of a car’s engine, brakes and even more functional units of the vehicle,making the target vehicle node fail to communicate with the other vehicle nodes in the network. On the other hand, deep channel fading between two vehicle nodes will suspend the communications on this link. Therefore,how to guarantee communications security for the V2V networks is important and has drawn considerable attentions in the research [1-7].
Survivability is an important security measure in V2V networks. It reects the ability of a V2V network to accomplish communication in the existence of abnormal events (such as malicious attacks, network failures, accidents,etc.). In the literature, different approaches have been used to evaluate the survivability of various systems [8-11]. A quantitative survivability evaluation method was presented for wireless ad hoc networks in [12], where the excess packet loss caused by network failures was used as the survivability performance measure, thereafter, steady-state availability analysis and transient performance analysis were applied to the survivability model. In[13], the authors investigated the survivability for large-scale mobile ad hoc networks(MANETs), where numerical validation was applied to study the failure rate of each node.In [14], a reliability theory-based survivability evaluation approach was proposed for wireless sensor networks (WSNs), wherein the network availability, reliability and survival lifetime were investigated. Moreover, the availability and perform ability were discussed in terms of component failures and topological resilience for mesh network in [15]. In [16], the channel availability has been explored in the survivability model of vehicle ad hoc network(VANET).
Most of the above-mentioned works rely on numerical simulation-based techniques. Differently, in this paper, we use the probabilistic model checking approach to model and analyze the survivability for V2V networks. By doing so, the advantages of the probabilistic model checking can be exploited, e.g., it can provide a rigorous formal model for the specification of V2V networks; additionally, the model checking approach is able to analyze all possible behaviours of V2V networks, which is more flexible than the numerical analysis commonly adopted in the literature.
In this paper, we consider a general V2V network on the highway, consisting of multiple vehicle nodes. We use the infinite-state continuous-time Markov chain (CTMC) to describe the considered network architecture.Note that in the research of wireless and optical networks, a probabilistic Markov decision process model has been adopted in [17], and an undirected probabilistic graphical model is considered in [18]. However, when taking into account both the vehicle failure rate and the repair rate in our considered V2V network,these models in the literature fail to provide a satisfactory analysis framework. For this reason, we choose the probabilistic continuous-time Markov chain (CTMC) model in our analysis. Based on that, we apply two failure types (namely the node failure caused by external attacks on a target V2V node, and link failure caused by the channel fading/obstacle blocking in the communication link) to the CTMC model to study their impacts on the communication survivability. Furthermore, we use the PRISM (Probabilistic Symbolic Model Checker) [19-21] to model the CTMC, and use continuous stochastic logic (CSL) [22-24] to describe the corresponding survivability properties. The impacts of both failures on the network survivability are illustrated and compared.
As a possible future extension, the proposed probabilistic model checking-based survivability evaluation method can be further applied to urban V2V networks, which have totally different architecture and characteristics as compared to the V2V networks on the highway scenario. New network architecture and transmission protocols are used to be exploited to improve the network survivability,e.g., in urban areas, it is possible to exploit other external network infrastructures such as the distributed antenna systems (DAS) [25]and cloud radio overber network (C-RoFN)[26, 27], which have recently drawn considerable attentions in the construction of public safety networks, to enhance the V2V network survivability. The DAS architecture allows for low communications latency which is preferable in safety-related V2V applications. In addition, recent studies exploited only partial and/or large scale channel state informations(CSIs) [28-30] in DAS networks which provides a solid basis for the DAS-aided V2V communications with the challenge of the acquiring accurate CSIs in high-speed vehicles.
The remainder of this paper is organized as follows. Section II proposes the CTMC based survivability model for the considered V2V network. In Section III, the probabilistic model checking approach is proposed to quantitatively analyze the survivability of the V2V network. At last, Section IV concludes the paper and possible future works are discussed.
II. SURVIVABILITY MODEL
2.1 Survivability model de nition
For different application scenarios, the denitions of network survivability model are different [10, 12, 31-33]. For our considered V2V network, we dene its survivability model as follows:
Definition 1. The V2V network surviv-
ability model (VNSM) can be described as a four-tuplewhere the parameters are dened as follows:
1)Eis the environment statement, describing the network architecture as well as the environment in which the survivable communication system operates. Throughout this paper,Estands for the V2V network on the highway as shown ingure 1.
The environment statementEdetermines the failure types that could possibly happen.For our considered environment, two typical failures will be considered in the following analysis, namely (1) the node failure and (2)the link failure. Detailed descriptions of these failures are given by the denition of the second parameter in theVNSM, i.e.,F, as in the following. Remark 1. Assuming that there areMvehicles in the considered V2V network,the maximum number of node failures in this network isNnode=M, while the maximum number of link failures isNlink=2(M−1). It is reasonable since that the communication link between any two adjacent vehicle nodes is bi-directional.

Table I. Parameters description.
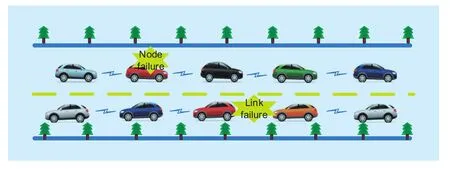
Fig. 1. An illustration of the V2V network on the highway.
In what follows, for the ease of description,we omit the subscripts and denote the maximum number of both failures asN. The values ofNwill be respectively specified when different failure types are considered.

Fig. 2. The CTMC survivability model for the V2V network.
-S0∈Sis the initial state of thenite state machine.
-Lf: The labeling function of atomic propositionsAPare true inS, that isS→2AP.
-T: The state transition matrix.
2.2 CTMC model
Assumption 1. The key assumptions made in our CTMC model are listed as follows:
1) Each failure event follows Poisson distribution
Correspondingly, the occurrence time of each failure event follows exponential distribution for which the density function is given by
2) All failure events are mutually independent.


In the next section, the proposed CTMC model will be further described with the language of the PRISM model checker. By using the PRISM model checker, the state space,transition matrix and state rewards can be conveniently obtained, and the transient probabilities as well as the steady-state probabilities described in (2) can be therefore computed.
III. QUANTITATIVE SURVIVABILITY EVALUATION USING PRISM
In this section, quantitative survivability anal-ysis is conducted using the probabilistic model checker PRISM based on Definition 1 and its corresponding CTMC model. According to the conguration parameters given in Table 1, we build the survivability model for the considered V2V network in PRISM, where parametric models can be specified by PRISM’s guarded command languages. When doing quantitative analysis, we use continuous-time stochastic logic (CSL) formulas to define the properties of the vehicle survivability network. These properties represent partial specifications of the steady-state and the transient behaviors of the CTMC model, which are dened bySas described in Denition 1. According to these CSL-formulas, we use PRISM to solve the actual probability of the specic states in the V2V network.
Table 2 shows the established numerical results of the state space of CTMC model using PRISM for diff- erent values ofN. The results are obtained for an example scenario whereλ=0.3 andµ=0.05, and the construction time is measured on Intel-core 3.2GHz CPU with 8 GB RAM.
In Table 2, for different number ofN, the corresponding number of the states and transitions of the CTMC model is presented. The amount of memory required by the sparse matrix to represent the same CTMC is also given by the column labeled with ‘sparse’ in the table.The last two columns, under the label ‘construction’, show the amount of time and the number ofx-point iterations required to construct the models. The construction involvesrstly building a CTMC (denoted as a Multi-Terminal Binary Decision Diagram (MTBDD) in Table 2)from the system description, and then computing the reachable states using a Binary Decision Diagram (BDD).
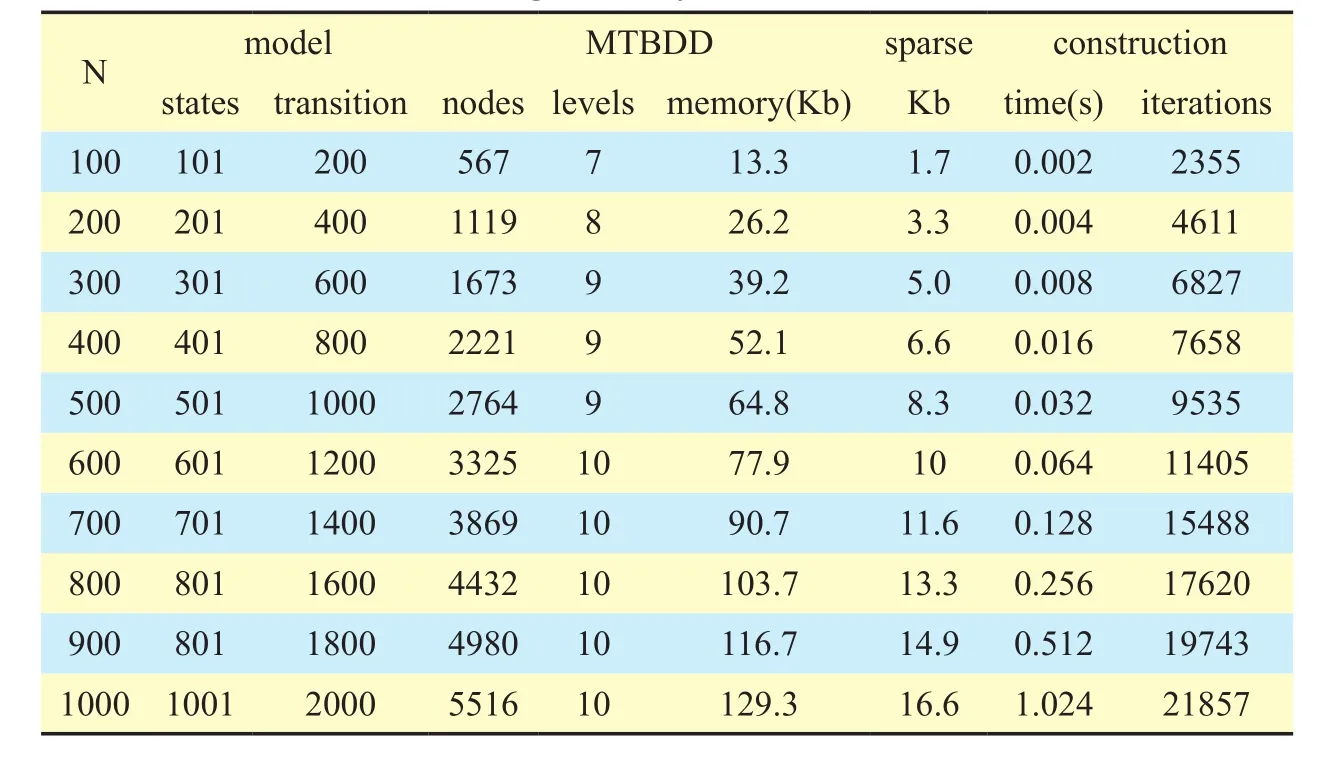
Table II. PRISM model checking results of CTMC.
Based on the CSL formulas, we use different attributes to perform the quantitative survivability analysis in the considered V2V network. We consider four different attributes in the subsequent analysis, namely the maximum probability, minimum probability, expected rewards, and instantaneous rewards. Their definitions, the corresponding CSL formulas,as well as the simulation results, are provided in detail in the following subsections.
3.1 Maximum probability
Formula_1:

The CSL Formula_1 represents the maximum probability that a network breakdown happens. HigherPmaxcorresponds to lower network survivability. As an example, werst consider the failure typef1, the corresponding maximum probability is denoted asPmax1.Ingure 3, the value ofPmax1is shown for a V2V network consisting ofM=100 vehicle nodes, so the maximum number of node failures isN=M=100. Moreover, we setµ1=0.05 andT=50s. The probabilities are illustrated for differentλ1,i.e., the strength off1. As shown in thegure, the V2V network survivability declines with increasingλ2, in the meanwhile, the reliability of the V2V network reduces. It can also be observed that the maximum probabilities will asymptotically approach 1 for sufciently largeT.
In the next, we compare the maximum probability under different link failure conditions in figure 4,i.e., considering the failure typef2. The CSL formula used herein still follows the structure of Formula_1, whereas the failure strength and the repair rate are respectively changed toλ2andµ2. As compared withgure 3, two major differences lie in the parameter setting ofgure 4: 1) As described in Remark 1, the maximum number of failures changes fromN=100 toN=198; 2) A larger repair rate is used (µ2=0.2) for the reason that in practice, it is likely that a link failure is easier to be repaired than a node failure.
We first compare the dash line in figure 4 and the blue curve marked with circle ingure 3. The only difference in the parameter setting is the maximum number of failures. These two curves show only slight difference since the maximum number of failures in both figures are large, in this case, the maximum probability will not be affected too much. Further, for the solid curves in figure 4, the repair rate is increased toµ2=0.2. It can be seen that whenλ2=0.1, the maximum probability of link failures (i.e., the solid curve marked with circle ingure 4) is smaller than the maximum probability of node failures (see the solid curve marked with circle ingure 3), due to the larger repair rate. On the other hand, whenλ2is changed to 0.3 and 0.6, the maximum probabilities of link failures become almost equal to those of the node failures. This indicates that in the environments with large failure strength, the impact of repair rate becomes trivial. Figure 3 andgure 4 show that greater failure strength results in greater network breakdown probability in the V2V network, or equivalently, lower network survivability. For the same failure strength, the network survivability improves with increasing repair rate.
3.2 Minimum probability
Formula_2:

The CSL Formula_2 denotes the minimum probability that a network breakdown happens.Again, respectively considering the failure typesf1andf2, the corresponding minimum probabilities are shown in figure 5 and figure 6. Both figure 5 and figure 6 show that the minimum probabilities increase with the failure strengthsλ1orλ2. For the comparison betweengure 5 andgure 6, similar conclusions can be obtained as that ingure 3 andgure 4.However, it is observed that the minimum probability is more sensitive to parameters such asNandµ. Moreover, for the failure strength larger than 0.3, the minimum probability gradually approaches 1 with increasingT, which indicates that the vehicle network will be completely destroyed eventually.

Fig. 3. The maximum probability (Pmax1) of network breakdown vs. time. (corresponding to the node failure).
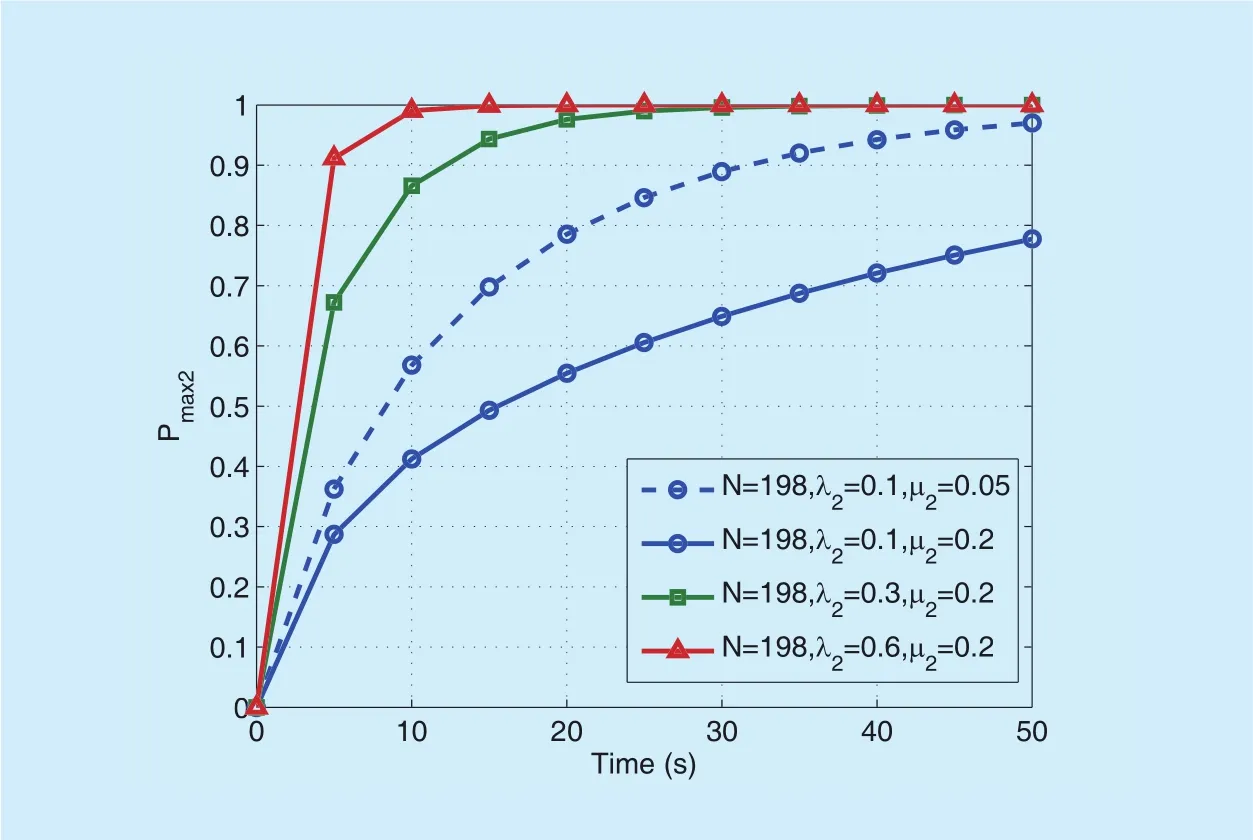
Fig. 4. The maximum probability (Pmax2) of network breakdown vs. time. (corresponding to the link failure).
Furthermore, we depict both the maximum and minimum network breakdown probabilities respectively with respect to the failure strength and repair rate, as shown in figure 7,gure 8,gure 9 andgure 10. As can be anticipated, the probability of network breakdown increases with the failure strengthλ, and decreases with the repair rateµ. Fromgure 7 andgure 8, it is worth noting that when the failure strength is larger than a certain threshold, the network breakdown event will eventually happen with probability 1, no matter what value the repair rate is set to be.
Similarly, figure 9 and figure 10 indicates that when the failure strength is large, zero network breakdown probability cannot be guaranteed even when the repair rate is set to be 1 (i.e., the largest value).
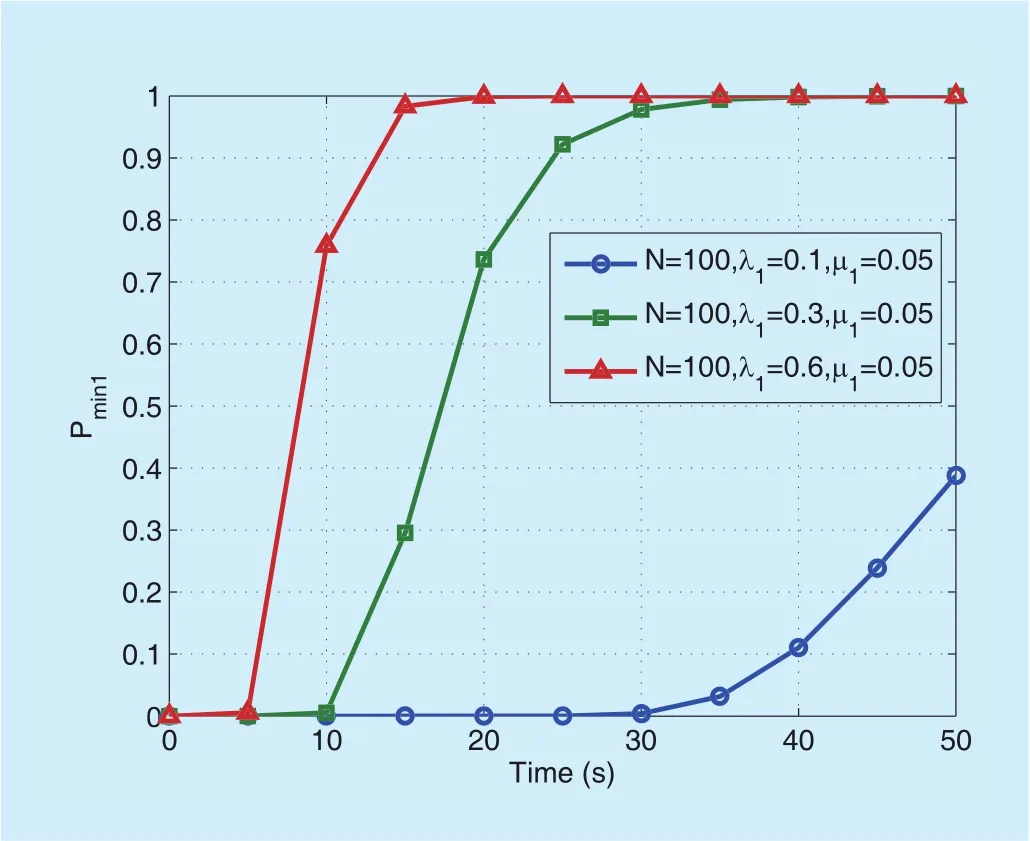
Fig. 5. The minimum probability (Pmin1) of network breakdown vs.time. (corresponding to the node failure).
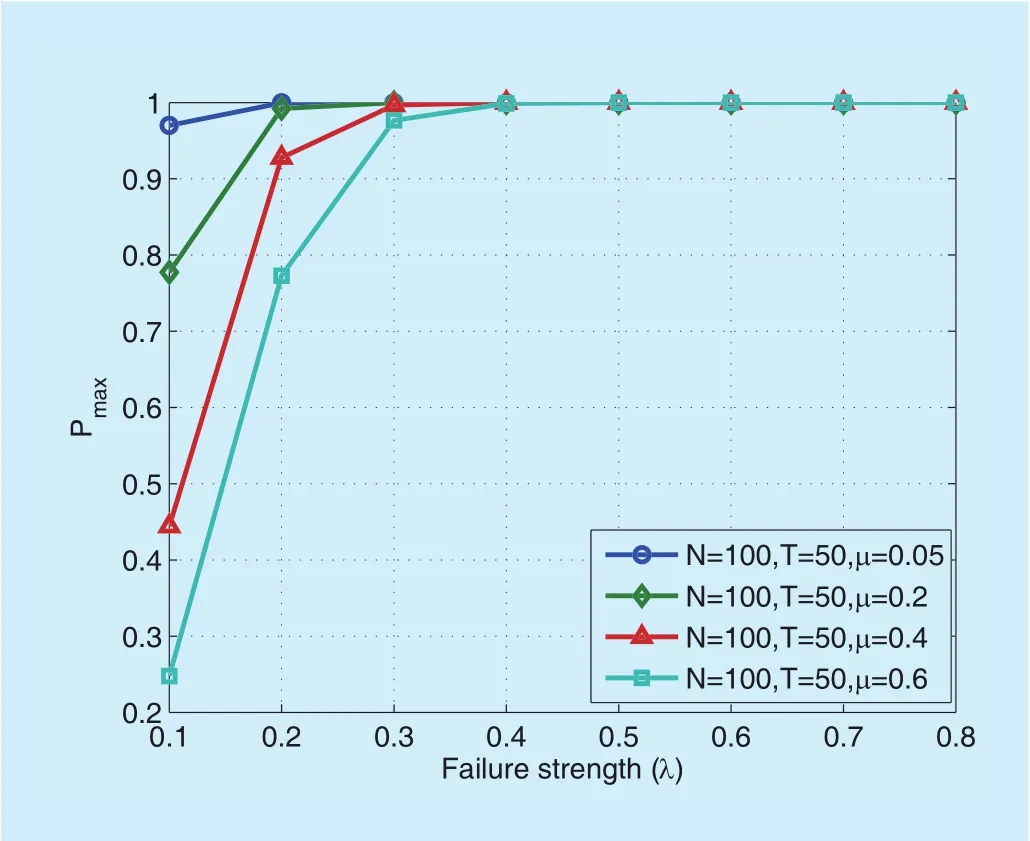
Fig. 7. The maximum probabilities of network breakdown vs. failure strength (λ).
3.3 Expected reward
In addition to the above survivability analysis, we also perform a reward analysis, which computes the expected accumulated reward up to a certain time in the considered CTMC. The reward formula is dened as follows:

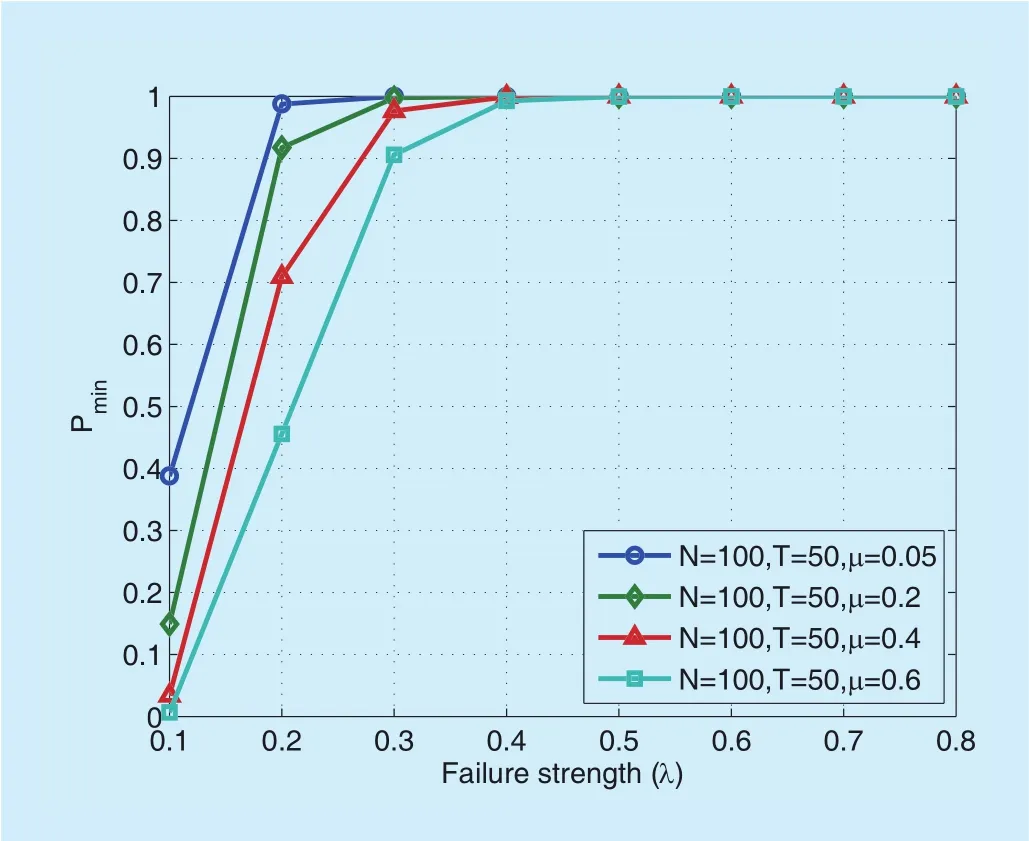
Fig. 8. The minimum probabilities of network breakdown vs. failure strength (λ).
Figure 11 provides graphical description of the properties in Formula_3. In practice(e.g., on the highway), the expected reward of node failures corresponds to the compromises of data, and the expected reward of link failures corresponds to the data transmission delay and/or packet losses. Ingure 11, we setT=50sandN=100. The four curves show that the expected rewards would increase over the time. Largerλ1orλ2results in increasing of the expected rewards.
Formula_4:R{ "failures" } = ?[I=T].
The four curves in figure 12 illustrate that the expected number of failures (either the node failures or link failures) increases with increasing failure strength. On the other hand, for the same failure strength, the expected number of failures reduces with increasing repair rate.
3.4 Instantaneous reward
In the end, we analyze the instantaneous reward of the survival model. The instantaneous reward is defined as the expected number of failures in the V2V network at a certain time instant. The corresponding CSL formula is shown as follows:
IV. CONCLUSIONS
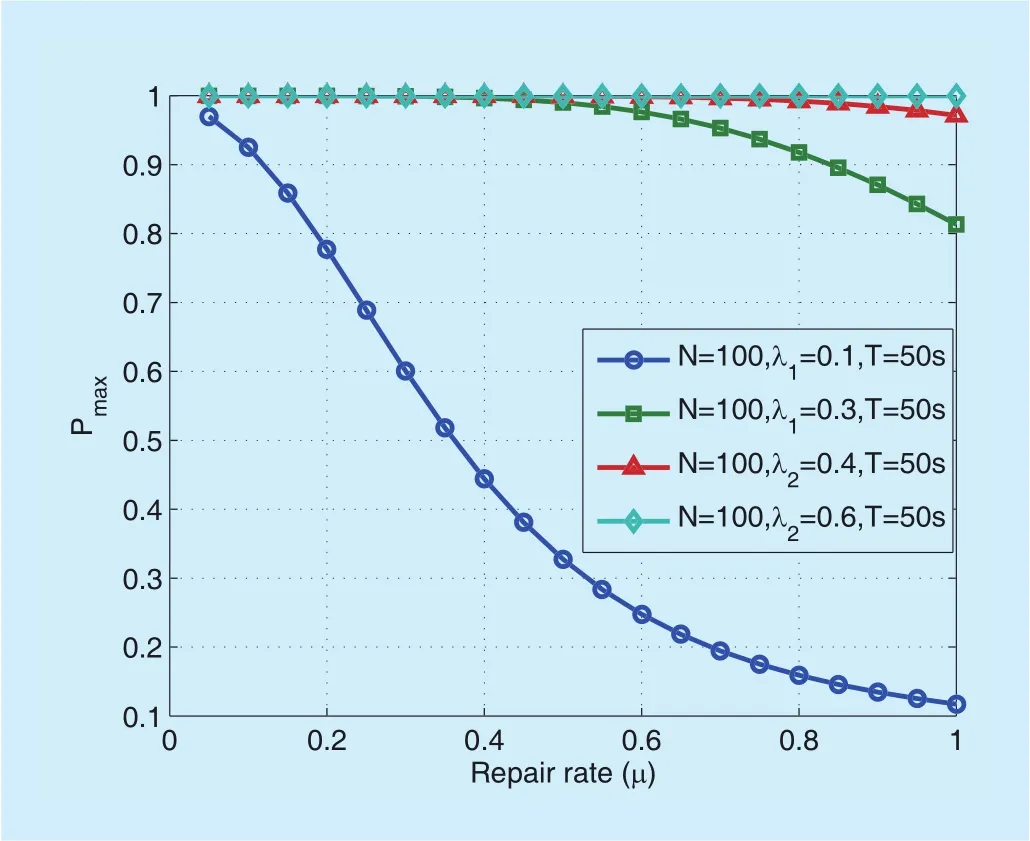
Fig. 9. The maximum probabilities of network breakdown vs. repair rate(µ).
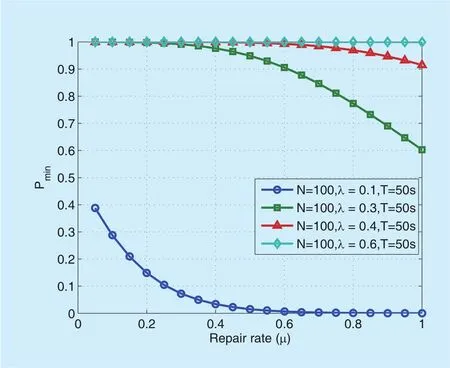
Fig. 10. The minimum probabilities of network breakdown vs. repair rate(µ).
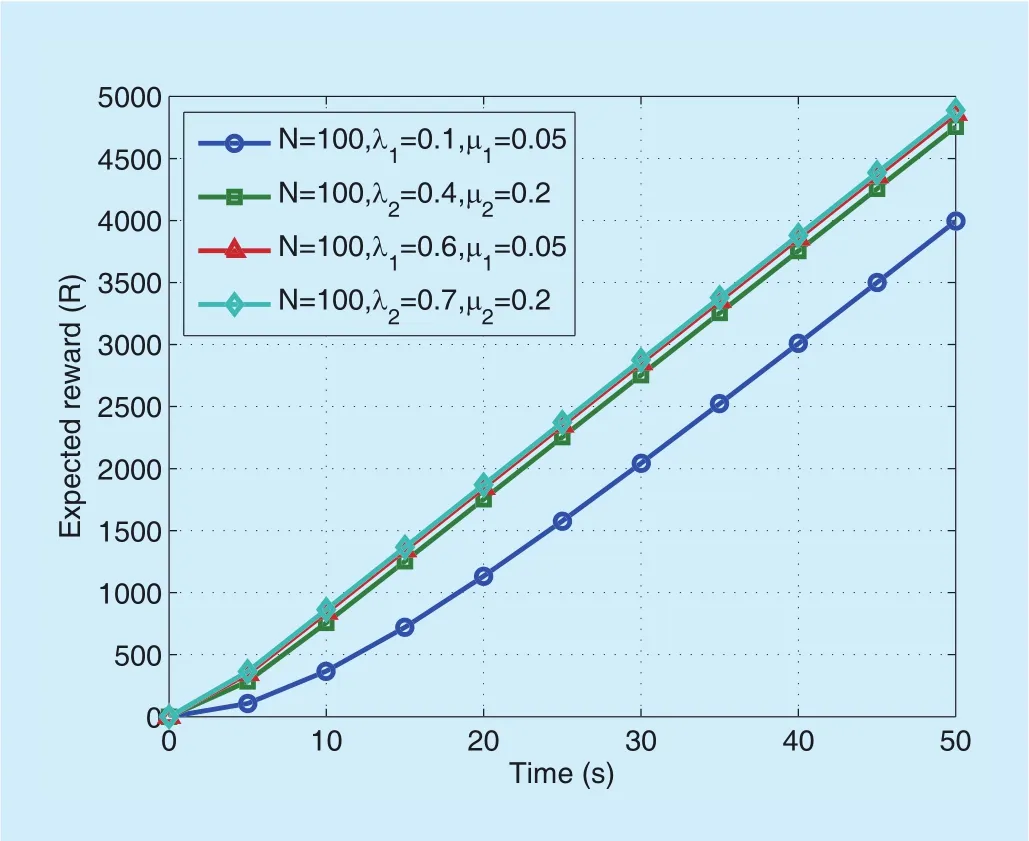
Fig. 11. The expected reward versus time. Results are shown for both failure types with different failure strength and repair rate.

Fig. 12. Instantaneous reward of the expected failure number in the V2V network. Results are shown for both failure types with different failure strength and repair rate.
In this paper, we proposed a probabilistic model checking approach to quantitatively analyze the survivability in a V2V network.Two typical failure types, namely the node failure and link failure, were considered in the analysis. Based on the considered V2V network architecture and its characteristics, werst provided the survivability denition, then established a continuous-time Markov chain model to describe the survivability in the considered V2V network. After that, the CTMC model was described in the PRISM model checker, which can be conveniently used to analyze different CSL properties related to the network survivability. The proposed probabilistic model checking-based survivability evaluation approach can beexibly extended to other networks besides the V2Vnetwork.
ACKNOWLEDGEMENT
This work is supported by the National Natural Science Foundation of China under Grant no. 61371113 and 61401240, Graduate Student Research Innovation Program Foundation of Jiangsu Province no. YKC16006, and Graduate Student Research Innovation Program Foundation of Nantong University no.KYZZ160354. Top-notch Academic Programs Project of Jiangsu Higher Education Institutions (PPZY2015B135).
[1] Stajano, Frank, and R. Anderson, “The Resurrecting Duckling: Security Issues for Ad-hoc Wireless Networks,”International Workshop on Security Protocols Springer Berlin Heidelberg,vol. 1796, no. 1, 1999, pp.172-182.
[2] S. Tanwar, K V. Prema, “Threats & Security Issues in Ad hoc network: A Survey Report,”International Journal of Soft Computing & Engineering,vol. 2, no. 6, 2013, pp. 2231-2307.
[3] Woo, Samuel, H. J. Jo and H. L. Dong, “A Practical Wireless Attack on the Connected Car and Security Protocol for In-Vehicle CAN,”IEEE Transactions on Intelligent Transportation Systems, vol. 16, no. 2, 2015, pp. 993-1006.
[4] Patel, J. Nirav and R. H. Jhaveri, “Trust based approaches for secure routing in VANET: A survey,”Procedia Computer Science, vol. 45, 2015,pp. 592-601.
[5] Singh, Amandeep and S. Kad, “A Review on the Various Security Techniques for VANETs,”Procedia Computer Science, vol. 78, 2016, pp. 284-290.
[6] Sari, Arif, O. Onursal and M. Akkaya, “Review of the Security Issues in Vehicular Ad Hoc Networks (VANET),”International Journal of Communications Network & System Sciences, vol. 8,no.13, 2015, pp. 552-566.
[7] H. Hasrouny, A E. Samhat, C. Bassil, et al. “VANet security challenges and solutions: A survey,”Vehicular Communications, vol. 7, 2017, pp. 7-20.
[8] R. C. Linger, N. R. Mead and H. F. Lipson, “Requirements Definition for Survivable Network Systems,”Proc. International Conference on Requirements Engineering: Putting Requirements Engineering To Practice, 1998, pp. 14-23.
[9] R. J. Ellison, D. A. Fisher, R. C. Linger, et al, “Survivable Network Systems: An Emerging Discipline,”Survivable Network Systems An Emerging Discipline, 1997, pp. 11-20.
[10] K. S. Trivedi and R. Xia, “Quantication of system survivability,”Telecommunication Systems,vol. 60, no. 4, 2015, pp. 451-470.
[11] C. L. Wang, D X. Wang, Q. Miao, et al, “A Novel Network Survivability Analysis and Evaluation Model,”Applied Mechanics & Materials, vol.347-350, no. 347-350, 2013, pp. 2082-2088.
[12] D. Chen, S. Garg and K. S. Trivedi, “Network survivability performance evaluation:: a quantitative approach with applications in wireless ad-hoc networks,”Proc. ACM International Workshop on Modeling Analysis and Simulation of Wireless and Mobile Systems, 2002, pp. 61-68.
[13] S. Peng, W. JIA and G. WANG, “Survivability Evaluationin Large-Scale Mobile Ad-Hoc Networks,”Journal of Computer Science and Technology, vol. 24, no. 4, 2009, pp. 761-774.
[14] S. Shen, R. Han, L. Guo,et al, “Survivability evaluation towards attacked WSNs based on stochastic game and continuous-time Markov chain,”Applied Soft Computing, vol. 12, no. 5,2012, pp. 1467-1476.
[15] P. H. Pathak, “Designing for Network and Service Continuity in Wireless Mesh Networks,”Springer New York, 2012.
[16] S.Dharmaraja, R. Vinayak and K. S. Trivedi, “Reliability and survivability of vehicular ad hoc networks: An analytical approach,”Reliability Engineering & System Safety, vol. 153, no. 5,2016, pp. 28-38.
[17] V. Zagorskis, “Using the probabilistic model checker PRISM to analyze H-OTBA algorithm in Optical Burst Switching (OBS) networks,”Proc.Advances in Wireless and Optical Communications, 2015, pp. 132-137.
[18] G. Liu, C. Ji, “Resilience of all-optical network architectures under in-band crosstalk attacks:a probabilistic graphical model approach,”IEEE Journal on Selected Areas in Communications,vol. 25, no. 3, 2007, pp. 2-17.
[19] M. Kwiatkowska, G. Norman, D. Parker, “PRISM:Probabilistic Symbolic Model Checker,”Lecture Notes in Computer Science, vol. 2324, 2002, pp.200-204.
[20] M. Kwiatkowska, G. Norman, D. Parker, “Proba-bilistic symbolic model checking with PRISM: a hybrid approach,”International Journal on Software Tools for Technology Transfer, vol. 6, no. 2,2004, pp. 128-142.
[21] M. Kwiatkowska, G. Norman, D. Parker, “PRISM:probabilistic model checking for performance and reliability analysis,”ACM Press, 2009.
[22] C. Baier, B. Haverkort, H. Hermanns,et al, “Model-Checking Algorithms for Continuous-Time Markov Chains,”IEEE Transactions on Software Engineering, vol. 29, no. 6, 2003, pp. 524-541.
[23] Y. Gao, M. Xu, N. Zhan,et al, “Model checking conditional CSL for continuous-time Markov chains,”Information Processing Letters, vol. 113 no. 1-2, 2013, pp. 44-50.
[24] P. E. Heegaard, K. S. Trivedi, “Network survivability modelling,”Computer Networks, vol. 53, no.8, 2009, pp. 1215-1234.
[25] W. Feng, Y. Li, J. Gan, S. Zhou, J. Wang and M Xia, “On the deployment of antenna elements in generalized multi-user distributed antenna systems,”ACM Mobile Networks and Applications, vol. 16, no. 1, 2011, pp. 35-45.
[26] H. Yang,et al. “Experimental demonstration of multi-dimensional resources integration for service provisioning in cloud radio over fiber network,”, 2016, pp. 30678.
[27] H. Yang,et al. “C-RoFN: multi-stratum resources optimization for cloud-based radio over opticalber networks,”IEEE Communications Magazine,vol. 54, no. 8, 2016, pp. 118-125.
[28] Y. Wang, W. Feng, L. Xiao, Y. Zhao and S. Zhou,“Coordinated multi-cell transmission for distributed antenna systems with partial CSIT,”IEEE Communications Letters, vol. 16, no. 7, 2012, pp.1044-1047.
[29] W. Feng, Y. Wang, N. Ge, J. Lu and J Zhang,“Virtual MIMO in multi-cell distributed antenna systems: coordinated transmissions with largescale CSIT,”IEEE Journal on Selected Areas in Communications, vol. 31, no. 10, 2013, pp.2067-2081.
[30] W. Feng, Y. Wang, D. Lin,et al. “When mmWave Communications Meet Network Densification:A Scalable Interference Coordination Perspective,”IEEE Journal on Selected Areas in Communications, vol. 35, no. 7, 2017, pp. 1459-1471.
[31] P. E. Heegaard, K. S. Trivedi, “Survivability quantification of communication services,”Proc.IEEE International Conference on Dependable Systems and Networks with Ftcs and DCC, 2008,pp. 462-471
[32] J. C. Knight, K. J. Sullivan, “On The Denition Of Survivability”, 2003.
[33] V. R. Westmark, “A definition for information system survivability,”Proc. of the 37th Hawaii International Conference on System Sciences,2004, pp. 1-10.
[34] W. J. Stewart, “Introduction to the Numerical Solution of Markov Chains, ”DBLP, 1994.
[35] H Hermanns, J. P. Katoen, J. Meyerkayser,et al. “A Markov Chain Model Checker,”Lecture Notes in Computer Science, vol. 1785, 2000, pp. 347-362.
[36] B. Plateau, K. Atif, “Stochastic Automata Network For Modeling Parallel Systems,”IEEE Transactions on Software Engineering,vol. 17, no. 10,1991, pp. 1093-1108.
[37] M. Ajmone Marsan, G. Conte, G. Balbo, “A class of generalized stochastic Petri nets for the performance evaluation of multiprocessor systems,”Acm Transactions on Computer Systems,vol. 2, no. 2, 1984, pp. 93-122.
[38] M. Hlynka, “Queueing Networks and Markov Chains (Modeling and Performance Evaluation With Computer Science Applications),”Technometrics, vol. 49, no. 1, 2006, pp. 104-105.
杂志排行
China Communications的其它文章
- Smart Caching for QoS-Guaranteed Device-to-Device Content Delivery
- HASG: Security and Effcient Frame for Accessing Cloud Storage
- An SDN-Based Publish/Subscribe-Enabled Communication Platform for IoT Services
- Energy Effcient Modelling of a Network
- A Survey of Multimedia Big Data
- CAICT Symposium on ICT In-Depth Observation Report and White Paper Release Announcing “Ten Development Trends of ICT Industry for 2018-2020”
