Improved evidential fuzzy c-means method
2018-03-07JIANGWenYANGTianSHOUYehangTANGYongchuanandHUWeiwei
JIANG Wen,YANG Tian,SHOU Yehang,TANG Yongchuan,and HU Weiwei
School of Electronics and Information,Northwestern Polytechnical University,Xi’an 710072,China
1.Introduction
Recently,image processing is more and more important.In the existing image processing technology,image fusion is an important part in the information fusion,which can greatly reduce the uncertainty and inaccuracy of information.At the same time,image segmentation is an essential task in image processing and computer vision applications[1–4].The purpose of image segmentation is to divide the given images into different regions for subsequent processing based on the claim.Detecting generic object categories is a fundamental issue in computer vision[5].It has to be done despite many hurdles like noise,nonuniform illumination,and uneven contrast in other homogenous re-gion[6].For example,in the field of medicine,the complexity of breast cell histopathology(BCH)images makes reliable segmentation and classification hard[7].With the development of medical imaging technology,magnetic resonance imaging(MRI)has become more and more popular[8].Medical images are indispensable for disease diagnosis.For example,disease identification is conducted by using the YUV quantitative analysis of auto fluorescence bronchoscopy(AFB)images in the target areas[9].Noise,partial volume effect(PVE)and intensity non-uniformity(INU)[10]are three main norms in MRI.The main source of noise is divided into biological and scanning noise.Organizational unevenness and limitations in hardware design are the primary causes of biological and scanning noise.
In practical applications,it is difficult to get the precise information[11].How to deal with the uncertain information conflict information effectively is still an open issue.Information fusion techniques could be used to increase the decisions accuracy by decreasing the imprecision and uncertainty of the information through the use of redundancy.To process the uncertain information and improve the prise of the information,many mathematical methods are proposed such as fuzzy sets theory[12],Dempster-Shafer evidence theory(DS theory)[13–17],rough sets theory[18,19]and Z-numbers[20,21].DS theory[22–24]was introduced by Dempster and then developed by Shafer..DS theory can well describe and process uncertainty information by assigning probability to a set,therefore it is diffusely used in information fusion[25].
In recent years,many kinds of images are studied and used[26–28].In the medical image processing[29,30],to the best of our knowledge,MRI images are applied to accurate image segmentation since MRI is safer and less invasive compared to computed tomography(CT)scans[31].It plays an essential role in the assessment of various disease, brain development and treatment progress.Moreover,image segmentation[32–34]is widely applied to image processing[35].Some methods based on mixed intelligent algorithms are utilized for image segmentation[36–39].Some researchers have applied the DS theory to image segmentation.For example,Liu et al.[40]have applied the DS theory to one image to get a bet-ter image fusion result and some other researchers have combined the DS theory with other algorithms or modified fuzzy c-means(FCM)for image segmentation and image fusion[41–43].
However,we notice that most of the existing methods do not premeditate the conflict information in the multiple sources images and spatial information.Only a few methods are based on spatial information[44–46].However,in these methods,both the conflict information and the effect of the different spatial locations are not considered.In this paper,a method is proposed to obtain a better image segmentation result.Firstly,an average fusion image is obtained by average fusion to realize the processing of the conflict information between the two images,and it also can reduce the effect of the motion noise.Secondly,FCM is applied to the average fusion image to get two kinds of mass functions.One mass function is generated without any spatial information,which can contain rich boundary information.The other mass function is generated by considering the influence of spatial location information of neighborhood pixels.Finally,the final data fusion is achieved by the DS theory,which is used to complete the image segmentation.
The remainder of this paper is organized as follows.The basic concepts are briefly introduced in Section 2.In Section 3,our method is proposed and applied to the simulated images.Fusion results of MRI images segmentation are demonstrated in Section 4,which show the efficiency of the proposed method.Finally,this paper is concluded in Section 5.
2.Preliminaries
2.1 DS theory
In this subsection,the DS theory is briefly introduced.
definition 1If Θ is a frame of discernment(FOD),then a function m:2Θ→ [0,1]is a basic probability assignment(BPA)[14]whenever

The quantity m(A)is the basic probability number of A,and it can be understood as the belief that is exactly given to A.If m(A)>0,A is a focal element.
definition 2Suppose m1and m2are two BPAs on the same FOD Θ.Then the Dempster’s combination rule[14]is defined as

2.2 Fuzzy clustering by FCM
The FCM algorithm is an unsupervised fuzzy clustering algorithm.The clustering analysis is defined as the process of grouping objects which are similar in some respects[49].Under the condition of a general formulation,the data to be classified can be expressed as an M-dimensional vector X={x1,x2,...,xM}.Assuming that C>2 is an integer designating the number of clusters,where X will be classified.RC×Mis the set of all real C×M matrices.A fuzzy C-partition of X is represented as,where μik= μi(xk)represents the degree of membership of the element xkin the cluster i.The following constraints can be verified[47,48]:

where U is used to depict the clusters of X,and a partition of X can be obtained by the min of the FCM objective function[50]:

where q∈[1,+∞]decides the fuzzy degree of classification results[51],and V =(v1,v2,...,vC)is the vector of the cluster centers.The approximate optimization of Jqcan be obtained by iteration with the following formulas.
In the FCM algorithm[47,48]:assume?xk-vi?2>0,1≤i≤C,1≤k≤M.Jqcan be minimized by(U,V),only if

The FCM algorithm is composed by iterations alternating between(5)and(6).The algorithm is restrained to either a saddle point of Jqor a local minimum.
Step 1Give a value as the number of clusters C and the threshold value ε,where 2 < C < L,L is the number of gray levels.
Step 2Initialize μikas the following way:

Step 3Calculate the centroid viby(6).
Step 4Renew the membership degrees

Step 6Defuzzification.
In general,clusters are exact number,and q is often defined as 2.The clustering process is stopped when ε≤10-5.
2.3 Weighted average fusion of images[52]
The processing of conflict information[53]is very important for the fusion of multiple sources images.In this paper,the weighted average fusion of images is used to better decrease the conflict information among the multiple sources images,which can effectively realize the convergence.Taking the two sources images fusion process as an example,and the process of fusion is explained as follows.Multiple sources images smoothing can be done in the same manner. Assuming that sources images are named as A and B respectively,and the size of images is M×N.The image after fusion is named as F.Then,a weighted average fusion process can be represented on the basis of the pixel gray values of two sources images A and B,as follows[52]:

where m=1,2,...,M is the number of rows of pixels in the image,n=1,2,...,N is the number of columns of pixels in the image.ω1and ω2are the weighted coefficients,and ω1+ ω2=1.The weighted coefficients are used to adjust the importance of different images for the final fusion result.If ω1= ω2=0.5,the process is named as the average fusion of images.It shows that the two images have the same importance in the final fusion result.If one is more important than the other,we can give it a higher weight.
3.The proposed method
The general steps of the proposed method are shown in Fig.1.Our proposed method performs the image fusion twice.Firstly,the average fusion is used to get one fusion image,which can realize the decrease of the conflict information between the two images.The effect of the motion noise and uncertainty of the images can be reduced,too.Secondly,the neighborhood information and the different influence of spatial location of neighborhood pixels are taken into consideration to take full use of the spatial information.Finally,the fusion of the two images is completed by the DS theory to achieve the final image segmentation.Then how to generate the two mass functions is presented before the general steps of the proposed method is introduced.

Fig.1 Step chart of the proposed method
3.1 Determination of mass function without neighboring information
One mass function is determined without the neighborhood pixels information to protect boundaries information.The simple hypotheses and the double hypotheses are generated separately by the following process[44].
The generation of BPA is like this:if|μi(l)-μt(l)|> δ,then the simple hypotheses BPA is generated as

If|μi(l)- μt(l)|≤ δ[44],the generation of double hypotheses BPA is


Fig.2 Construction of double hypothesis by membership functions without spatial information

Fig.3 The 3×3 neighbors lattice of(x,y)
In the end,the BPA m is obtained by normalizing the power set 2Θso as to satisfy


3.2 Determination of mass function with neighboring information
The other mass function is generated with the neighboring information,which also makes the boundaries blurred.A part of the boundary information will be lost.The central pixels membership function is calculated by weighting those of its neighboring pixels with the Gaussian filtered membership function.

The simple hypotheses and the double hypotheses are generated by the following process.The BPA generation method is like(9)and(10).


3.3 General steps of the proposed method
The proposed method involves the following steps.
Step 1An average fusion image is obtained by average fusion of the two original images,according to(1)where ω1= ω2=0.5.The average fusion is simple and intuitive,which is suitable for real-time processing.It can improve the signal to noise ratio(SNR)of the image and eliminate the pole to some extent.
Step 2The FCM is applied to the average fusion image.
Step 3One mass function can be directly got with FCM,yet it does not include domain pixel points information.Its simple hypotheses and double hypotheses can be obtained according to Section 3.1 and Fig.2.The other mass function with the spatial neighborhood information is obtained by the Gaussian filtered membership functions related to the pixel(x,y).In Fig.3 and(13),it considers not only the effect of pixels,but also the influence of location of the neighborhood pixels.Every pixel is only associated with a few nearest neighbors[54].According to the practical analysis,the nearer the neighborhood pixel is to the center pixel,the bigger influence of the pixel should be,and the greater the weighting coefficient should be used.The simple hypotheses and the double hypotheses can be obtained in Section 3.2 and in Fig.4.

Fig.4 Construction of the two sub-sets hypothesis by triangular membership functions with spatial information
Step 4Data fusion by the DS theory.The Dempster’s combination rule is applied to the sensor data fusion result.
Step 5Make decision and segment image.
3.4 Test and analysis
To demonstrate the accuracy and the effectiveness of our proposed method,Gaussian noise,whose expectation is 0 and the variance is 0.015,is added to two images.The figure of the bright background is used to simulate a strong X-ray acquisition.As shown in Fig.5(a),the upper gray belt is close to the background gray,which is easy to be confused.Fig.5(b)is used to simulate a weak X-ray acquisition.Gray belts of two layers below are difficult to be distinguished in Fig.5(b).Fig.6(a)and Fig.6(b)are segmentation results of Fig.5(a)and Fig.5(b)respectively by FCM.In Fig.6(a)and Fig.6(b),the four regions are not presented evidently.Fig.6(c)and Fig.6(d)are the edge detection results of Fig.6(a)and Fig.6(b)respectively.In Fig.6(c)and Fig.6(d),the detected edges are not clear and accurate.The fusion results by using the method[44]and the proposed method are shown in Fig.7(a)and Fig.7(b)respectively.Fig.7(c)and Fig.7(d)are the edge detection results of Fig.7(a)and Fig.7(b)respectively.In this paper,the Canny edge detector operation[55]is chosen to identify the edges of the image. It has the following advantages.
(i)It can effectively restrain noise and pinpoint the location of the edge.
(ii)It can carry out the measure according to the SNR and product positioning to get the optimal approximation operator.

Fig.5 Simulation images for fusion
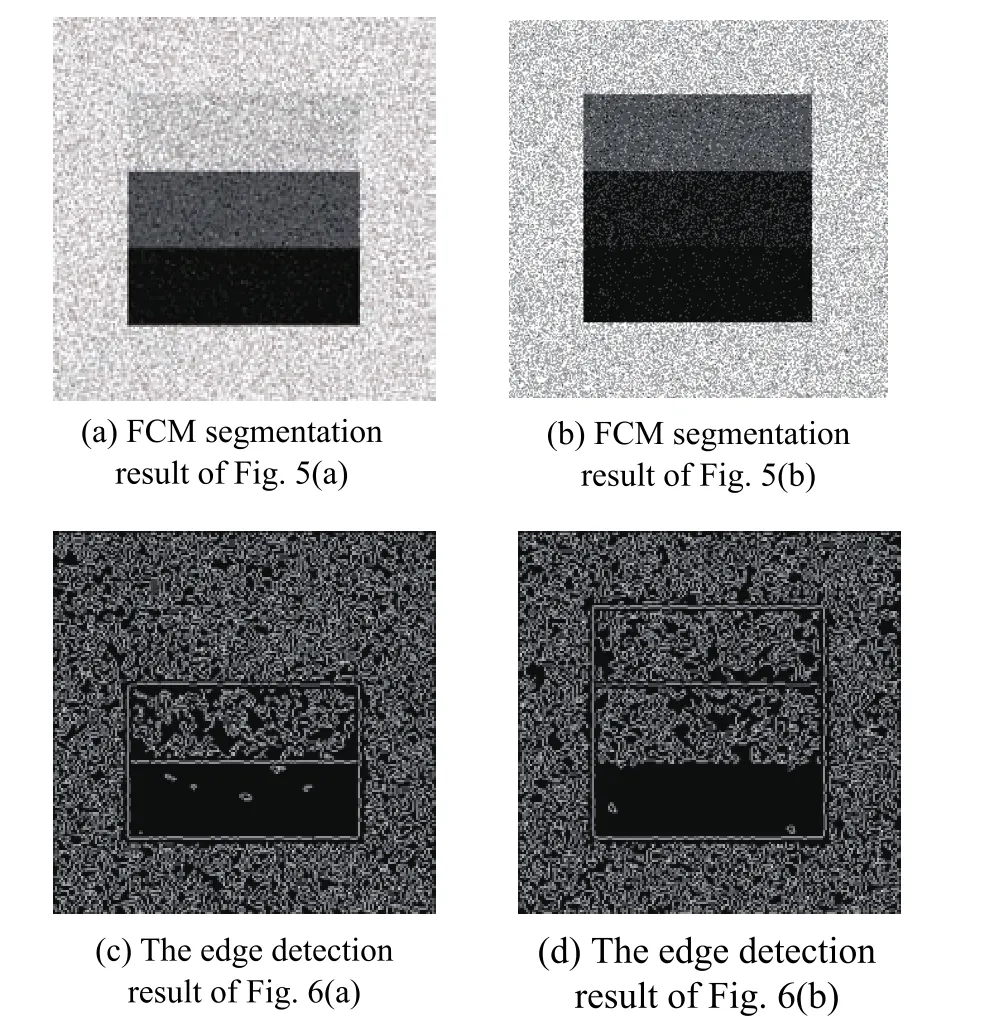
Fig.6 FCM segmentation results and edge detection results of the images

Fig.7 DS segmentation results and edge detection results
The purpose of the edge detection is to obtain the local maximum of the image gradient,which is calculated by using the derivative of the Gaussian filter.The Canny’s method uses two thresholds to distinguish strong and weak edges.For weak edges,they are only included in the output when they are attached to a strong one.Thus the Canny detection is not susceptible to noise,and it can detect the weak edges.From the comparison of Fig.7(a)and Fig.7(b),the four regions are clearly presented by the proposed method.From the comparison of Fig.7(c)and Fig.7(d),the edges detected by our method are more clear and accurate.Above all,the sensor data fusion results and the edge detection results with the proposed method are more perfect.
4.Numerical examples of the MRI images and results
In this section,two slices of a human brain are selected to do the experiment.One is the normal brain tissue,and the other one is the abnormal brain tissue with infarction lesion.They are from the same patient.Fig.8(a),Fig.8(b),Fig.8(c)and Fig.8(d)are corresponding to the slice of the normal brain tissue.Fig.8(a)is T2 weighted image,and Fig.8(b)is D weighted image.The conflict information[56–59]is shown obviously between Fig.8(a)and Fig.8(b).The segmentation result by the Zhu et al’s method[44]is shown in Fig.8(c).In Fig.8(c)and Fig.8(e),segmentation results cannot better help the doctor make accurate decision,because the Zhu et al’s method does not consider the process of the conflict information between the two images.In Fig.8(e),Liu et al’s method does not consider the multi-source image information.The sensor data fusion result with the proposed method is shown in Fig.8(d).The shape and size of brain tissues are well segmented in Fig.8(d).From the comparison,the better segmentation performance can be obtained by the proposed method.The fusion result of the normal brain tissue shows the effectiveness of the proposed method.Furthermore,the two methods are used in the other slice of the brain tissue with infarction lesion.Fig.9(a),Fig.9(b),Fig.9(c)and Fig.9(d)are corresponding to the slice of the abnormal brain tissue with infarction lesion.Fig.9(a)is T2 weighted image,and Fig.9(b)is D weighted image.Similarly,there is conflict information between Fig.9(a)and Fig.9(b).In Fig.9(c),Fig.9(d)and Fig.9(e),the presence of four classes is shown by the segmentation result:they are gray matter,white matter,infarction lesion of the brain and cerebrospinal fluid,and background.InFig.9(d),the segmented regions have significant improvement in increasing boundary precision.The homogeneous region enables the brain tissue volumes measured correctly.The location of the lesion is more accurate.The fusion results of the abnormal brain tissue show the validity of the proposed method as well.In both cases,the proposed method,which better decreases the conflict information in multiple sources images to achieve convergence and efficiently uses the information of the spatial location of the neighborhood pixels,and has a significant improvement in the sensor data fusion results by the DS theory to realize better image segmentation results.It can help doctors to make decisions effectively.

Fig.8 Normal brain tissue-MRI images segmentation
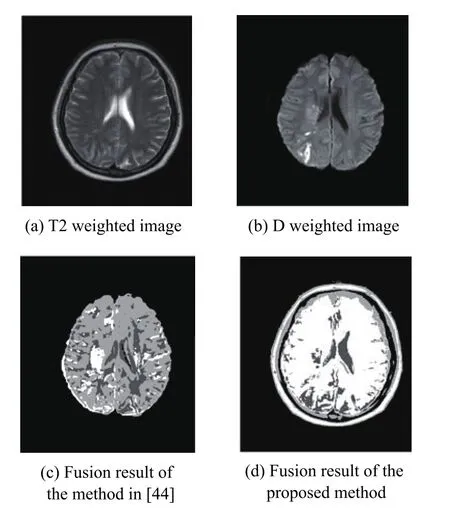
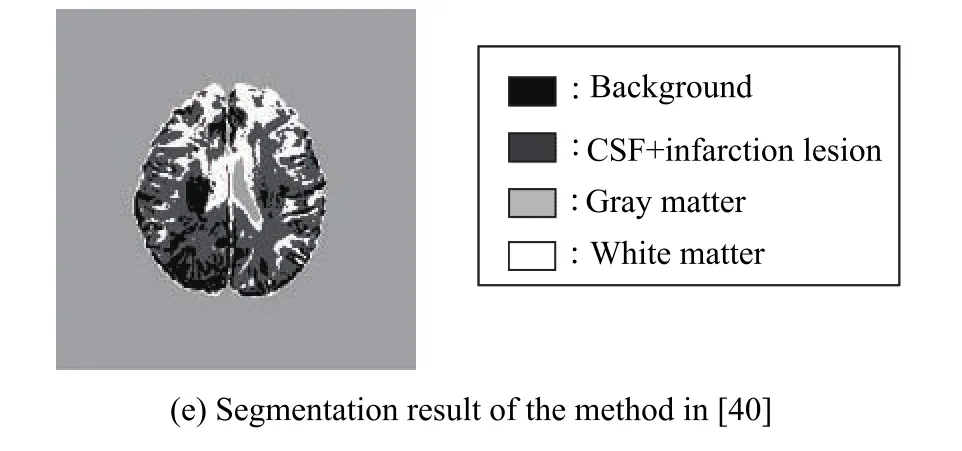
Fig.9 Abnormal brain tissue-MRI images segmentation
5.Conclusions
In this paper, a new method, which effectively reduces the conflict information between the two images and efficiently uses the information of the spatial location of the neighborhood pixels, is proposed.One mass function withoutspatial information is generated by applying the FCM algorithm to the image of average fusion to contain rich boundaries information. The other mass function is generated by considering the spatial location information of neighborhood pixels. The final data fusion is completed by the DS theory to realize the image segmentation. Also, our method is robust in decreasing the effect of noise. The simulated images show notable validity in increasing boundary precision and region harmony. At the same time, the experimental results with the MRI images demonstrate that our proposed method is more reasonable and accuracy in handling vague edges and in better solving the conflict information in the multiple sources images to achieve convergence.
[1]EKLUND A,DUFORT P,FORSBERG D,et al.Medical image processing on the GPU-past,present and future.Medical Image Analysis,2013,17(8):1073–1094.
[2]TONG T,WOLZ R,COUP P,et al.Segmentation of MR images via discriminative dictionary learning and sparse coding:application to hippocampus labeling.Neuroimage,2013,76(1):11–23.
[3]WANGH,DASSR,SUHJ W,et al.Alearning-based wrapper method to correct systematic errors in automatic image segmentation:consistently improved performance in hippocampus,cortex and brain segmentation.Neuroimage,2011,55(3):968–985.
[4]STOKKING R,VINCKEN K L,VIERGEVER M A.Automatic morphology based brain segmentation(mbrase)from MRI-T1 data.Neuroimage,2000,12(6):726–38.
[5]WANGB,XIONGH,JIANG X,et al.Data-driven hierarchical structure kernel for multiscale part-based object recognition.IEEE Trans.on Image Processing,2014,23(4):1765–1778.
[6]KITTANEH O A,KHAN M A U,AKBAR M,et al.Average entropy:a new uncertainty measure with application to image segmentation.American Statistician,2016,70(1):18–24.
[7]WANG P,HU X,LI Y,et al.Automatic cell nuclei segmentation and classification of breast cancer histopathology images.Signal Processing,2016,122(9/10):1–13.
[8]XIE K,YANG J,ZHANG Z G,et al.Semi-automated brain tumor and edema segmentation using MRI.European Journal of Radiology,2005,56(1):12–19.
[9]ZHENGX,XIONGH,YONG LI,et al.Quantization methodology of auto fluorescence bronchoscopy image in the YUV system.Chinese Journal of Lung Cancer,2014,17(11):797–803.
[10]GHASEMI J,GHADERI R,MOLLAEI M R K,et al.A novel fuzzy Dempster-Shafer inference system for brain MRI segmentation.Information Sciences,2013,223(2):205–220.
[11]XIONG H,ZHENG D,ZHU Q,et al.A structured learning based graph matching method for tracking dynamic multiple objects.IEEE Trans.on Circuits and Systems for Video Technology,2013,23(3):534–548.
[12]ZADEH L A.Fuzzy sets.Information and Control,1965,8(3):96–114.
[13]ZHANG Q,LI M,DENG Y.Measure the structure similarity of nodes in complex networks based on relative entropy.Physica A:Statistical Mechanics and Its Applications,2018,491:749–763.
[14]LIU T,DENG Y,CHAN F.Evidential supplier selection based on DEMATEL and game theory.International Journal of Fuzzy Systems,2017,2:1–13.
[15]DENG Y.Generalized evidence theory.Applied Intelligence,2015,43(3):530–543.
[16]JIANG W,XIE C H,ZHUANG M Y,et al.Failure mode and effects analysis based on a novel fuzzy evidential method.Applied Soft Computing,2017,57:672–683.
[17]JIANG W,WEI B,LIU X,et al.Intuitionistic fuzzy power aggregation operator based on entropy and its application in decision making.International Journal of Intelligent Systems,2018,33(1):49–67.
[18]WALCZAK B,MASSART D L.Rough sets theory.Chemometrics&Intelligent Laboratory Systems,1999,47(1):1–16.
[19]GRECOS,MATARAZZO B,SLOWINSKI R.Rough sets theory for multicriteria decision analysis.European Journal of Operational Research,2001,129(1):1–47.
[20]ZADEH L A.A note on z-numbers.Information Sciences,2011,181(14):2923–2932.
[21]ZHANG R,BAABAK A,DENG Y.A novel method for forecasting time series based on fuzzy logic and visibility graph.Advances in Data Analysis and classification,2017,11(4):759–783.
[22]JIANG W,ZHAN J.A modified combination rule in generalized evidence theory.Applied Intelligence,2017,46(3):630–640.
[23]DENG X,JIANG W.An evidential axiomatic design approach for decision makingusing the evaluation of belief structure satisfaction to uncertain target values.International Journal of Intelligent Systems,2018,33(1):15–32.
[24]ZHANG X,DENG Y,CHAN F,et al.Supplier selection based on evidence theory and analytic network process.Proc.of the Institution of Mechanical Engineers,Part B:Journal of Engineering Manufacture,2016,230(3):562–573.
[25]ZHENG X,DENG Y.Dependence assessment in human reliability analysis based on evidence credibility decay model and IOWA operator.Annals of Nuclear Energy,2018,112:673–684.
[26]CHEN X,LI J,ZOU D,et al.Learn sparse dictionaries for edit propagation.IEEE Trans.on Image Processing,2016,25(4):1688–1698.
[27]CHEN X,ZHOU B,LU F,et al.Garment modeling with a depth camera.ACM Trans.on Graphics,2015,34(6):1–12.
[28]WANG B,LIN D,XIONG H,et al.Joint inference of objects and scenes with efficient learning of text-object-scene relations.IEEE Trans.on Multimedia,2016,18(3):507–520.
[29]SAHA S,ALOK A K,EKBAL A.Brain image segmentation using semi-supervised clustering.Expert Systems with Applications,2016,52(C):50–63.
[30]RINGENBERG J,DEO M,DEVABHAKTUNI V,et al.Automated segmentation and reconstruction of patient-specific cardiac anatomy and pathology from in vivo MRI.Measurement Science and Technology,2012,23(12):125405.
[31]KHALVATI F,SALMANPOUR A,RAHNAMAYAN S,et al.Sequential registration based segmentation of the prostate gland in MRimage volumes.Journal of DigitalImaging,2016,29(2):254–263.
[32]RUDZ S,CHETEHOUNA K,HAFIANE A,et al.Investigation of a novel image segmentation method dedicated to forest fire applications.Measurement Science and Technology,2013,24(7):075403.
[33]BENDJEBBOUR A,DELIGNON Y,FOUQUE L,et al.Multisensor image segmentation using Dempster-Shafer fusion in Markov fields context.IEEETrans.on Geoscience and Remote Sensing,2001,39(8):1789–1798.
[34]FENG X,WILLIAMS C,FELDERHOF S.Combining belief networks and neural networks for scene segmentation.IEEE Trans.on Pattern Analysis and Machine Intelligence,2002,24(4):467–483.
[35]FABIJANSKA A.Yarn image segmentation using the region growing algorithm.Measurement Science and Technology,2011,22(11):114024.
[36]LIU H T,SHEU T W H,CHANG H H.Automatic segmentation of brain MR images using an adaptive balloon snake model with fuzzy classification.Medical&Biological Engineering&Computing,2013,51(10):1091–1104.
[37]SCHEUERMANN B,ROSENHAHN B.Multi-sensor fusion for video segmentation.International Journal of Pattern Recognition and artificial Intelligence,2014,28(7):4600155.
[38]CHEN Y,CREMERS A B,CAO Z.Interactive color image segmentation via iterative evidential labeling.Information Fusion,2014,20(1):292–304.
[39]HARRABI R,BRAIEK E B.Color image segmentation using multi-level thresholding approach and data fusion techniques:application in the breast cancer cells images.Eurasip Journal on Image and Video Processing,2012,2012(1):11.
[40]LIU J,LU X,LI Y,et al.A new method based on Dempster-Shafer theory and fuzzy c-means for brain MRI segmentation.Measurement Science and Technology,2015,26(10):105402.
[41]MAKNI N,BETROUNI N,COLOT O.Introducing spatial neighborhood in evidential c-means for segmentation of multisource images:application to prostate multi-parametric MRI.Information Fusion,2014,19(11):61–72.
[42]ROMBAUT M,ZHU Y.Study of Dempster-Shafer theory for image segmentation applications.Image and Vision Computing,2002,20(1)15–23.
[43]VIVIER P H,DOLORES M,GARDIN I,et al.In vitro assessment of a 3D segmentation algorithm based on the belief functions theory in calculating renal volumes by MRI.American Journal of Roentgenology,2008,191(3):127–134.
[44]ZHU Y,BENTABET L,DUPUIS O,et al.Automatic determination of mass functions in Dempster-Shafer theory using fuzzy c-means and spatial neighborhood informationfor image segmentation.Optical Engineering,2002,41(4):760–770.
[45]GHASEMI J,MOLLAEI M R K,GHADERI R,et al.Brain tissue segmentation based on spatial information fusion by Dempster-Shafer theory.Journal of ZheJiang University-Science C-Computers&Electronics,2012,13(7):520–533.
[46]GHASEMI J,MOLLAEI M R K,GHADERI R,et al.Region merging strategy for brain MRI segmentation using Dempster-Shafer theory.Iranian Journal of Fuzzy Systems,2013,10(2):41–56.
[47]CANNON R L,DAVE J V,BEZDEK J C.efficient implementation of the fuzzy c-means clustering algorithms.IEEE Trans.on Pattern Analysis&Machine Intelligence,1986,8(2):248–255.
[48]MLLER H,MICHOUX N,BANDON D,et al.A review of content based image retrieval systems in medical applications clinical bene fits and future directions.International Journal of Medical Informatics,2009,78(9):1–23.
[49]GUO Y,SENGUR A.NECM:neutrosophic evidential cmeans clustering algorithm.Neural Computing&Applications,2015,26(3):561–571.
[50]BEZDEK J C,EHRLICH R,FULL W.The fuzzy c-means clustering algorithm.Computers&Geosciences,1984,10(2):191–203.
[51]KANNAN S R,RAMATHILAGAM S,DEVI R,et al.Strong fuzzy c-means in medical image data analysis.Journal of Systems and Software,2012,85(11):2425–2438.
[52]LIR,ZHANGYJ.Level selection for multiscalefusion of out of-focus image.IEEE Signal Processing Letters,2005,12(9):617–620.
[53]MURPHY C.Combining belief functions when evidence conflicts.Decision Support Systems,2000,29(1):1–9.
[54]CHEN X,ZOU D,ZHAO Q,et al.Manifold preserving edit propagation.ACM Trans.on Graphics,2012,31(6):132.
[55]PERFILIEVA I,HODKOV P,HURTK P.Differentiation by the f-transform and application to edge detection.Fuzzy Sets&Systems,2016,288(C):96–114.
[56]XU S,JIANG W,DENG X,et al.A modified physaruminspired model for the user equilibrium traffic assignment problem.Applied Mathematical Modelling,2017,55:340–353.
[57]DENG X,XIAO F,DENG Y.An improved distance-based total uncertainty measure in belief function theory.Applied Intelligence,2016,46(4):1–18.
[58]ZHENG H,DENG Y.Evaluation method based on fuzzy relations between Dempster-Shafer belief structure.International Journal of Intelligent Systems,2017:21956.
[59]DENG X,HAN D,JEAN D,et al.Evidence combination from an evolutionary game theory perspective.IEEE Trans.on Cybernetics,2016,46(9):2070–2082.
杂志排行

Journal of Systems Engineering and Electronics的其它文章
- Heterogeneous performance analysis of the new model of CFAR detectors for partially-correlated χ2-targets
- Quantum fireworks algorithm for optimal cooperation mechanism of energy harvesting cognitive radio
- Cognitive anti-jamming receiver under phase noise in high frequency bands
- Multi-channel signal parameters joint optimization for GNSS terminals
- Waveform design for radar and extended target in the environment of electronic warfare
- Cramer-Rao bounds for the joint delay-Doppler estimation of compressive sampling pulse-Doppler radar