Heterogeneous performance analysis of the new model of CFAR detectors for partially-correlated χ2-targets
2018-03-07ELMASHADEMohamedBakry
EL MASHADE Mohamed Bakry
Electrical Engineering Department,Faculty of Engineering,Al Azhar University,Nasr City 11371,Egypt
1.Introduction
With a view to extend the capability of human’s vision sense for observing the environment,the radar was emergent.The value of radar lies not in being a substitute for the eye,but in doing what the eye cannot do.It can neither resolve detail as well as the eye nor recognize the color of objects to the degree of sophistication which the eye is capable of.However,its operation is unaffected by meteorological conditions which means that it can be designed to see through those conditions impervious to normal human vision,such as darkness,haze,fog,rain,and snow.In contrary to human eyes,which observe the whole field of view simultaneously,radar can either view one object of interest(tracking radar)or scan their surroundings and view many objects one after another(surveillance radar).It has the merit of being able to measure the distance or range to the object and this is probably its most important attribute.Additionally,its detection ranges and the angular domain it covers make it an essential tool for continuous surveillance of a very wide area.
Thanks to the wide range of information that it provides in many different and usually adverse conditions where other information gathering tools fail,the radar has found use in security and science applications since its emergence.It was originally developed to satisfy the needs of the military for surveillance and weapon control.However,modern military operations are resulted in a sophisticated,multidimensional and disruptive environment.For this reason,military applications have funded much of the development of its technology.In other words,the most demanding requirements for radar systems have so far nearly always resulted from military objectives.Military radars span the range from huge ballistic missile defense systems to fist-sized tactical missile seekers.
Most uses of radars can be classified as detection,tracking,or imaging.In this research,the emphasis is on detection since it represents the most fundamental problem in radar.This requires determining whether the receiver output at a given time represents the echo from a reflecting object or only noise.From this point of view,constant false alarm rate(CFAR)techniques have been developed to keep the receiver output level constant against Rayleigh-distributed clutter and effectively suppresses the clutter to the receiver noise level.The CFAR portion of the receiver is usually found just before the detection decision is made.It is required to maintain the false-alarm rate constant as the clutter and/or noise background varies.Its purpose is to prevent the automatic tracker from being overloaded with extraneous echoes.It senses the magnitude of the radar echoes from noise or clutter in the near vicinity of the target and uses this information to establish a threshold so that the noise or clutter echoes are rejected at the threshold and not confused as targets by the automatic tracker.
Detectors constructed based on the CFAR principle are differed by processing procedures of data stored in the ref-erence cells of the sliding window.In other words,avariety of CFAR techniques are developed according to the logic used in estimating the unknown noise power level.The most primitive CFAR processor is the cell-averaging(CA)technique which uses the maximum likelihood estimate of the noise power to set the adaptive threshold under the assumption that the underlying noise distribution has an exponential form.This detector has an optimum detection performance in the case of homogeneous noise.However,the homogeneous situation of noise is rarely found owing to spatial and temporal variations in the noise power and closely spaced target return signals that may be a reason of the estimated noise power bias and,consequently,the detection threshold varies.In this situation,a class of CFAR detectors,namely,the ordered statistic(OS)scheme,the censored mean-level detector(CMLD),the trimmedmean(TM)procedure,the generalized trimmed-mean(GTM)strategy,the automatic censoredCA(ACCA)algorithm,the automatic censored greatest of(ACGO)processor,the weighted cell averaging(WCA)model,the moving order statistics(MOS)style,the excision(EX)mechanism,the variability index(VI)mode,and the switching(SW)technique can be employed.Because of the diversity of the radar search environment(multiple target,abrupt changes in clutter,etc.)there exists no universal CFAR scheme[1–7].
Scattering of radar targets has become one of the most important parts of modern radar system analysis.The radar designer needs the target radar cross section(RCS),which is the effective scattering area of a target as seen by the radar,to be properly specified for evaluation of radar performance in various conditions.In general,the target RCS has a fluctuating nature which can be visualized if we think of the target as consisting of a large number of individual scatterers.The extent to which the scatter from these scatterers adds up or cancels in the direction of the radar depends upon their relative phases.If the phases are more or less the same,the backscatter will add up to a large sum.If they are not,the sum may be comparatively small.The relative phases depend upon the instantaneous distances in wavelengths of the reflectors from the radar.Because of the round trip nature of the transmission,a difference in distance of λ/4 makes a difference in phase of π.Since the wavelength may be very short,relatively small changes in target aspect,even vibration,can cause the target to return to scintillate.And since the configuration of many targets is radically different when viewed from different directions,larger changes in aspect may produce strong peaks or deep fades.Over a period of time,these variations will usually average out.But if the radar-bearing aircraft is approaching on a course that holds a target in the same relative aspect,a peak or fade may persist for some time.Therefore,the detection range of a fluctuating target in a noise background is one of such valuable performance measures[8,9].
If there is correlation between target samples,the detection CFAR processor performance degrades severely over that for uncorrelated target samples.To overcome the performance degradation due to correlated target samples,the number of samples must be integrated for a desired detection probability given that the fixed false alarm rate is held unchanged.Because of the target’s characteristics play an important role in the design and performance analysis of all radar systems,this paper is devoted to the analysis of the novel model of adaptive schemes,which is known as CA GTM,employing M non-coherently integrated pulses for an interesting class of targets which is represented by the so-called moderately fluctuating χ2targets of two degrees of freedom.The illumination of this class by a coherent pulse train will return a sequence of correlated pulses with a correlation coefficient in the range 0< ρ <1(intermediate between SWII and SWI models of χ2fluctuat-ing targets).Section 2 discusses the statistical backgrounds along with the formulation of the underlined problem.The processor performance analysis is carried out in Section 3 and our numerically simulated results,to illustrate the effects of the detector parameters on its performance in the absence as well as in the presence of spurious targets,are presented in Section 4.Finally,our concluded remarks are briefly outlined in Section 5.
2.Statistical backgrounds and problem formulation
Radar clutter constitutes the unwanted radar echoes reflected from unpredicted objects that compete against and interfere with the desired echoes returned from targets of interest.In radar signal detection,the problem is to automatically detect a target in a non-stationary noise and clutter background for a fixed probability of false-alarm.Classical detections employing matched filter receiver and fixed threshold are unavailable owing to the non-stationary nature of the background noise.Therefore,the signal processor must either be insensitive to the statistical properties of the clutter and interference or be able to adapt to a changing environment.In this work,we concentrate on the adaptive threshold CFAR processor which sets the threshold adaptively based on local information of total noise power,with noise assumed to be Gaussian distributed.On the other hand,CFAR is widely used to prevent clutter and noise interference from saturating the display of radar and preventing targets from being obscured.It is also necessary for preventing the tracking computer from being overloaded by extraneous clutter targets or noise.However,CFAR maintains the false-alarm rate constant at the expense of the probability of detection.Thus,it causes targets to be missed[7].
A CFAR may be obtained by observing the noise or clutter background in the vicinity of the target and adjusting the threshold in accordance with the measured background.Fig.1 illustrates the CFAR processor under test.It utilizes a tapped delay-line to sample the range cells to either side of the range cell of interest,or test cell.The output of the test cell is the radar output.The spacing between the taps is equal to the range resolution.The outputs from the leading and trailing delay line taps are separately processed.In each case of the processing cells,the unknown noise power level Z is estimated according to the rule of the chosen technique.The resulting noise level is multiplied by an appropriate constant T to define the threshold level ZT against which the content of the tested sample W is compared to decide if it contains target return or not.The threshold at the output of the radar receiver is chosen so as to verify the pre-assigned probability of false-alarm.Since the detection threshold is a function of the background noise,it varies continuously according to the noise or the clutter environment found within a range inter-val surrounding the range cell under observation.In other words,the CFAR may be thoughtof as using the outputs of the sampled cells to estimate the unknown amplitude of the background noise or clutter.Because of the finite number of samples,the background is not completely known and a loss occurs compared to the ideal detector.If the target echo is large,energy can spill over into the adjacent range-resolution cells and affect the measurement of the average background.For this reason,the range cells surrounding the test cell are often omitted when estimating the background[10–12].
A common assumption in the design of many CFARs is that the probability density function of the background noise amplitude is known(usually taken to be Gaussian)except for a scale factor.Clutter,however,is often non-homogeneous and thus non-stationary as well as being of unknown probability density function in some cases.With such uncertainty in the background,a nonparametric method of detection can be used and this is out of the scope of our research.On the other hand,the ability to detect targets is inhibited by the presence of noise and clutter.The signal-to-interference ratio(SIR)and thus the detection performance are often enhanced by integrated multiple samples of the target and interference,motivated by the idea that the interference can be averaged out by adding multiple samples[10,11].

Fig.1 Architecture of CA GTM adaptive threshold scheme
Now,let us go to drive the expression of characteristic function(CF)for χ2targets with two degrees of freedom.The block diagram of the underlined CFAR processor is shown in Fig.1.The input target signal and noise to the square-law detector are represented by the complex vectors xk+jykand uk+jvk,respectively.xkand ykdenote the in-phase and quadrature components of the target signal at the square-law device input,whilst ukand vkindicate the same thing for the noise components,respectively.The tar-get is assumed to be independent of the noise.The in-phase samples are assumed to be independent of the quadrature samples.The noise samples are assumed to be independent and identically distributed(IID)with the Gaussian probability density function(PDF),while the target samples are supposed to be identically distributed but correlated with a correlation matrix Σ.Based on the aforementioned assumptions,the correlation matrix of xk(k=1,2,...,M),takes a mathematical form given by

ρ symbolizes the correlation coefficient between samples.Let W represent the output of M-pulse non-coherent integrator normalized to background noise power where

In the presence of a target,the return signal will contain both the target signal and noise.Usually,the targets have complicated structures,which reflect scatterers with different RCS.A description of a good estimate of target reflection models was introduced by Swerling who described the statistical properties of the RCS of the targets by different models.Essentially all radar target objects produce echo signals having amplitudes that are Rayleigh distributed(exponential distribution of power,or cross section).In general,the effect of fluctuation is to require higher signal-to-noise ratios for high probability of detection and lower values for low probability of detection required with no fluctuating signals.Swerling has bounded the effects of target correlation by considering two limiting situations:the slow fluctuation model(unity ampli-tude correlation on a scan,scan-to-scan independence)and the fast fluctuation model(zero amplitude correlation on a scan,pulse-to-pulse independence).In other words,for the coherent signals,the considered two types of PDF of the ratiowhere σ denotes the target RCS and σ represents its mean value.These PDF’s are:

κ in the above formula represents the degrees of freedom.The values of both PDF’s result from their adequate approximation of real situations for definite target classes.The first one describes the RCS fluctuations of a largesized target in non-radial flight,when the variance of RCS is great,whilst the second PDF describes the RCS fluctuations for a medium-sized target also in non-radial flight.In other words,the first distribution is observed when the target consists of many independent scattering elements of which no single one predominates.Many aircraft have approximately this characteristic at microwave frequencies,and large complicated targets are usually of this nature.The second distribution,on the other hand,corresponds to that of a target having one main scattering element that predominates together with many smaller independent scattering elements.Here,we are interested in the first distribution only for which we are going to analyze the detection performance of the more recently version of adaptive schemes when the background interference is contaminated with spurious target returns.
In the case where the tested target fluctuates in accordance with two degrees of freedom χ2fluctuation model,the integrator output is characterized by a CF[12]of the form

In the above expression,α = σ/2ψ denotes the average signal-to-noise(SNR)and σ symbolizes the average cross section over all target fluctuations.
Let us return to the problem of detection.The CFAR estimates the background power level from the surrounding samples to set a detection threshold adaptively varying with the power level of the noise or the clutter.Heterogeneous environments,such as clutter transitions and multiple targets,are the kind of environments that the CFAR detectors can operate in and still maintain the probability of false alarm.The quality of a radar system is quantified with a variety of figures of merit depending on the function being considered.In analyzing detection performance,the fundamental parameters are the probability of detection Pdand the probability of false alarm Pfa.The achievable combinations are determined by the signal and interference statistics,especially the SIR.The purpose of signal processing in radar is to improve these figures of merit.SIR can be ameliorated by pulse integration.Owing to the ease of implementation of post-detection integration,we choose it to enhance the behavior of the novel version of CFAR schemes in the case where the signal returns from the target of interest(primary)as well as the interfering targets(secondary),which may exist in the operating environment,are partially-correlated.In this situation,it is of importance to formulate Pdand Pfa.The false alarm probability is the probability that noise or other interfering signals will erroneously cause a detection decision at each detection trial.On the other hand,in the spaces between echoes,noise samples are added together.There is a small statistical chance that the energies in fortuitous noise spikes add up to a size that would represent an echo of in-terest.This gives a false alarm which is quite sensitive to the threshold level.As a function of the CF of the tested cell,ΘW(Ω),and that of the noise level estimate,ΘZ(Ω),the false alarm probability can be mathematically evaluated[14]through the formula:
res stands for the residue.In the same manner,the detection probability can be formulated as

The detection probability of a CFAR processor for χ2targets with κ=2 can be obtained by substituting(4)into the definition of Pd,which gives

It is evident from(7)that the key step in the processor performance evaluation is the determination of the CF of its noise power level Z and therefore,we focus our attention,in the following section, on deriving it for the novel version of CFAR processors when it is operated in multi-target environments from which the homogeneous performance can be easily obtained as a special case by vanishing the number of outlying target returns.
3.Target multiplicity performance analysis of CA GTM-CFAR version
The main goal of many applications is to detect targets or unknown sources.Practically,the processing of this detection cannot be performed manually owing to the large amount of information being presented from the data.Therefore,algorithms are developed to reject data with a low likelihood of being related to a target of interest and only present to an observer(or other intelligent process)information with a low likelihood of being noise in such a way that this procedure is achieved automatically.Additionally,in order to obtain predictable and consistent performance,the radar system designer would usually prefer a CFAR.These processing techniques are widely used to automatically facilitate target detection,especially in the non-stationary environments.
Conventional methods of CFAR detection always use windowing,in the sense that some number of cells are in-vestigated and the target present or absent decision is made according to the composition of the cells in that window.The test cell or pixel is associated with data within a reference window,which is assumed to contain noise samples similar to that of the test pixel.Based on the statistics of noise in the reference window,a threshold is calculated.In order to limit error in the adaptive threshold due to the leakage of the target’s energy to the neighborhood cells,some cells directly adjacent to the cell under testing will not be used in the estimation of the clutter power.These adjacent cells are called guard cells.
Generally,the approach used in CFAR processing is based on two major assumptions.Firstly,the neighboring cells contain interference with the same statistics as the cell under test(CUT),so that they are representative of the interference that is competing with the potential target.Secondly,the neighboring cells do not contain any target returns other than the interference.Under these conditions,the interference statistics in the CUT can be estimated from the measured samples in the adjoining cells.
This section addresses the analysis of the more recent version of CFAR algorithms for partially-correlated χ2targets with two-degrees of freedom knowing that the operating environment is infected with spurious targets rather than the target of interest.This version optimizes good fea-tures of the well-known CFAR detectors depending on the characteristics of clutter and present targets with the aim of improving the detection probability in simultaneous with keeping a fixed rate of false alarm[13].It is fulfilled by parallel operation of CA-and GTM-CFAR strategies.The CA scheme and GTM procedure perform their detection processing simultaneously and independently but with the same thresholding factor T.They estimate their own mean clutter power level Z according to the strategy of estimation used in each detection algorithm.Next,they evaluate their own detection thresholds TZCAand TZGTM.The content of the CUT is compared with each one of the resulting thresholds to decide about target presence independently.The final decision about the presence of the target is accomplished through the fusion center which is composed of an“AND”logic circuit.The presence/absence of the target of interest is decided in accordance with the rules of the AND gate which is only active if both the single decision inputs are active, and passive in each one of the other cases.
In order to analyze the performance of this new version when the reference window no longer contains radar returns from a homogeneous background,the assumption of statistical independence of the reference cells is retained.
The multiple-target environment,on the other hand,is the more interesting situation that is frequently encountered in practice in which the reference window contains nonuniform samples.This may occur in a dense environment where two or more potential targets appear among the elements of that window.The amplitudes of all the targets present in the reference window are assumed to be fluctuating in accordance with χ2-distribution of two-degrees of freedom model.Since the novel algorithm of CFAR techniques is composed of CA and GTM procedures,we will outline their performance characteristics individually.
3.1 CA detector
The CA-CFAR processor is very efficient in case of stationary and homogenous interference.It is the optimum CFAR processor when the reference cells contain IID observations governed by an exponential distribution.As the size of the reference window increases,the detection probability approaches that of the optimum detector which is based on a fixed threshold.The CA procedure uses the maximum likelihood estimate of the noise power to set the adaptive threshold under the assumption that the underlying noise samples are identically distributed.However,the processor performance is significantly affected when the assumption of homogeneity is violated.In the case of multiple targets the detection probability of CA degrades seriously due to unnecessary increasing in overall threshold resulting from the noise estimate that includes the interfering signal power[14].
In the CFAR world,the statistics that must be estimated are determined by the statistics needed to implement the threshold test.For Gaussian interference and square-law device,the interference will be exponentially distributed and the interference PDF has only one free parameter which is the mean interference power.Thus,the CFAR processor must estimate the mean interference power in the CUT by using the measured data in the adjoining cells.In this case,the PDF of a cell qi,assuming the interference is IID in the in-phase and quadrature components with power ψ/2 in each,is

U(·)symbolizes the unit-step function.The knowledge of ψ is needed to set the threshold.When exact knowledge of ψ is not available,it must be estimated.Taking into account that the N cells in vicinity of the CUT have an independent and identically distributed interference,their joint PDF represents the likelihood estimate of the parameter of the distribution ψ.Thus,

The estimate value of ψ maximizes the likelihood function L(·).The result of this maximization will lead to

Thus,the maximum likelihood estimate of the noise level in the CUT is equal to the arithmetic mean of the nearby resolution cells.This CFAR approach is referred to as CA.The noise level estimate is then scaled by a constant T,the threshold multiplier,which is chosen in such a way that the designed false alarm rate is held constant.The intent of the adaptive calculation of the threshold is to provide a constant false alarm rate despite varying interference power levels.The output of the CUT is then compared to the adaptive threshold TZ according to

The CA concept relies on two major assumptions.Firstly,targets are isolated which necessitates that targets are separated by at least the reference window size,so that no two are ever in the reference window at the same time.Secondly,all of the reference window interference samples are statistically IID with the same distribution as that of the interference component in the cell containing the target.While useful in many situations,either or both of these constraints are frequently violated in real world scenarios,particularly when the dominant interference is clutter.Therefore,the heterogeneous performance evaluation of CA scheme becomes of practical importance. To achieve this object,suppose that the sample set contains R returns from interfering targets each of strength ψ(1+ γ),where γ denotes the interference-to-noise ratio(INR),and N-R cells contain clear background with power level ψ.The sample mean computed by the detector becomes

In the above expression,qsrefers to the reference sample that contains spurious target return,whilst qcsymbolizes to that belongs to clear background.Since the two groups of samples are statistically independent,the CF of the noise level estimate ZCAhas a mathematical form given by

The CF of the sample that contains interfering target return can be obtained from(4)after replacing the SNR α by INR γ.On the other hand,the CF of the reference sample belongs to the clear background acquired from(4)by vanishing the parameter α.Thus,

To handle our mathematical treatment,the above formulas can be put in another simpler form as

Substituting(15)into(13)yields
It is of importance to note that(16)is valid for single window detector.For double window processor,on the other hand,it is also satisfied to represent the CF of the final noise level estimate after replacing R by R1+R2,where R1denotes the number of cells,belonging to the leading sub-window,which are contaminated with interfering target returns and R2symbolizes the same thing for the lagging sub-window.Therefore,once the CF of the noise level estimate of the CFAR processor is obtained,its detection performance is completely determined as(7)demonstrates.
3.2 GTM detector
An alternative to CA is the class of rank-based or order statistic CFAR.Proposed primarily for combating masking degradation,OS retains the sliding window structure of CA but does away entirely with averaging of the reference window contents to explicitly estimate the interference level.Instead,OS rank orders the reference window data samples to form a new sequence in ascending numerical order.In OS,the Kth order statistic is selected as representative of the interference level and a threshold is set as a multiple of this value.It is evident that the interference is thus estimated from only one actual data sample instead of an average of all of the data samples.Nonetheless,the threshold in fact depends on all of the data since all of the samples are required to determine which will be the Kth largest.The goal of introducing this processor is to combat the problems related to the operation of CA-CFAR in non-homogeneous environments.To find the Kth ordered sample,the values in the reference cells need to be sorted such that

The Kth largest value is chosen as the representative for the estimate of the local clutter level.Thus,

This method does not require guard cells since clutter amplitudes outside q(k)does not affect the calculation of the threshold.By doing this,the problems related to clutter edges and interfering targets may be reduced.However,the performance will be limited by the choice of K.In multiple-target situations,if K is chosen to be N,this will ensure conservation of the false alarm rate,but target detection will be impossible.On the other hand,if K is chosen to be less than the maximum value,the OS-CFAR processor will be influenced only slightly for up to N–K interfering targets.
Because averaging process estimates the noise power more efficiently than selecting an ordered sample,the TM strategy,in which the noise power is estimated by a linear combination of the ordered range samples,has been introduced.This scheme may be thought of as a generalized version of the OS scheme and it is anticipated to give better results,especially in homogeneous situations.The TM-CFAR processor first orders the range cells according to their magnitude and then censors the N1-1 smallest cells and the N-N2largest samples before adding the remaining ones to construct an estimate of the unknown noise power level.Thus,
The more generalized formula GTM of the noise level estimate in trimmed-mean detector is introduced[14]to become

The parameters N1&N2have(K,K)for OS(K)scheme,(1,K)for linearly combined order statistic LCOS(K),and(1,N)for CA algorithm.The parameter ε,on the other hand,equals0 for OS(K)&CA,and N-K for LCOS(K).It is noted that ε=N-K achieves an unbiased estimate for the unknown noise power level[2].
In order to analyze the performance of GTM scheme,it is necessary to transform the ordered statistics q(i)to another sequence of random variables which are statistically independent to facilitate the processor performance evaluation since its calculation is cumbersome as a function of q(i)that are neither independent nor identically distributed.Taking into account that the original samples qiare exponentially distributed random variables,the following trans-formation will make the ordered samples q(i)statistically independent.Thus,

In terms of the CF’s of the ordered statistic q(i),the CF of the RV’s rjcan be mathematically formulated[3]as

As a function of rj,the GTM scenario estimates its unknown noise power level ZGTMusing the relation:

Since the random variables rjare statistically independent,the noise level estimate of the GTM scenario has a CF which is simply given by the individual multiplication of the CF’s of the considered rk.Thus,

As a last step in calculating the underlined processor performance is to evaluate the CF of the Kth ordered sample q(K)out of N samples.In order to achieve this object,consider the case where the reference window comprises of two kinds of cells:those of normal background of N-R cells and those of outlying target returns of R ones.Under these circumstances,the Kth ordered sample has a cumulative distribution function(CDF)[9]of the form:


Fc(·)denotes the CDF of the cell that contains clear background,whilst Fs(·)represents the same thing for the cell that belongs to the spurious target return.With the help of(15),these CDF’s can be computedand their mathematical formulas are

and

By substituting(26)and(27)into(25)and calculating the Laplace transformation of the resulting formula one obtains

where

As a function of the Laplace transformation of the CDF of a random variable q,its CF can be easily calculated[6]as

Hence,the CF of the random variables rjand consequently the CF of the noise level estimate ZGTMare completely evaluated,as(22)and(24)demonstrate.
All the previous analyses are concerned with single window CFAR processor.However,the large processing time taken in ranking the candidates of the reference window limits its using in practical applications.To alleviate the problem mentioned above,the double window strategy,that requires only half the processing time of single window GTM detector,is introduced.In the resulting version of the GTM algorithm,the samples of each sub window are ranked in an ascending order.S1-1 smallest cells and N/2-S2largest ones are excised from the elements of leading sub-window before summing the rest to construct its noise power level Z1.Similarly,T1-1 cells from the lower end and N/2-T2ones from the upper end are trimmed before adding the remainder cells to establish the noise power level Z2of the trailing sub-window.Thus,

By following the same steps of the single window detector,the CF’s of the noise level estimates Z1&Z2can be easily obtained through the using of the same formulas after replacing N,N1,N2,ε,and R by N/2,S1,S2,ε1,and R1for the leading sub-window parameters,and N/2,T1,T2,ε2,and R2for parameters of the trailing sub-window.The two noise level estimates are combined through the mean-level operation to provide the final noise level estimate ZGTM.Thus,

Since Z1and Z2are statistically independent,the resulting noise level estimate has a CF given by

As we have previously stated,once the CF of the noise power level estimate ZGTMis obtained,the processor detection performance can be easily evaluated.
3.3 CA GTM detector
From our previous discussion,it is evident that the CA technique is the optimum one in the world of CFAR detection.It gives the highest detection performance in homogeneous situations with deteriorates behavior against non-homogeneous backgrounds.The GTM procedure reacts well against multi-target environments given that their density lies within their allowable values.However,it suffers minor degradation in its homogeneous performance.In order to exploit the merits of both strategies,the novel version CA GTM is proposed.It optimizes good features of its CFAR candidates with the purpose of increasing the probability of detection keeping the false alarm rate at the constant level.It is realized by parallel operation of CA and GTM algorithms.These CFAR schemes carry out their operations simultaneously and independently.Their noise level estimates are multiplied by the same scaling factor T to build their detection thresholds[15].After comparison with the content in cell under test W,they decide about tar-get presence independently.The final decision about target presence is achieved in fusion center which is composed of an “AND”gate.The final decision of the fusion center is presence of the target in the CUT if and only if both the input single decisions to the fusion center are positive,as the characteristics of AND gate necessitates.Since single decision about target presence of CA and GTM parts of the CA GTM detector are independent events,its false alarm and detection probabilities can be simply formulated with the aid of binary symbol H as

Both the detection and false alarm probabilities of each processor of the CA GTM strategy are previously calculated,the detection performance of the novel version is completely evaluated.Now,we are going to display some of numerical results to verify our mathematical derivation and to show the effect of each parameter that can play in improving or degrading the detection performance of the underlined processor.
4.Presentation of simulation results
Here,we are concerned with giving the reader an idea about the behavior of the novel model against the operating environment when it is free of or contaminated with outlying fluctuating targets following in their fluctuation two-degrees of freedom χ2-distribution.Additionally,we want to see to what extent the post-detection integration enhances the CFAR detection performance under homogeneous as well as heterogeneous situations.Our displayed results are obtained for a sample set of 24 reference cells and a design false alarm rate of 10-6.Fig.2 is devoted to the description of the variation of the thresholding constant T as a function of the false alarm rate for CA,OS(10)or GTM(9,2,0),and CA OS(10)for post-detection integration of two and four pulses.As a reference,this plot comprises the same results for single pulse cases.In the presen-tation of our results,we will undergo the two sub-windows to the same processing and take the mean-level of the two.Therefore,it is sufficient to represent each CFAR processor by the processing that takes place on the elements of each sub-window.For example,the indication of GTM(9,2,0)on a specified curve means that it denotes a double-window detector in which nine smallest cells and two largest ones are trimmed from each sub-window before taken the rest(12-9-2=1)cells which become only one(the 10th ordered statistic)sample to build the noise level estimate.In this case,GTM(9,2,0)tends to the well-known OS(10)scheme.As shown in this figure,the constant scale factor decreases as the false alarm rate increases and the rate of decreasing decreases as M increases.This behavior of curves is logic since increasing the false alarm rate means decreasing the detection threshold and since the estimated noise power is fixed,the multiplication factor T must be decreased to verify the required rate of false alarm.On the other hand,as the number of non-coherently integrated pulses increases,the estimated noise power level increases and hence the thresholding constant is consequently decreased for the rate of false alarm to be held unchanged.The displayed results show also that the conventional OS scheme has the highest T values,the familiar CA algorithm comes next,and the new model CA OS(10)possesses the lowest values for the constant scale factor,given that M is kept unchanged.This means that the new model estimates the unknown noise power level more efficiently than the other two well-known models[16].

Fig.2 Thresholding constant versus false alarm rate of CA-,OS-,and CAOS-CFAR schemes processing M-sweeps for a reference window of 24 cells
It is well-known that the average of some of ordered samples gives higher performance than single ordered cases.This is actually the case of TM and OS.Additionally,by judiciously trimming the ordered samples,the TM detector may actually perform to some extent better than the OS detector in non-homogeneous situations.Fig.3 demonstrates this reality.This figure illustrates the same characteristics as the previous one but for the TM strategy instead of OS scenarios.As shown,the curves of the current scene behave like those of the previous figure but with smaller values of T.The TM algorithm with symmetrical trimming from the upper and lower ends of two cells gives lower T values than the OS technique.Note that the top value of the vertical axis in the current figure is 4 dB,whilst in the previous figure is 12 dB.This proves that the TM technique estimates the background level more efficiently than the conventional OS processor.As M increases,lower thresholding values are achieved and the novel model CA GTM occupies always the lowest location.In the preceding figure,on the other hand,the new version CA OS has approximately the same T values as the CA scheme for M=4 which means that its homogeneous performance tends to be the same as the CA procedure as M increases.The TM model of these modified versions,however,gives always better homogeneous performance than the CA detector which is taken as a reference of comparison in the CFAR world when the operating conditions are ideal.

Fig.3 Constant scaling multiplier versus rate of false alarm of CA-,TM-,and CATM-CFAR schemes processing M-sweeps for an estimation channel of 24 samples
From the results of these two figures,it is evident that the non-coherent integration of M pulses leads to estimating the noise power level more efficiently and this in turn results in enhancing the processor detection performance as predicted.
Now,we are going to display another sort of the processor characteristics to see what the bene fits that are offered by introducing the novel version over the conventional CFAR scenarios.These characteristics are concerned with the variation of the detection probability as a function of the primary target signal strength when the operating environment is purged of or comprised of spurious targets.The primary as well as secondary outlying targets are assumed to be fluctuating in accordance with the χ2model with two degrees of freedom(κ=2)and the results are obtained for a possible practical situation of equal signal strengths for interfering targets and the target of interest(INR=SNR or γ= α)as well as equal correlation coefficient for the two types of target returns.In the multiple-target situation,it is assumed that there is only one cell in each reference sub window(R1=R2=1)that is contaminated with interfering target returns.This category of numerical results comprises Figs.4–13 for the conventional processors as well as the new versions when the radar receiver based its decision on integrating two and four(M=2&4)consecu-tive pulses.Fig.4shows the homogeneous and multi-target detection performances of the new model CA OS(10)under the previous conditions for M=2.The displayed results of this figure illustrates that the partially-correlated curves are always embraced by the Swerling models(SWI&SWII).For weak signal strength,the SWI gives higher performance than the SWII and this behavior is fastly altered as the signal becomes strengthened for SWII to be the top and SWI to be the worst.Fig.5 repeats the same characteristics for the same detector but for four integrated pulses(M=4).It is evident that the family of curves of this plot acts as their corresponding ones in the previous figure with some gain.In other words,there is an enhancement in the processor performance as the number of integrated pulses augments.

Fig.4 Partially-correlated χ2target detection performance of CAGTM(9,2,0)scheme for N=24,M=2,R1=R2=1,κ=2,and Pfa=10-6

Fig.5 Partially-correlated χ2target detection performance of CAGTM(9,2,0)scheme for N=24,M=4,R1=R2=1,κ=2,and Pfa=10-6
Fig.6 and Fig.7 regenerate the previous two plots for the other novel version CA GTM under the same operating circumstances.A big insight into the behavior of the families of curves of these figures reveals that there is an improvement in the performance of this version in comparison with that of the above mentioned new model given that the background parameter values are maintained unchanged.The rest figures in this group are associated with the standard CFAR detection schemes.Fig.8 and Fig.9 are concerned with the conventional TM(2,2)algorithm with censoring of two cells from each end of the ordered samples of every reference subset.The homogeneous performance of this technique is inferior to that of novel version based on the same strategy of CFAR processing(CA GTM).However,its multitarget performance is superior to that of the CA GTM model since the number of interferers in each subset is inferior to the number of top excised samples(Ri<2,i=1,2).In other words,the heterogeneous behavior of this conventional model approaches its ideal performance on the condition that the number of infected cells lies within its allowable range(Rj≤N-N2,j=1,2).Fig.10 and Fig.11 describe the detection performance of the conventional OS(10)scheme in the absence as well as in the presence of outlying target returns amongst the candidates of the reference sub windows.It is noted that the performance in this case is acceptable but it does not attain the same degree of superiority as that of the TM procedure neither in homogeneous nor in heterogeneous situations.The last sub-group of this family of figures is devoted to the CA scenario which offering the simulation results displayed in Fig.12 and Fig.13.This processor is considered to be the optimum one in the field of CFAR detection which presents the top detection performance in ideal conditions.

Fig.6 Partially-correlated χ2target detection performance of CAGTM(2,2,0)scheme for N=24,M=2,R1=R2=1,κ=2,and Pfa=10-6

Fig.8 Partially-correlated χ2target detection performance of MLGTM(2,2,0)scheme for N=24,M=2,R1=R2=1,κ=2,and Pfa=10-6
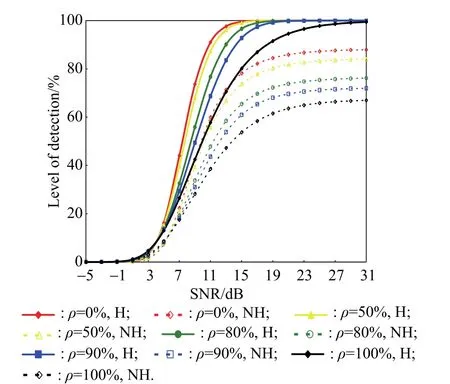
Fig.7 Partially-correlated χ2target detection performance of CAGTM(2,2,0)scheme for N=24,M=4,R1=R2=1,κ=2,and Pfa=10-6

Fig.9 Partially-correlated χ2target detection performance of MLGTM(2,2,0)scheme for N=24,M=4,R1=R2=1,κ=2,and Pfa=10-6

Fig.10 Partially-correlated χ2target detection performance of ML-GTM(9,2,0)scheme for N=24,M=2,R1=R2=1,κ=2,and Pfa=10-6

Fig.11 Partially-correlated χ2target detection performance of ML-GTM(9,2,0)scheme for N=24,M=4,R1=R2=1,κ=2,and Pfa=10-6

Fig.12 Partially-correlated χ2target detection performance of ML-GTM(0,0,0)scheme for N=24,M=2,R1=R2=1,κ=2,and Pfa=10-6

Fig.13 Partially-correlated χ2target detection performance of ML-GTM(0,0,0)scheme for N=24,M=4,R1=R2=1,κ=2,and Pfa=10-6
It is well-known that the CA behavior is drastically worse in the case where the condition of homogeneity is not fulfilled.This is actually the case that is demonstrated in the current plots where target masking is explicitly shown.Practically,target masking occurs when two or more targets are present such that one target is in the test cell and one or more targets are located among the reference cells.The presence of spurious target returns amongst the estimation cells raises the detection threshold and this in turn worsens the processor performance.As a general conclusion about the behavior of the classical adaptive strategies,as well as the two novel ones,against the situation of the operating environment,it is observed that:
(i)The processor performance is always enclosed by SWI and SWII models in such a way that SWI has higher performance for weak signal strength whilst SWII gives the top performance as the signal becomes strengthened.
(ii)The point of altering is shifted towards lower signal intensity as the number of integrated pulses increases.
(iii)There is a noticeable enhancement in the processor performance with non-coherent integration of M pulses.
(iv)The homogeneous performance of the novel model based on the TM algorithm surpasses that of the standard CA.
Let us now turn our attention to another figure of merit that distinguishes some CFAR schemes over others.This factor is associated with the required SNR to achieve a pre-assigned level of detection as a function of correlation coefficient for the two novel versions along with the more popular procedures in the domain of CFAR detection.The obtained results for this type of CFAR characteristics are displayed in Fig.14.This figure draws the required signal strength,against the strength of correlation among the target returns,to attain a detection probability of 90%for M=2 given that the operating environment is purged of any interferers.The family of curves of this plot varies slowly for weak correlation and continues in this mode till the samples become strongly correlated where the rate of increasing augments.This is the general behavior of the candidates of the current figure.

Fig.14 Ideal multi-pulse signal strength requested to achieve a detection level of 90%of CFAR schemes for partially-correlated χ2 target when N=24,M=2,κ=2,and Pfa=10-6
As a reference of comparison,the results of the fixed threshold detector are incorporated among the underlined curves.A big insight in the variation of the elements of the current figure demonstrates that the conventional OS(10)detector has the highest signal strength,the classical TM(2,2)comes next,the standard CA reserves the third position,the new model CA OS(10)occupies the fourth location,the optimum processor lies in the fifth place,and the novel version CA TM(2,2)requires the minimum SNR to achieve a detection level of90%.This means that this novel model outweighs,in its reaction against the SWII target fluctuation model,the Neyman-Pearson detector against its performance any detection processing is compared to measure its goodness.For the SWI fluctuation model,the fixed-threshold detector reserves its superiority as the plot indicates.To con firm this important result,Fig.15 and Fig.16 illustrate the required SNR to satisfy a given level of detection when the target of interest follows in its fluctuation SWII and SWI models,respectively,for M =4 and under the same parameter values as the previous figure.As Fig.15 demonstrates,the new model CA TM(2,2)needs a signal strength which is more weaker than that required by the optimum detector to achieve a given level of detection.On the contrary,Fig.16 shows that,for a pre-assigned detection probability,the demanded SNR by the fixed-threshold scheme is lower than that needed by the novel version CA TM(2,2).

Fig.15 Ideal multi-pulse signal strength requested to achieve a given detection level of CFAR schemes for partially-correlated χ2 target when N=24,M=4,ρ =0,κ =2,and Pfa=10-6

Fig.16 Ideal multi-pulse signal strength requested to achieve a given detection level of CFAR schemes for partially-correlated χ2 target when N=24,M=4,ρ =1,κ =2,and Pfa=10-6
In other words,the novel model CA TM(2,2)exceeds the Neyman-Pearson model when the searched target fluctuates according to the SWII model whilst the optimum detector rests the top in the case where the tested target fluctuates following the SWI model in its fluctuation.Fig.17 and Fig.18 repeat the same characteristics for the concerned processors under the same parameter values with the exception that the operating environment is of type target multiplicity taking into account that the primary and secondary outlying targets returned signals are of the same strength(γ = α)and following the same model in their fluctuation.The displayed results in these plots are obtained on the assumption that there is only one sample among the elements of each sub-window that is contaminated with spurious target returns(R1=R2=1).

Fig.17 Multi-target multi-pulse signal strength requested to achieve a given detection level of CFAR schemes for partially-correlated χ2target when N=24,M=3,R1=R2=1,ρ =0,κ=2,and Pfa=10-6

Fig.18 Multi-target multi-pulse signal strength requested to achieve a given detection level of CFAR schemes for partially-correlated χ2target when N=24,M=3,R1=R2=1,ρ =1,κ=2,and Pfa=10-6
All the CA based detectors,either pure CA or CA combined with OS or TM,have cutoff points beyond which they cannot reply the required level of detection as the shown curves demonstrate.In the case of SWII target fluctuation model, the cutoff points lie at higher detection level than in the case of SWI model.Additionally,the combination of CA and OS improves the heterogeneous performance of CA but it is still unable to verify any needed level of detection.The enhancement rate in the SWII model is better than in the case of the SWI model.The conventional OS and TM algorithms are capable to satisfy any detection level given that the number of interferers in each reference sub-window is within its allowable range.This is explicitly shown in the displayed results under consideration.
Finally,the last group of results is interested in calculating the false alarm rate performance of the standard as well as the modified versions of CFAR schemes to see to what extent the processor maintains its rate of false alarm constant in non-homogeneous situation and the rate of its variation if it is not fixed.This group includes Fig.19 and Fig.20.Fig.19 illustrates the actual false alarm rate as a function of the interferer’s strength for SWI and SWII models of the outlying target fluctuation when only one cell is infected in each reference sub-window and there are two integrated consecutive sweeps on the condition that the design false alarm rate is taken as 10-6.By examining the curves of this figure,we observe that the classical OS and TM detectors are the only ones,among the tested group of CFAR processors,which are capable of keeping their probability of false alarm approximately unchanged irrespective of the intensity of outlying returns.

Fig.19 Partially-correlated χ2target false alarm rate performance of CFAR detectors for N=24,M=2,R1=R2=1,κ=2,and Pfa=10-6

Fig.20 Multi-pulse actual probability of false alarm of CFAR processors for χ2target fluctuation model when N =24,M=3,κ=2,R1=R2=1,INR=-5 and 25 dB,and Pfa=10-6
Additionally,they provide constant level of false alarm either the interfering target follows in its fluctuation SWI or SWII model.All the other schemes,where CA plays an important part in their behavior,fall in maintaining a constant level of false alarm in their reaction against extraneous targets.The false alarm probability of these algorithms decreases as the interfering signal becomes strengthened and the rate of decreasing in the SWII fluctuation model is higher than that in the case of the SWI model.
To see to what extent the correlation among the interfering target returns can affect the false alarm rate performance of the under examination detectors,Fig.20 draws the actual false alarm rate against the correlation coefficient of the outlying target returns when the interfering signal is very weak(γ=-5 dB)and for more strengthened interferers(γ=25 dB)under the same conditions as the preceding figure except that the number of integrated pulses is 3 instead of 2.For weaker interference intensity,all the tested CFAR processors have approximately fixed the probability of false alarm with some tolerance of the constant value relative to the designed level which is 10-6.When the interference level becomes stronger,all the schemes which depend,in its structure,upon the CA technique have worst false alarm rate performance especially when the target returns are de-correlated(SWII model)with some improvement in the case where these returns are fully correlated(SWI model).
The classical OS(10)and TM(2,2)procedures are the only ones capable of keeping the rate of false alarm constant irrespective to the strength of correlation among the spurious target returns.In other words,these two distinct detectors maintain their false alarm rate unchanged in an operating environment the interference level of which is either weak or strong.
5.Conclusions
This paper presents an enhancement of neighborhood targets detection in clutter environment.It is obtained by the novel version CA GTM strategy.Fusion of particularly decisions of internal CA and GTM scenarios within this new CFAR model provides better final decision and detection.Here,we analyze the detection performance evaluation of the new versions,(CA OS&CA TM)through the GTM scheme,as well as the standard well-known adaptive schemes operating in an environment in which there are numerous of spurious targets other than the target of interest.The secondary outlying targets as well as the primary one are assumed to be fluctuating in accordance with χ2-distribution with two-degrees of freedom.We have derived expressions for the detection and false alarm probabilities of the new versions along with other standard processors and compared their performances with performances of several other well known CFAR detectors.Analysis has shown that the novel versions have homogeneous detection performance higher than that of the CA processor which is taken as a reference of comparison for any new formula of CFAR techniques.Moreover,with a proper choice of trimming parameters,the novel model CA TM presents an ideal performance that surpasses that of the Neyman-Pearson detector on condition that the tested target fluctua-tion obeying the SWII model.In other words,this modified version of CFAR schemes rivals, and even outweighs it, the Neyman-Pearson detector,which is our reference of comparison,if the following conditions are satisfied for its operation:the background environment is homogeneous,the radar receiver includes a noncoherent integrator amongst its fundamental components,and the target of interest fluctuates and obeys χ2-distribution in its fluctuation with de-correlated sweeps(SWII model).Under these conditions,the CA GTM novel version gives detection performance higher than that obtained by the optimum detector.However,their(CA OS&CA TM)multitarget performances are modest even they have little enhancement in comparison with the performance of the classical CA algorithm.
Although the CFAR technique is useful in many practical applications,it is not without its disadvantages and can be considered as a necessary evil.It introduces an additional loss compared to optimum detection,and in some systems the number of pulses processed needs to be large to keep the loss low.Furthermore,the operator is usually given no indication that there may be missed detections.In radars with a simple CFAR,interference or hostile jamming can lower the sensitivity of the radar without the operator even being aware that it is happening since the jamming is not visible on the scope.Thus,some means should be included to inform the operator when the detection probability has been lowered because of the CFAR action.
[1]EL MASHADE M B.M-sweeps detection analysis of cell-averaging CFAR processors in multiple target situations.IEE Radar,Sonar Navigation,1994,141(2):103–108.
[2]EL MASHADE M B.Analysis of the censored mean-level CFAR processor in multiple target and nonuniform clutter.IEE Radar,Sonar Navigation,1995,142(5):259–266.
[3]EL MASHADE M B.Multipulse analysis of the generalized trimmed mean CFAR detector in nonhomogeneous background environments.International Journal of Electronics and Communications AEÜ,1998,52(4):249–260.
[4]EL MASHADE M B.Detection analysis of CA family of adaptive radar schemes processing M-correlated sweeps in homogeneous and multiple target environments.Signal Processing,2000,80(5):787–801.
[5]HAN D S.Detection performance of CFAR detectors based on order statistics for partially correlated chi-square targets.IEEE Trans.on Aerospace and Electronic Systems,2000,36(4):1423–1429.
[6]EL MASHADE M B.Exact analysis of OS modified versions with noncoherent integration.Journal of Electronics,2004,21(4):265–277.
[7]RICKARD M A.Fundamental of radar signal processing.McGraw-Hill Education,2005.
[8]EL MASHADE M B.Analysis of cell-averaging based detectors forχ2fluctuating targets in multitarget environments.Journal of Electronics,2006,23(6):853–863.
[9]EL MASHADE M B.Performance analysis of OS structure of CFAR detectors in fluctuating target environments.Progress in Electromagnetics Research C,2008,2:127–158.
[10]EL MASHADE M B.Performance analysis of CFAR detection scheme processing M-sweeps in the presence of outliers.Advances in Microwave and Wireless Technologies,2013,1(2):16–33.
[11]EL MASHADE M B.Performance of the developed versions of CFAR schemes processing non-coherently integrated Mpulses in the presence of outliers.Measuring Behaviour,2014,3(1):7–21.
[12]EL MASHADE M B.Analysis of adaptive detection of partially-correlatedχ2targets in multitarget environments.Parallel and Cloud Computing Research,2013,1(2):17–39.
[13]IVKOVIC D,ANDRIC M,ZRNIC B.Falsealarm analysis of the CATM-CFAR in presence of clutter edge.Radioengineering,2014,23(1):66–72.
[14]EL MASHADE M B.Partially-correlatedχ2targets detection analysis of GTM-adaptive processor in the presence of outliers.International Journal of Image Graphics&Signal Processing,2014,6(12):70–90.
[15]IVKOVI’C D,ANDRI’C M,ZRNI’C B.A new model of CFAR detector.Frequenz,2014,68(3/4):125–136.
[16]EL MASHADE M B.Heterogeneous performance evaluation of sophisticated versions of CFAR detection schemes.Radioelectronics and Communications Systems,2016,59(12):536–551.
杂志排行

Journal of Systems Engineering and Electronics的其它文章
- Quantum fireworks algorithm for optimal cooperation mechanism of energy harvesting cognitive radio
- Cognitive anti-jamming receiver under phase noise in high frequency bands
- Multi-channel signal parameters joint optimization for GNSS terminals
- Waveform design for radar and extended target in the environment of electronic warfare
- Cramer-Rao bounds for the joint delay-Doppler estimation of compressive sampling pulse-Doppler radar
- Pulse interleaving scheduling algorithm for digital array radar